

Briefly: gold and the rest of the precious metals market are likely to decline in the next several weeks/months and then start another powerful rally. Gold’s strong bullish reversal/rally despite the USD Index’s continuous strength will likely be the signal confirming that the bottom is in.
Welcome to this week's Gold Investment Update. Our most recently featured medium-term outlook remains the same as the price moves align with our expectations (or at least are not really against them). On that account, there are parts of the previous analysis that didn’t change at all in the earlier days and are written in italics.
The key thing that happened this week is that we finally saw an important reversal, and gold is on a perfect path to forming a clear weekly reversal candlestick. Beginning the year with one would be a remarkably bearish indication.
Let’s start today’s analysis with a recap of what recently happened on the fundamental front.
The Weekly Fundamental Roundup
Heightened uncertainty had asset prices running in circles this week, as the push and pull of hawkish economic data intensifies investors’ confusion. Along the way, gold and mining stocks outperformed, while silver, oil, and the S&P 500 suffered.
However, with resilient economic growth depressing the bulls’ pivot hopes, we expect the New Year’s mauling to reach nearly all corners of the financial markets, with mining stocks among the hardest hit. Therefore, while the GDXJ ETF has demonstrated relative strength, it’s likely only a matter of time before the next bout of panic arrives.
Will the Gold Price Labor in 2023?
With gold, silver, mining stocks and the S&P 500 ending the Jan. 5 session in the red, a hawkish data deluge zapped some of the recent optimism. Moreover, while the crowd continues to follow the post-GFC playbook (wait for a dovish pivot), the post-pandemic imbalances are far from resolved, and the ramifications are far from priced in. To explain, we wrote on Dec. 27:
We've warned repeatedly that a major decline in U.S. GDP growth and the labor market are required for a dovish 180; and with economic output revised higher twice in Q3, and tracking north of 3% in Q4, the fundamental backdrop supports higher, not lower, interest rates.
Also, with resilient employment still far from the levels required to normalize wage inflation, continued hiring only strengthens the case for a higher FFR in 2023…. The Fed needs employment to contract to reduce wage inflation. In contrast, U.S. firms are still increasing their headcount, which intensifies the imbalance between labor demand and supply.
Consequently, it’s no wonder why the Atlanta Fed’s Wage Growth Tracker and the U.S. Bureau of Labor Statistics' (BLS) average hourly earnings metric both re-accelerated in November; and the longer this persists, the more it supports a higher peak FFR.
To that point, while the crowd has been flat-footed in its assessment of the economic backdrop, our fundamental thesis continues to unfold as expected.
Please see below:
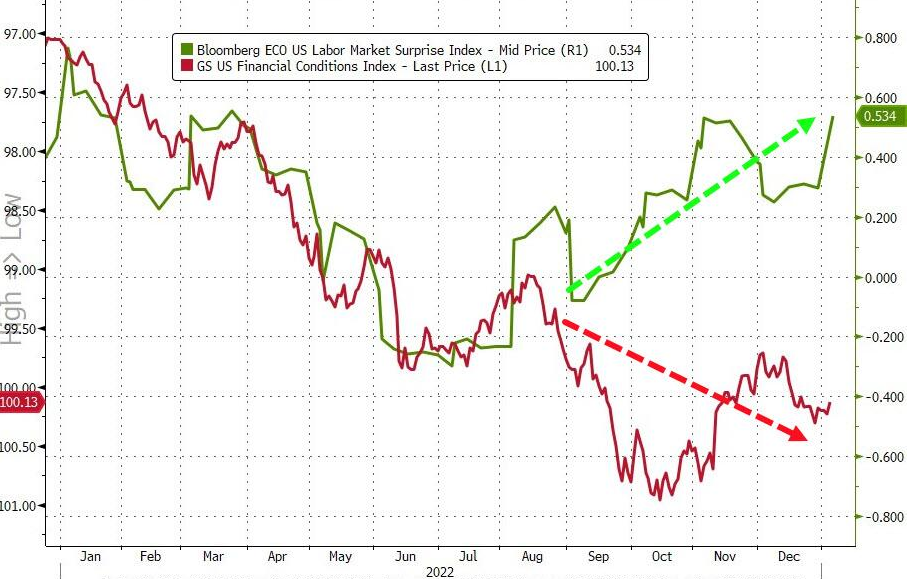 Source: Bloomberg/ZeroHedge
To explain, the green line above tracks Bloomberg’s U.S. Labor Market Surprise Index, while the red line above tracks the inverted (down means up) Goldman Sachs Financial Conditions Index (FCI).
As it relates to the former, the green line rises when an economic data point outperforms economists’ consensus estimate; and with resilient employment prints hitting the wire in recent months, they continued to defy expectations.
As a result, while the U.S. federal funds rate’s (FFR) rapid rise helped propel the FCI higher (red line falling), the U.S. labor market remains resilient, and highlights why the FFR needs to rise even more to create the demand destruction necessary to reduce inflation.
Remember, JOLTS job openings outperformed expectations on Jan. 4, and there are nearly 4.5 million more job openings than unemployed Americans. Thus, the Fed needs to eliminate the excess to bring labor supply and demand back to its pre-pandemic equilibrium; and since we’re nowhere near that point, the prospect of a dovish pivot was, and still is, out of touch with economic reality.
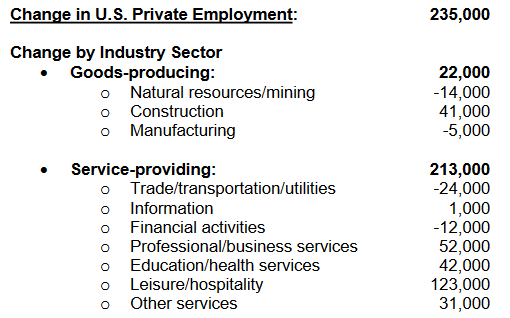
As further evidence, ADP released its National Employment Report on Jan. 5; and with private payrolls coming in at 235,000 versus 150,000 expected, the hawkish implications are underestimated by market participants.
Please see below:
 Source: Investing.com
Furthermore, while ADP's data does not correlate well with U.S. nonfarm payrolls in the short term, it's extremely useful in gauging the health of the U.S. labor market.
Please see below:
 Source: ADP
To explain, the report stated that a “job resurgence was seen in the last two months of 2022,” and that “hiring was strong across small and medium establishments.” In addition, if you analyze the table above, you can see that the employment gains were broad-based, with the U.S. service sector experiencing increases across most industries.
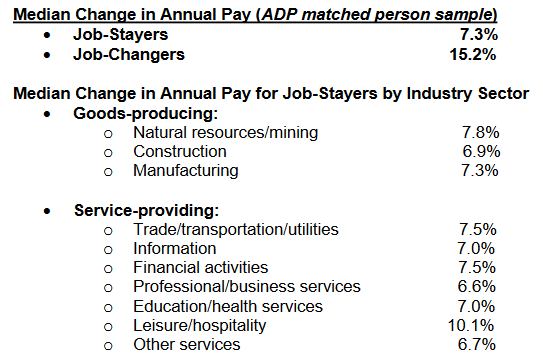
Even more revealing, the wage inflation results highlight why the FFR should seek higher ground in 2023.
Please see below:
 Source: ADP
To explain, the report showed that job-stayers and job-switchers recorded 7.3% and 15.2% increases in their median annual pay. For context, the latter pertains to Americans that leave their jobs for other opportunities.
Likewise, the industry breakdown highlights how all areas of the U.S. economy experienced wage growth of more than 6%, and the figures do not support the Fed normalizing output inflation to 2% anytime soon.
So, while we warned throughout 2021 and 2022 that the crowd underestimated the resiliency of demand, the dynamic is still present in 2023. As such, the fundamental outlooks are bullish for the FCI, the FFR, real yields and the USD Index, and we expect all four to surpass their 2022 highs in 2023.
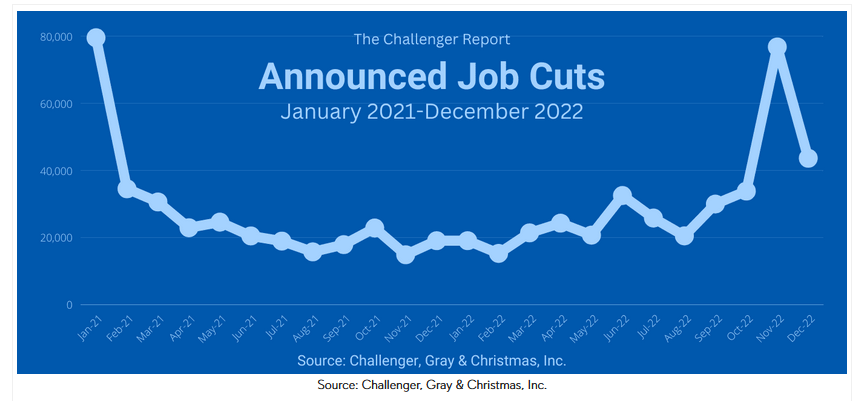
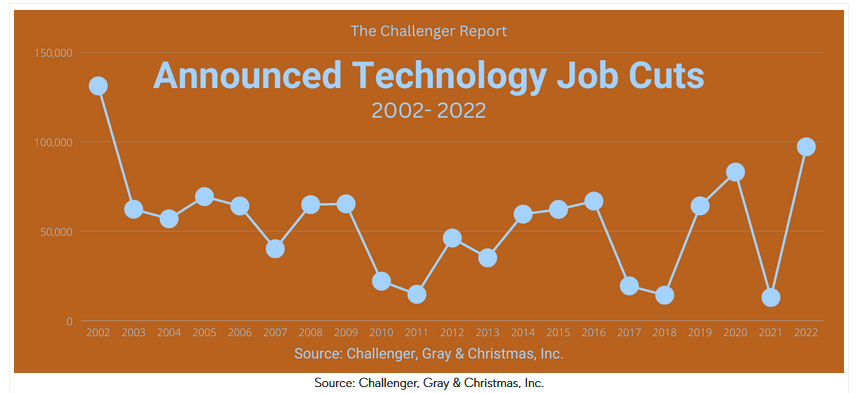
Continuing the theme, Challenger, Gray & Christmas Inc. released its job cuts report on Jan. 5. An excerpt read:
“U.S.-based employers announced 43,651 cuts in December, falling 43% from the 76,835 announced in November. It is up 129% from the 19,052 cuts announced in the same month in 2021.”
“In 2022, employers announced plans to cut 363,824 jobs, up 13% from the 321,970 cuts announced in 2021. It is the second-lowest recorded total since Challenger began tracking monthly job cut announcements in 1993, with 2021 being the lowest.”
Please see below:
In addition, while consolidated job cuts rose by 13% year-over-year (YoY), the results were highly resilient for a few reasons.
- 2021 saw the lowest annual job cuts on record, which skews the 2022 YoY comparison to the upside.
- The Fed hiked interest rates 17 times in 2022 (25 basis point increments), and economic activity should slow when the FFR rises.
But third, the boom-and-bust environment spurred by unprecedented pandemic stimulus had an outsized effect on the technology sector; and with layoffs concentrated in this industry, the consolidated figures are better than they appear on the surface. The report added:
“The bulk of cuts remain in the Technology sector. In December, 16,193 cuts occurred at companies in this industry for a total of 97,171 for the year, the leading job-cutting industry in 2022. It is up 649% from the 12,975 that occurred in Technology in 2021.”
“With the downturn in cryptocurrencies, Fintech firms announced 1,670% more cuts in 2022 than the prior year: 10,476 cuts in 2022 compared to 529 in 2021.”
Thus, the technology sector accounted for 37% of December’s job cuts, which highlights the strength present in other industries.
Please see below:
Overall, the fundamentals continue to align with our expectations: the economic backdrop supports a higher FFR, which makes the outlook bearish for risky assets like gold. Remember, when risk-free assets offer a return of 4.25%+, with the yield poised to rise with the FFR, it reduces the attractiveness of risky assets that can experience capital losses.
Consequently, while the dovish pivot crowd assumes that rate cuts will sink the FFR, lower the return of risk-free assets, and propel risk assets higher, their optimism should suffer a crisis of confidence in the months ahead.
Is Silver Showing Cracks in Its Foundation?
While the S&P 500 may be forming a short-term bottom, the index has gone nowhere for roughly two months. Furthermore, we warned on Oct. 26 that overzealous bulls would face resistance at these levels. We wrote:
With two of the four largest companies in the S&P 500 suffering, the squeeze may have already run its course. Moreover, while positioning is still heavily short, the index offered tactical value near 3,600, not 3,850.
In addition, with the bearish medium-term fundamentals rearing their ugly head, and the Fed poised to raise interest rates by 75 basis points next week, stocks offer a poor risk-reward proposition when the FFR should hit 4%.
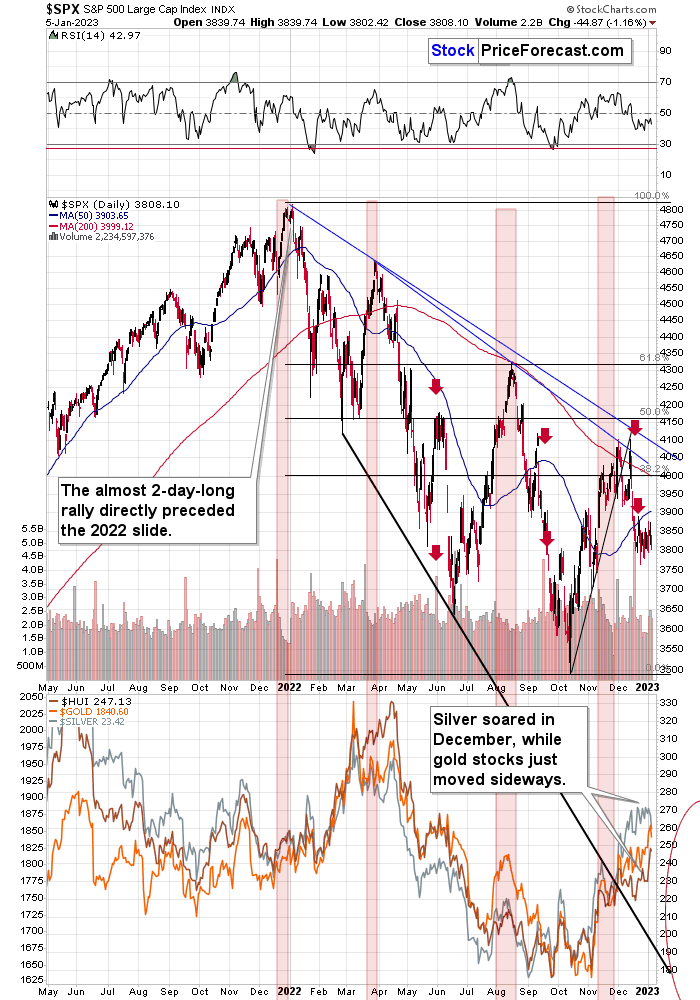
As a result, with the S&P 500 ending the Jan. 5 session at ~3,808, the moral of the story is that risk assets are unattractive when cash returns are 4.25%+. Therefore, while the silver price remains well above its 2022 lows, we expect the white metal and the S&P 500 to hit new nadirs in 2023.
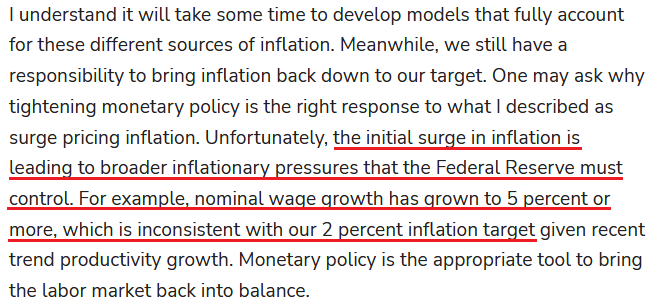
To that point, the FOMC reiterated its hawkish message recently, and the crowd is ignoring the implications at their own peril. For example, Minneapolis Fed President Neel Kashkari released a research report on Jan. 4; and despite our plethora of warnings about unanchored inflation throughout 2021, Kashkari began his article with a mea culpa. He wrote:
“To state clearly, I was solidly on ‘Team Transitory,’ so I am not throwing stones. But many of us – those inside the Federal Reserve and the vast majority of outside forecasters – together made the same errors in, first, being surprised when inflation surged as much as it did and, second, assuming that inflation would fall quickly.”
Thus, while the consensus still assumes “that inflation [will] fall quickly,” they underestimate the challenges that lie ahead. Remember, we've warned for many months that wage inflation was highly problematic. We wrote on Mar. 31, 2022:
Investors are miscalculating the resiliency of inflation. With supply-chain disruptions primarily blamed for the recent surge, market participants don’t realize that a severe shock to demand is needed to cool the pricing pressures. Moreover, with the U.S. labor market on fire and robust wage growth akin to pouring gasoline, how can the Fed expect inflation to calm when consumers remain flush with cash?
The housing market is the canary in the coal mine. Robust wages, all-time high checkable deposits and record employment opportunities allow buyers to service their mortgage debt with little worry. However, to reduce inflation, the Fed needs to flip the script; and this means fewer employment opportunities, lower wages, and eventually, lower checkable deposits.
Likewise, with Kashkari making the point for us on Jan. 5, he’s only nine months late to the party.
Please see below:
 Source: Minneapolis Fed
More importantly, while the crowd remains steadfast that a pivot is on the horizon, we warned that substantial economic weakness is required for a dovish 180, and that’s not the economic reality right now. So, while Kashkari and the FOMC’s poor forecasting record can be debated, his message should prove prescient in the months ahead.
Please see below:
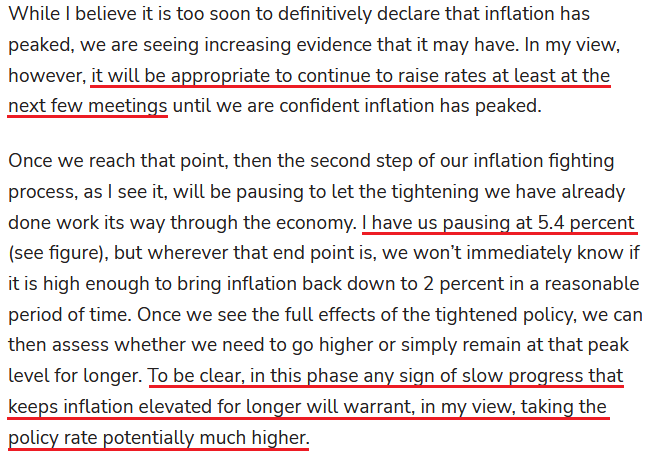 Source: Minneapolis Fed
While Kashkari wrote: “I have us pausing at 5.4 percent,” please note that a pause is not a pivot, and the current FFR is 4.25%. In addition, with a resilient labor market poised to keep the pressure on the Fed, the chances of “taking the policy rate potentially much higher” are greater than investors realize.
Remember, fundamental asset returns are driven by the difference between what’s priced in and what actually happens; and right now, the FFR is expected to peak at ~5% and the consensus expects rate cuts in 2023. As a result, there is plenty of room for hawkish re-pricing in the months ahead.
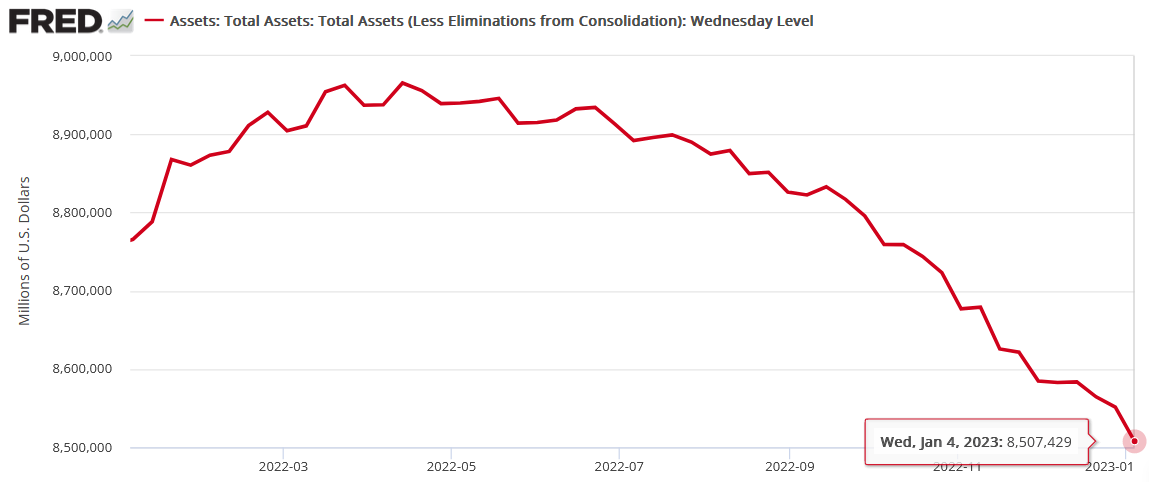
Finally, while the FFR garners all of the attention, the Fed’s balance sheet sunk to a new weekly low on Jan. 4 (updated on Jan. 5), and QT should intensify the liquidity drain over the medium term.
Overall, while the silver price shows signs of slippage, it's still materially above its fundamental and technical values. With the Fed poised to continue its hawkish crusade, and inflation poised to linger longer than the consensus expects, hawkish realities should depress sentiment in the months ahead. As such, we expect material downside before silver's bear market ends.
The Bottom Line
Hawkish data continues to annoy the bulls, as each optimistic print delays their hopes for a dovish pivot. But, while the S&P 500 has suffered in recent weeks, the PMs have largely ignored the developments. Therefore, while gold, silver and mining stocks have been relative outperformers, they should play catch-up when the next sell-off occurs; and as the drama unfolds, mining stocks and silver should be the hardest hit.
In conclusion, the PMs declined on Jan. 5, as the USD Index and the U.S. 10-Year real yield rose. Furthermore, while the EUR/USD bucked the trend in December, it often moves inversely to the U.S. 10-Year real yield. So, new highs for the latter (the red line) in 2023 should sink the former (the green line) and help propel the USD Index to new heights.
What to Watch for Next Week
With more U.S. economic data releases next week, the most important are as follows:
- Jan. 10: NFIB Small Business Optimism Index
Small businesses account for a large portion of hiring in America, so the growth, employment and inflation data are important to monitor.
- Jan. 12: Consumer Price Index (CPI)
The crowd will overreact to the CPI results, as they always do. However, a normalization to 2% should be much more difficult than expected, and one month’s print won’t change the medium-term implications.
All in all, economic data releases impact the PMs because they impact monetary policy. Moreover, if we continue to see higher employment and inflation, the Fed should keep its foot on the hawkish accelerator. If that occurs, the outcome is profoundly bearish for the PMs.
Technically Speaking
Let’s start today’s technical discussion with a quick check of copper prices.
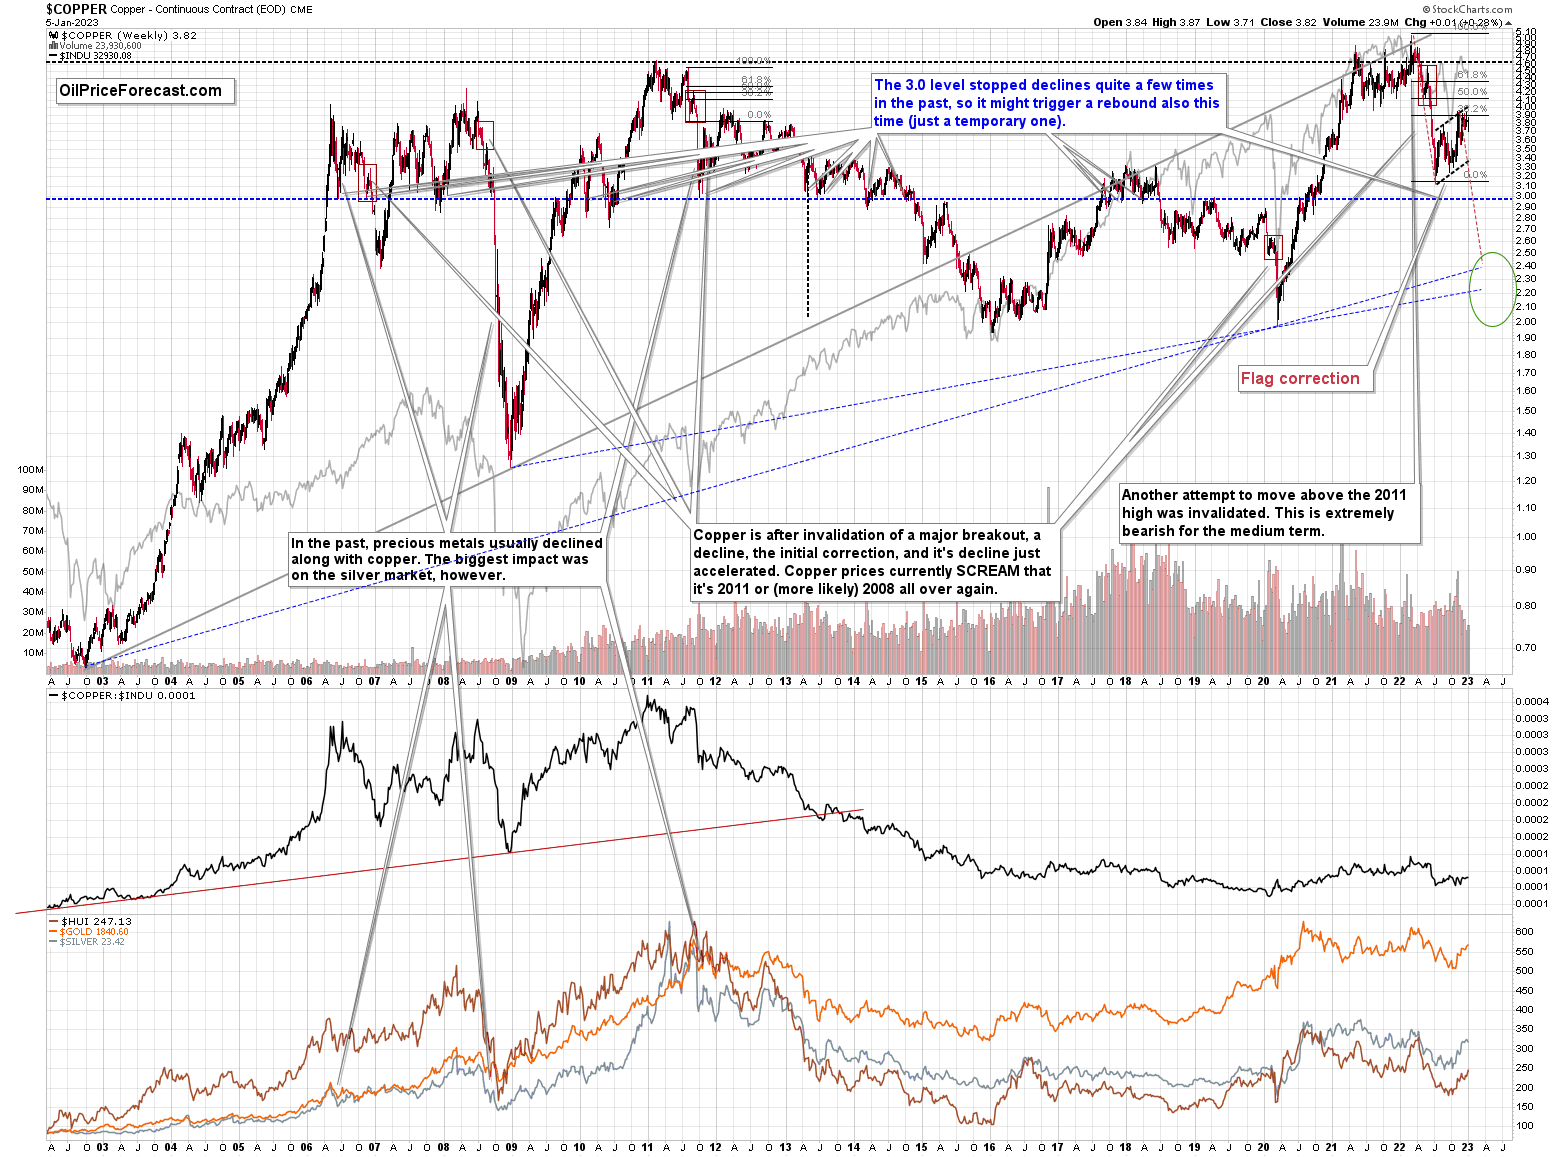
Overall, everything I wrote about it last week remains up-to-date:
Copper recently CLEARLY invalidated another attempt to move above its 2011 high. This is a very strong technical sign that copper (one of the most popular commodities) is heading lower in the medium term.
No market moves up or down in a straight line (well, the 2008 slide appears to have been an exception), and a short-term correction doesn’t necessarily invalidate the bigger trend. For the last couple of months, copper has been trading sideways, but it didn’t change much regarding the outlook.
In fact, it made my previous target area even more likely. You see, the consolidation patterns are often followed by a move that’s similar to the move that preceded them. In this case, the previous 2022 decline was quite significant, and if it is repeated, one can expect copper to decline well below 3.
Actually, copper could decline profoundly and bottom in the $2.0-2.4 area. That’s where we have rising, long-term support lines and also the previous – 2016 and 2020 – lows.
Flag patterns (which we just saw in copper) tend to be followed by price moves that are similar to ones that preceded them. I marked this on the above chart with red, dashed lines. This method supports a copper price’s move to around $2.4.
Given the recent flag pattern and the size of the previous decline (and its pace), it seems quite likely that it could take another 2-7 months for copper to move to about $2.4. Late March / early April seem the most likely time target given the current data.
Interest rates are going up, just like they did before the 2008 slide. What did copper do before the 2008 slide? It failed to break above the previous (2006) high, and it was the failure of the second attempt to break higher that triggered the powerful decline. What happened then? Gold declined, but silver and mining stocks truly plunged.
Again, copper is after invalidation of a major breakout, a decline, and a correction. Copper prices currently SCREAM that it’s a variation of 2008 all over again. This is extremely bearish for mining stocks (especially juniors) and silver.
On a short-term basis, we saw an intraweek reversal this week, which doesn’t bode well for copper’s short-term outlook.
Having said that, let’s check junior miners’ really big picture.
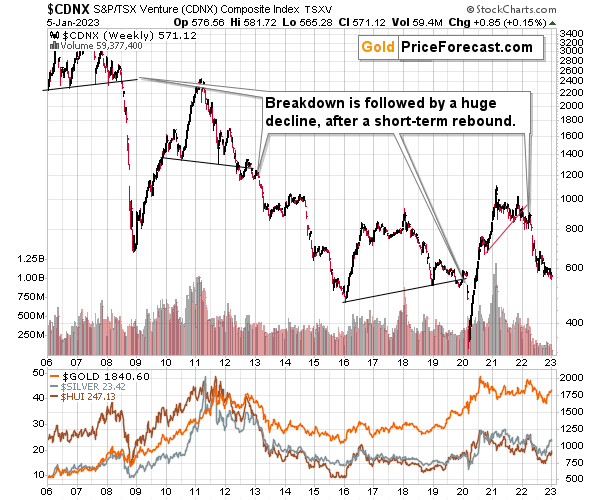
I previously commented on the above chart in the following way:
The Toronto Stock Exchange Venture Index includes multiple junior mining stocks. It also includes other companies, but juniors are a large part of it, and they truly plunged in 2008.
In fact, they plunged in a major way after breaking below their medium-term support lines and after an initial corrective upswing. Guess what – this index is after a major medium-term breakdown and a short-term corrective upswing. It’s likely ready to fall – and to fall hard.
So, what’s likely to happen? We’re about to see a huge slide, even if we don’t see it within the next few days.
Just like it was the case in 2008, the move higher that we saw before the final (biggest) slide in gold, silver, and gold stocks (lower part of the chart), we didn’t see a visible rally in the TSX Venture Index. Just as the index paused back then, it paused right now.
Currently, it’s trading at about 600, and back then, it consolidated at about 2500. The price levels are different, but the overall shape of the price moves (lack thereof) is similar. This serves as a signal, that the recent upswing in the PMs was not to be trusted.
The above is one of the weakest (from the technical point of view) charts that is see across the board right now. There is a strong long-term downtrend visible in the TSX Venture Index, and if stocks slide similarly as they did in 2008, the TSXV could truly plunge – perhaps even to the 300 level or lower.
The important short-term detail is that the TSXV just broke to new yearly lows. This is a major (yet barely noticed by most) indication that the next big move lower is about to start.
Having said that, let’s turn to gold.
Let’s start with context:
Between 2020 and now, quite a lot happened, quite a lot of money was printed, and we saw a war breaking out in Europe. Yet gold failed to rally to new highs.
In fact, it’s trading very close to its 2011 high, which tells you something about the strength of this market. It’s almost absent.
Truth be told, what we see in gold is quite in tune with what we saw after the 2011 top, and in particular, shortly after the 2012 top. We can also spot similarities between now and 2008. The long-term gold price chart below provides details.
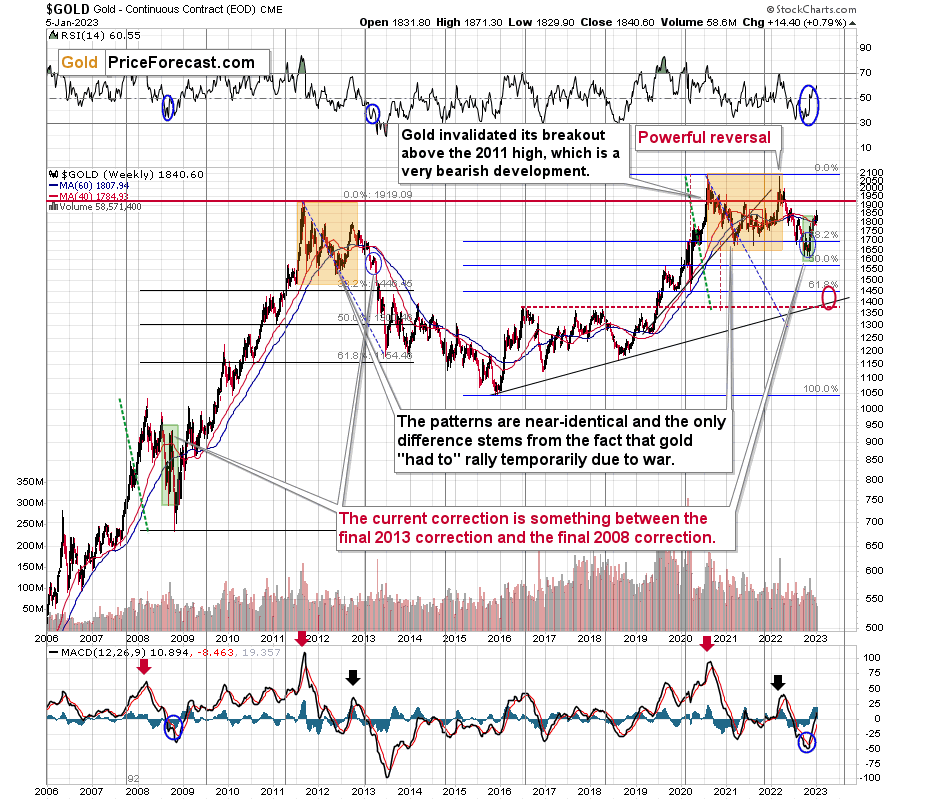
Looking at the gold market from a broader point of view, the corrective upswing that we saw recently is something between what we saw in 2013 and what we saw in 2008.
The recent move higher was bigger than what we saw in 2013 but smaller than what we saw in 2008.
No wonder – the current situation in general is similar to both. In fact, that’s why I’ve been writing about this dual similarity for many months now.
Back in 2013, the final of the pre-slide corrective upswings ended with gold below its 40- and 60- week moving averages (marked with red and blue, respectively).
Back in 2008, the final of the pre-slide corrective upswings took gold visibly above both above-mentioned moving averages.
And now? We saw a move above both moving averages, but only a bit above them – the move was not as profound as the one that we saw in 2008.
The most interesting thing about the above is that when gold did finally move above those moving averages in 2008, it meant that the rally was practically over and that it was the perfect time to be shorting the precious metals market – especially mining stocks.
Now, as far as the link to 2013 is concerned, it remains perfectly intact, with the additional note that the final corrective upswing is bigger this time – more like what we saw in 2008.
Gold is sometimes forced to react to some geo-political events as the safe-haven buying kicks in, but these moves are usually short-term lived. Looking at long-term charts helps to keep things in proper perspective.
Consequently, my previous comments remain up-to-date:
Based on the above chart, it’s quite clear that the situation that is now being repeated. The patterns marked with orange rectangles and blue ellipses are almost identical (also in the MACD indicator, and to a lesser extent in the RSI indicator).
Sure, the situations are not identical, as this time we had a Russian invasion of Ukraine that pushed gold temporarily higher. Other than that, the situations are extremely similar.
Based on the stage of the self-similarity and the confirmed breakdown below the $1,700 level, gold is now likely to slide.
Based on the analogy to 2013, it’s not only likely to slide, it’s likely to slide profoundly in a sharp manner. These may be the last days or hours before the slide fully begins.
How low is gold likely to go during this upcoming big medium-term decline? Perhaps as low as its 2020 low, around $1,450-1,500. Then, after a rebound, quite likely to be at or slightly below $1,400.
I realize this is far from the current price, but nonetheless, this target area appears justified in my opinion. There are two important Fibonacci retracements based on the 2015-2020 rally that gold can bounce from (it recently bounced from the 38.2% retracement). These are 50% and 61.8% retracements.
The support provided by the 61.8% retracement is strengthened by the 2020 low and the support provided by the 50% retracement is strengthened by the 2019 high.
However, based on gold’s self-similarity to 2013, it seems that we’re about to see a slide that’s bigger than what we’ve been seeing so far this year. This time – based on the similarity – gold is likely to decline profoundly, but no longer in the back-and-forth mode. If gold formed its next local low at the 50% retracement (so at about $1,560), then it might do so still within the declining, short-term trend channel (sometime in September).
However, if gold is to stick to the link to 2013, then it should decline more rapidly. In this case, the technique that can help us estimate the short-term target is the one that says that after a breakdown from a trend channel, price is likely to move approximately by as much as the height of the previous trend channel. In this case, gold could break below the trend channel soon and then decline even more. Based on the height of the trend channel, the above means that a move to the 61.8% retracement as the next downside target is more likely than a move to the 50% retracement.
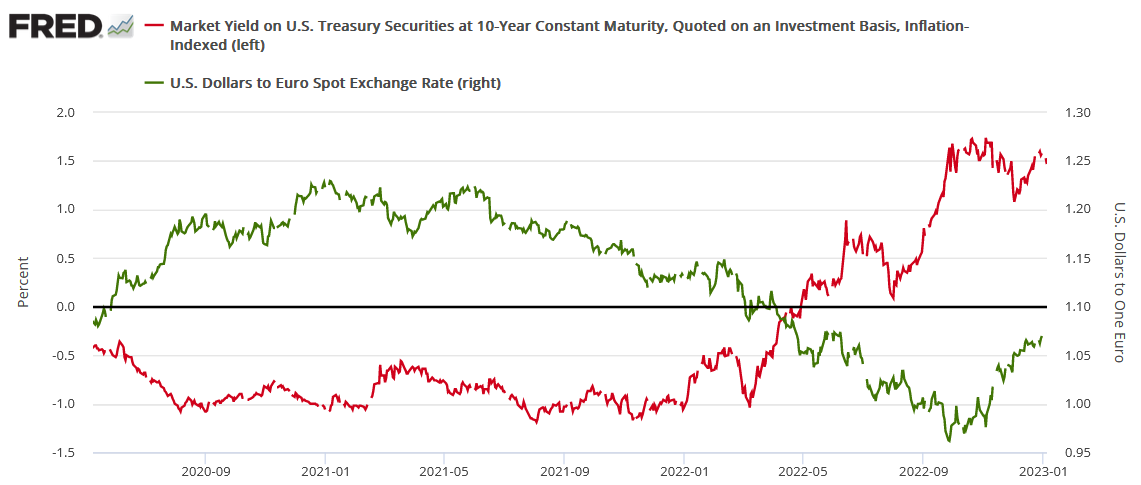
I previously wrote that the above-mentioned decline in gold would likely be linked to a breakdown in the EUR/USD below 1, and we already saw both: decline in gold, and a breakdown in the EUR/USD below 1. The implications remain bearish.
Having said that, let’s zoom in to see gold’s short-term price moves.
Gold started this year with a quick rally, but it was mostly erased. It’s still above its mid-2022 high, but will it stay there for much longer?
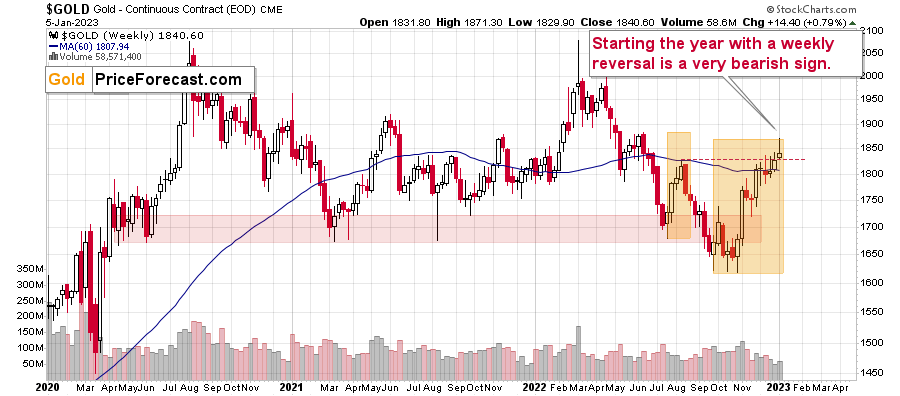
The above chart features gold prices in terms of weekly candlesticks. As you can see, it just approached its August high, and it’s trying to break above those highs once again. The previous attempts failed, so the question is whether this attempt will succeed.
I doubt it. Given the shape of this week’s candlestick, a decline from here is much more likely. After all, that’s what prices tend to do after reversal candlesticks – they change direction, and there’s no doubt that the most recent short-term move was to the upside.
Of course, the week is not over yet, but given the lack of a decent rally in today’s pre-market trading, it’s likely that the weekly reversal will become a fact shortly.
Again, this is a very powerful bearish indication.
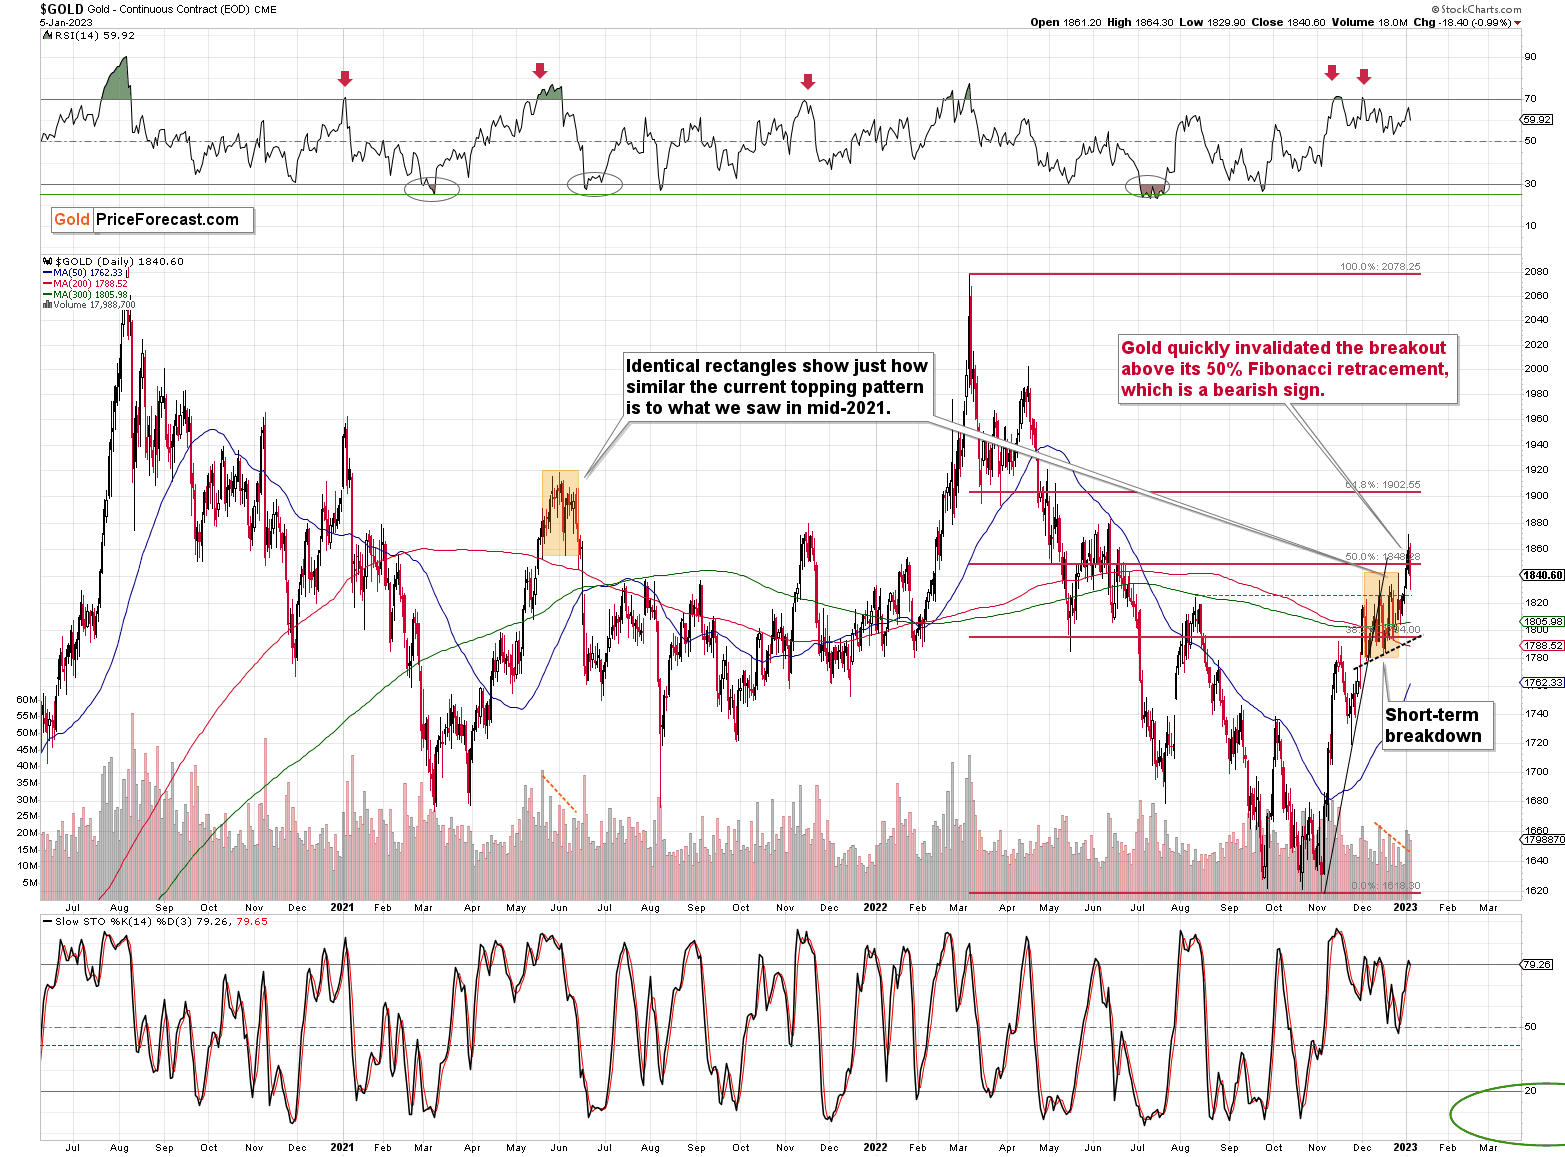
From a short-term point of view, we see that the gold price moved to its 50% Fibonacci retracement level, and then moved back down below it. In other words, gold invalidated its breakout above this important resistance level, just like I’d been expecting it to.
I copied the mid-2021 topping pattern to the current situation. I marked the period from the first intraday high to the start of the decline, and I marked it from the intraday high to the intraday low of the pattern.
Those are not identical, but there is still much similarity present.
Interestingly, both patterns were preceded by similarly sharp rallies, which were preceded by a broad bottom, which in turn were preceded by a decline of about $2,000.
The difference is now that gold has moved to new intraday highs, while back in mid-2021, it hadn’t. Then again, nothing specific happened on the USD/JPY exchange rate back then, as it was only recently when the Bank of Japan moved to the hawkish camp.
The above-mentioned similarity as well as the invalidation of the breakout above the 50% Fibonacci retracement together paint a very bearish picture for gold’s short-term outlook.
Having said that, let’s take a closer look at the silver market.
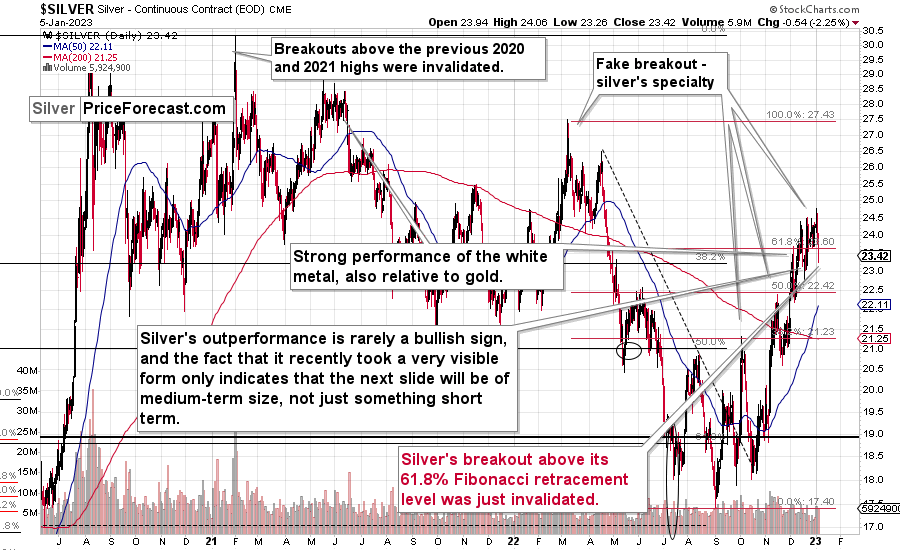
While silver had outperformed gold in recent weeks, it finally declined in a big way this week.
Why would this be the case? I spoke about it in yesterday’s video analysis, but to clarify once again, silver’s outperformance of gold is something based on who enters the market at specific times (the investment public tends to go in at the end of the rally and it tends to favor silver over gold), while gold is owned and bought primarily by the “big players.”
Tax loss harvesting in late December and early-January buy-backs is a reason why the entire market might have rallied initially this year, and it might have distorted the fact that silver did continue to outperform gold for weeks.
Now, it finally declined significantly yesterday, and it moved to fresh yearly lows. It also closed below the 61.8% Fibonacci retracement, suggesting that the rally is now completely over.
The implications are bearish for the short term.
Also, my last week’s comments about the relative performance of silver and miners remain up-to-date [I’m updating the percentages to reflect the true monthly price changes]:
What a boring month!
At least for those who monitor the performance of junior mining stocks. It’s after the Dec. 31 close, and the monthly price change for the GDXJ ETF is $0.12 (0.34%). That’s very little – next to nothing.
During the same time, gold futures rose by $66.30 (3.77%) and silver prices rose by $2.26 (10.38%) in December.
I know that I’ve been writing about this over and over again, but please note how extreme this signal is! It’s crystal-clear even on a monthly basis. The signal, of course, comes from markets’ relative performance.
Miners tend to underperform the gold price close to market tops, and silver tends to outperform close to market tops. The above monthly numbers are practically screaming: “it’s a top!” As always, very few are listening, as it’s easy to get carried away by the primary emotion that’s out there in the market, and when prices are rallying, people become bullish. They tend to ignore the signs and focus on the feelings.
Even the wording in the messages that we receive changes. The phrases “I feel the market is about to move higher” or “it seems to me that this rally won’t end” are common, but messages with indications and evidence supporting that bullish case are very rare or (usually) absent.
Please note that while I’ve been analyzing the precious metals sector’s outlook recently, my trading focus has been on the junior mining stocks – and indeed, miners have barely moved higher this month, even despite a sizable move lower in the USD Index.
But you said that miners are driven by stocks, and the S&P 500 is down by over 5% this month. Aren’t miners weak just because of the stocks? As a result, there is no underperformance of gold—no bearish indication? No.
While it’s true that stocks’ performance tends to impact juniors’ prices, it’s also true – to a considerable extent – in the case of the silver market.
Silver’s price hasn’t been weak this month. Quite the opposite – silver soared by over 10%.
If silver soared so much, then apparently the impact the stock market had on the precious metals sector was not as significant. Consequently, it’s very likely that the indications coming from the relative performance of miners and silver are truly bearish for the precious metals sector.
Looking at silver from a long-term point of view helps to see the forest, not just individual trees.
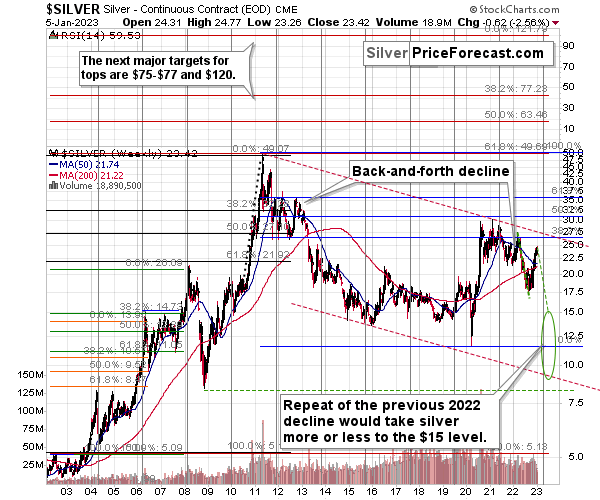
When looking at silver from a long-term point of view, it’s still obvious that the recent move higher was most likely just a corrective upswing.
What happens after corrections are over (as indicated by, i.e., silver’s outperformance)? The previous trend resumes. The previous trend was down, so that’s where silver is likely headed next.
Besides, the long-term turning point for silver is due in several months, and if silver repeats its previous 2022 decline, then it will bottom close to the turning point and also close to the $15 level– in the first half of 2023.
It’s likely to repeat its previous 2022, because that’s what tends to happen after flag patterns, and what you see on silver’s short-term chart between September and yesterday appears to be a flag pattern.
However, will silver only repeat its previous 2022 performance and not decline more than it already has?
Based on the analogies to 2008 and 2013, the latter is more likely. The 2013 slide was bigger than the initial decline that we saw in 2012. And the final 2008 slide was WAY bigger than what we saw before it.
Due to its industrial uses, silver is known to move more than gold, in particular when the stock market is moving in the same way as gold does. Since I think that gold and stocks are both likely to slide, silver is indeed likely to decline in a truly profound manner. Quite likely lower than just $15.
Consequently, my prediction for silver prices remains bearish, as does the outlook for the rest of the precious metals sector.
Let’s not forget that rising interest rates are likely to negatively impact not just commodities, but practically all industries. This will likely cause silver’s price to decline profoundly, as silver’s industrial demand could be negatively impacted by lower economic growth (or a decline in economic activity).
Consequently, it seems that silver will need to decline profoundly before it rallies (to new all-time highs) once again.
Having said that, let’s take a look at what happened in mining stocks.
History tends to repeat itself. Not to the letter, but in general. The reason is that while economic circumstances change and technology advances, the decisions to buy and sell are still mostly based on two key emotions: fear and greed. They don’t change, and once similar things happen, people’s emotions emerge in similar ways, thus making specific historical events repeat themselves to a certain extent.
For example, right now, gold stocks are declining similarly to how they did in 2008 and in 2012-2013.
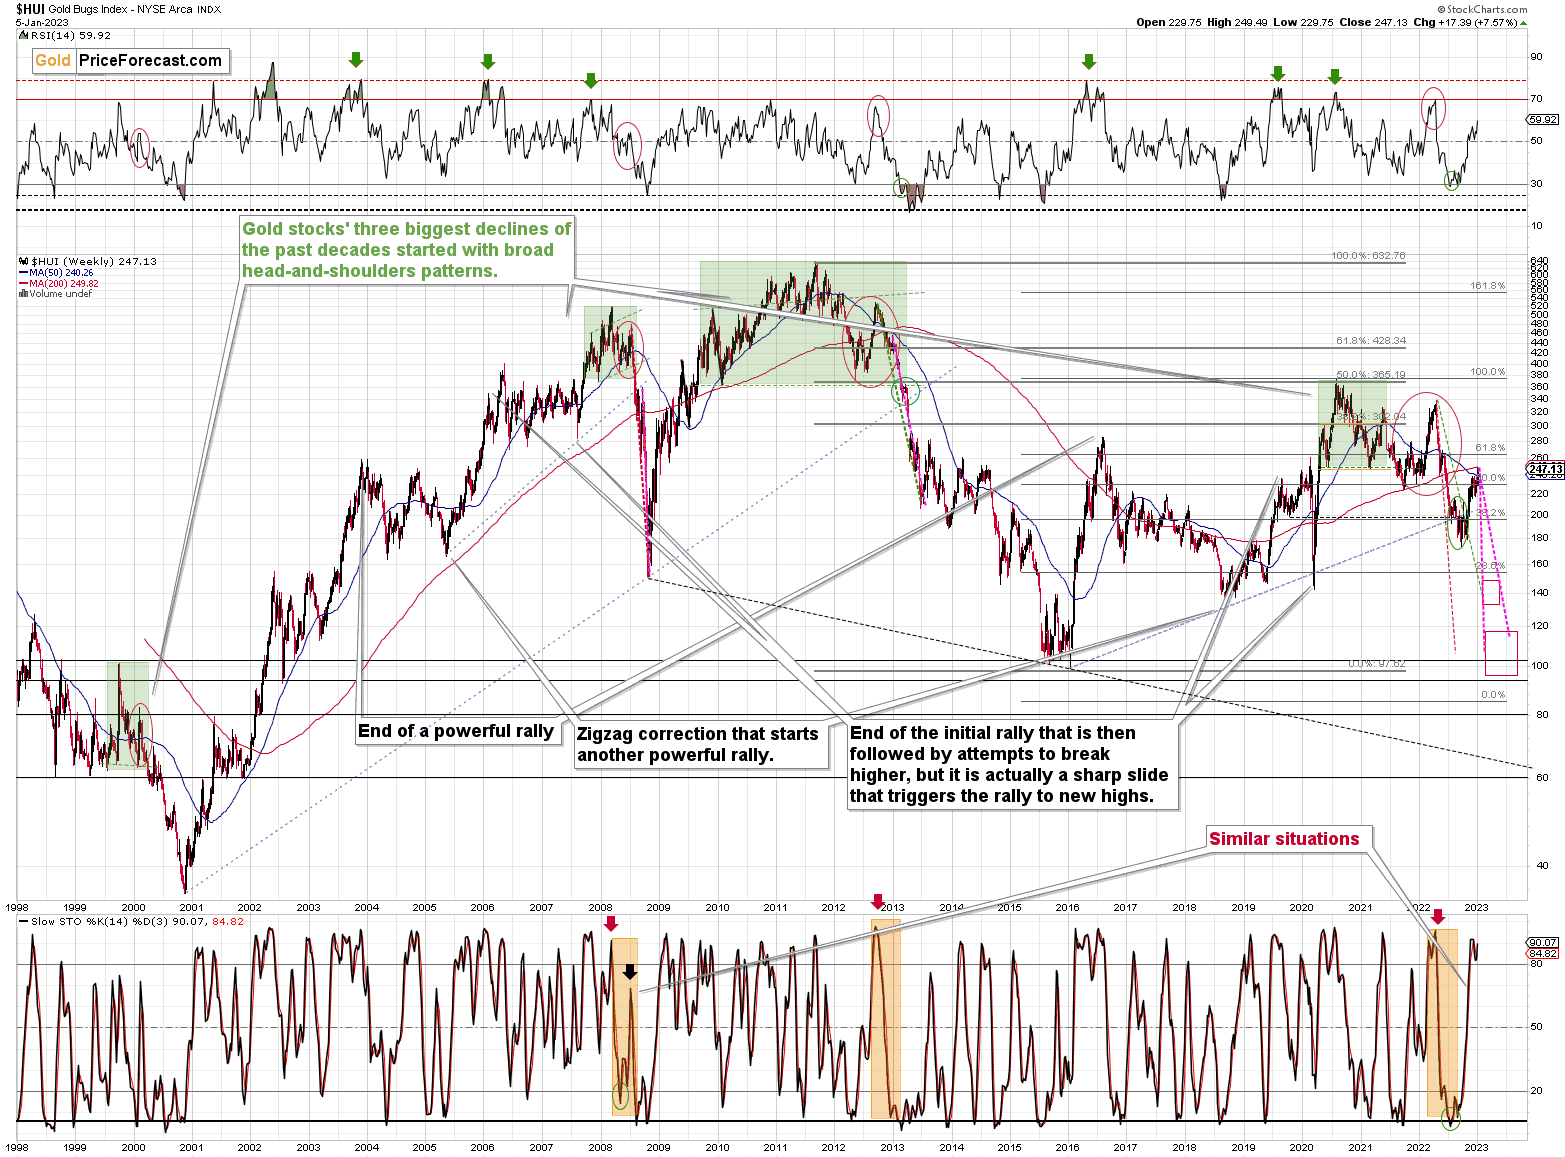
For now, gold stocks didn’t erase their previous gains that we saw this week, but the situation being what it is on the gold market (as discussed above) and the stock market (as I’ll discuss below), it seems to be only a matter of time before gold stocks slide.
For many months, I’ve been writing that the situation in the HUI Index is analogous to what we saw in 2008 and in 2013. Those declines were somewhat similar, yet different, and what we see now is indeed somewhere in between of those declines – in terms of the shape of the decline.
At first, the HUI Index declined just like it did in 2013, and the early-2022 rally appears to be similar to the late-2012 rally. However, the correction that we saw recently is also similar to the late-2012 rally.
Since the history doesn’t repeat itself to the letter, but it rhymes, is it that odd that we now saw two corrective upswings instead of one? Not necessarily.
This is especially the case that the 2008 decline had one sizable correction during the big decline. It’s not clearly visible on the above chart due to the pace of the 2008 slide, but it’s definitely there. You can see it more clearly in one of the below charts.
So, no, the recent rally is not an invalidation of the analogies to the previous patterns, it continues to rhyme with them in its own way. And the extremely bearish implications for the following months remain intact.
How low can the HUI Index fall during the next big downswing?
As it’s the case with gold and silver, a move back to the 2020 lows is definitely in the cards. Please note that this level is also strengthened (as support) by other major lows: the 2019, 2014, and 2008 ones.
However, I wouldn’t rule out a move even lower on a temporary basis. If gold were to decline to about $1,450-1,500, it would mean that it would double its current 2022 decline. If the HUI Index does that, it will move below 150.
So, all in all, 100-150 is my current target area for the upcoming slide in the HUI Index.
All right, let’s zoom in and see how mining stocks declined in 2008.
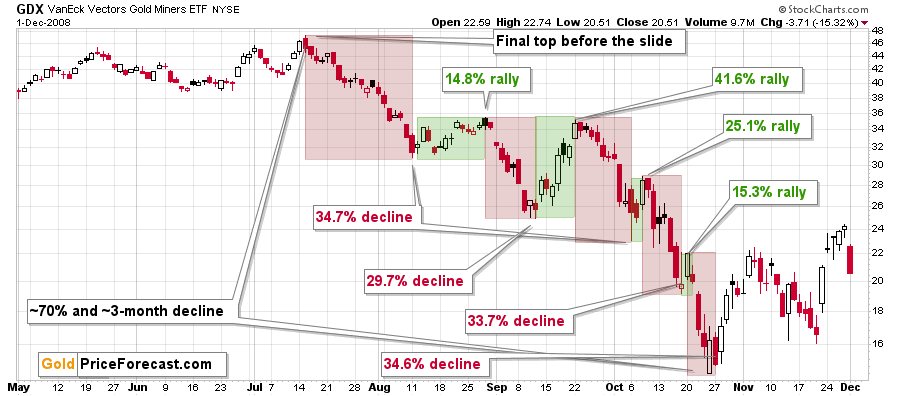
Back then, the GDXJ ETF was not yet trading, so I’m using the GDX ETF as a short-term proxy here.
The decline took about 3 months, and it erased about 70% of the miners’ value. The biggest part of the decline happened in the final month, though.
However, the really interesting thing about that decline – that might also be very useful this time – is that there were five very short-term declines that took the GDX about 30% lower.
I marked those declines with red rectangles. After that, a corrective upswing started. During those corrective upswings, the GDX rallied by 14.8-41.6%.
Do you know how much the GDX ETF has rallied from its September 2022 bottom? It moved up by 46.7%. This means that the move higher now is very similar to the corrective (!) upswing that we saw in September 2008. The analogy was not broken – it remains intact, and it points to much lower prices in the future.
Just like gold, miners too failed to move above their 50% Fibonacci retracement based on the 2022 decline, and that’s bearish.
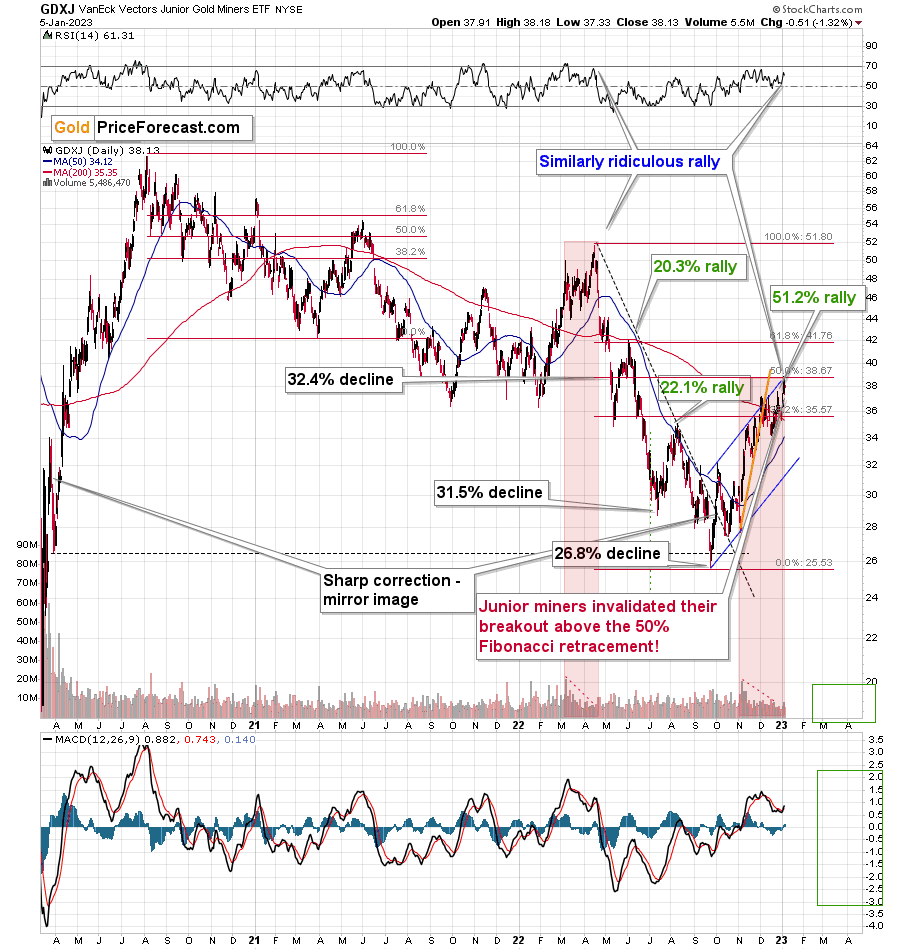
Moreover, the current situation is very similar to what we saw in April 2022, and I marked that with red rectangles.
The rather flat top at first, and then a false breakout. That’s how the 2022 decline started. And it’s quite possible that it’s the way in which the 2023 decline started as well.
Speaking of analogies, earlier today (and yesterday), I discussed the analogy to mid-2021. The GDXJ’s performance also supports this link. Back then, junior miners had corrected a bit more than half of the preceding decline before sliding again, and this time, they corrected approximately half of the preceding decline.
Interestingly, after the mid-2021 correction, the pace of the decline picked up, and miners declined almost twice as fast. And yes, this could happen in the following months as well.
And yes, this means that another decline could take the GDXJ all the way down to its 2020 low, or very close to it.
On the below chart, I marked just how perfectly the recent price moves played out according to the Elliott Wave Theory.
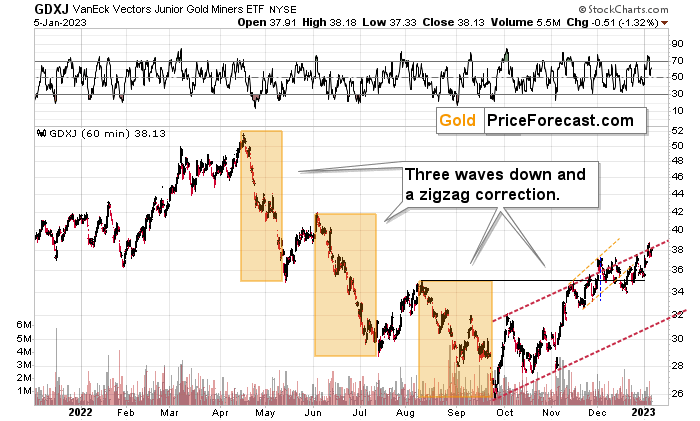
Of course, EWT is not the only tool that one could use, and I find other technical tools more useful, but still, this kind of pattern-following is uncanny.
The classic EWT pattern is three waves down (I marked those with orange rectangles) and then a correction consisting of two smaller waves.
That’s exactly what we have seen in recent months. The September–now pattern appears to be the above-mentioned correction. This created a classic ABC correction (flag) pattern.
I previously wrote that the Dec. 1 small breakout above the upper red line didn’t have meaningful bullish implications as it hadn’t been confirmed. And indeed, it was invalidated. The same happened yesterday.
Now, since this pattern is complete, another huge 3-stage move lower can – and is likely – to unfold. This is very bearish for junior mining stocks (as well as for gold, silver, and probably other commodities and stocks), and the fact that juniors are already showing weakness relative to gold (the latter was almost flat yesterday, while miners declined) serves as a bearish confirmation. As always, I can’t guarantee anything, but in my view, the profits that can be reaped on this upcoming slide can be enormous.
Meanwhile, the relative performance of junior miners compared to senior miners continues to deteriorate in a medium-term trend.
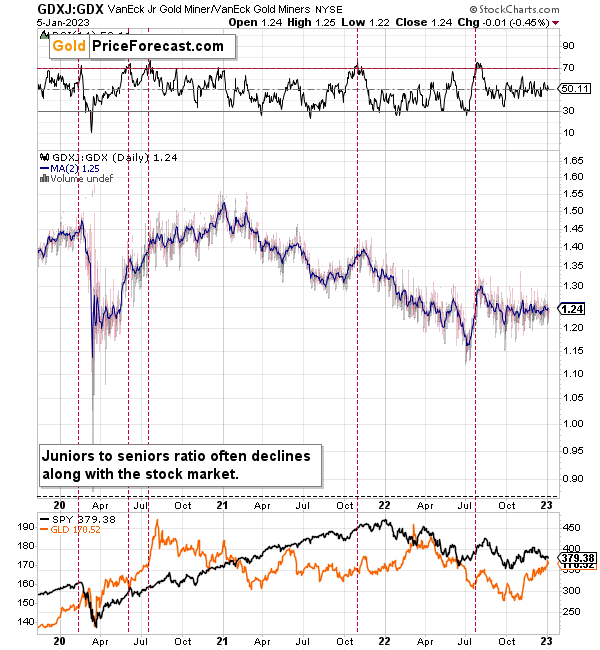
During this quick upswing, juniors rallied relative to seniors, but this is just a very short-term move that’s within a short-, and medium-term downtrends.
This implies bigger declines in the GDXJ in the future.
Also, let’s not forget about the forest while looking at individual trees. By that, I mean looking at how gold stocks perform relative to gold. That’s one of the major indications that the current situation is just like what we saw at the 2012 top.
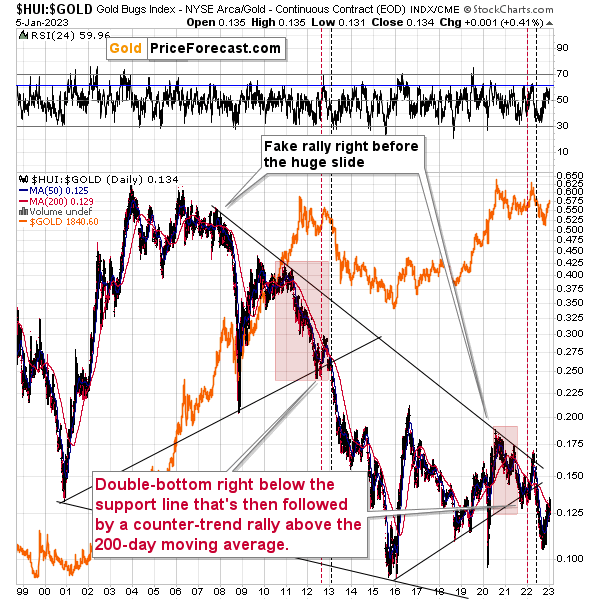
The situation in the gold stock to gold ratio is similar to what we saw in late 2012 and early 2013. The HUI to gold ratio invalidated its first attempt to break lower (marked with red, dashed lines), but after a corrective upswing, it then broke lower more decisively. That’s what I marked using black, dashed lines.
Recently, we saw a quick upswing in the ratio, but that’s not a game-changer – even the biggest declines had corrections in the past.
If history is to rhyme, we’re about to see a profound decline. In fact, we’re likely already past its beginning.
Also, please note that the pattern that we currently see, which started in early 2016, is somewhat similar to what happened between 2003 and 2008.
Back in 2008, the breakdown from the consolidation resulted in sharply lower ratio values and much lower prices of gold stocks.
So, if the situation is analogous to 2012-2013, we’re likely to see a big decline in the following weeks/months, and if it’s analogous to 2008, we’re likely to see an enormous decline in the following weeks/months.
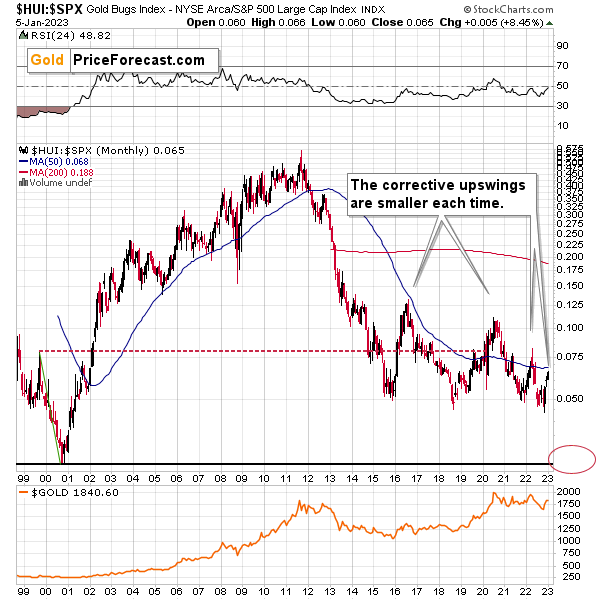
Interestingly, the situation in the gold stocks to other stocks ratio (HUI Index vs. S&P 500 Index) provides the same implications but from a different angle.
The corrective upswings that we’ve been seeing since 2015 are getting smaller and smaller. The current one is visibly smaller than what we saw last year.
Consequently, it seems that the ratio is ripe for a breakdown below the 0.05 level. The next support is provided by the all-time low at 0.026. And yes, with the ratio at 0.065 right now, this implies a decline by about 60%. If the HUI Index were to decline by 60% right now, it would have to move to about 100. If the stock market declined as well, it would imply the HUI was even lower.
Declining stock prices would only add fuel to the bearish fire (after all, gold stocks are… just stocks) and that’s exactly what’s likely to happen.
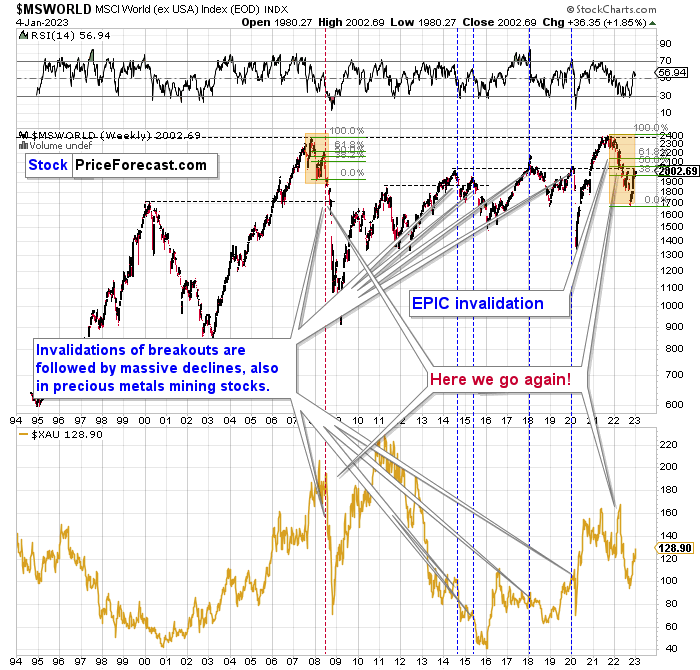
Just like what we saw in the case of copper, gold, and mining stocks, world stocks corrected about 38.2% of their preceding decline.
And recently, they corrected a bit more – almost half of the preceding decline.
Please note that the initial decline was now bigger than what we saw in 2008. Back then, stocks corrected about 61.8% of their initial decline before tumbling. If stocks are not able to do the same thing now – and they might not be – then the following slide could be even bigger than what we saw in 2008. Naturally, this would be profoundly bearish for junior mining stocks.
This means that nothing really changed, and the situation remains extremely bearish based, i.e., on the analogy to what we saw after previous invalidations of long-term breakouts.
As a reminder, in early 2022, I wrote that the situation was very bearish as invalidations of previous breakouts were usually followed by massive declines – not just in stocks but also in precious metals.
When stocks invalidated their 2006 breakout in 2008, their prices truly crumbled.
We also saw that on a smaller scale in 2014, 2015, and early 2018.
We’re seeing it right now.
To clarify, we’re actually seeing the aftermath of the invalidation. The huge decline is already taking place.
The difference between now and 2008 is that back then the slide was more volatile, and we didn’t really see a visible correction during the plunge. This time, the decline is more measured, and we saw a correction to one of the most classic retracements imaginable – the 38.2% one. This correction doesn’t change the trend, which remains down.
Based on what happened in 2008, it seems that stocks are about to move much lower in the following months.
Let’s take a look at the markets from a more short-term point of view and from the U.S. perspective.
The S&P 500, like global stocks, corrected a bit more than the 38.2% of the previous decline. And now they turned south, invalidating this small breakout. At the same time, they broke below the rising support line, which makes the outlook even more bearish. Consequently, my previous comments on the above chart remain up-to-date:
The broad market moved lower this week, and there are two good reasons to think that this time, the small move lower is just the beginning of a much bigger move to the downside.
One of the reasons is that this move lower came right after the triangle-vertex-based turning point. The declining black and red lines (both dashed) intersect at more or less the very recent top. As their name says, those turning points mark… Well, turning points. And since the most recent short-term move was to the upside, it currently has bearish implications.
The second reason is that stocks now broke below their rising support line (marked with a solid black line), and that’s not what happened during the two previous small moves lower.
The analogy in the price-volume link (marked with red rectangles) also points to much lower prices in the stock market.
Additionally, please note that stocks tried to move above their previous highs and the declining blue resistance line – and they failed. The invalidation served as yet another sell signal. It’s absolutely no wonder that we’re seeing a significant short-term decline right now.
Stocks paused recently, and it seems that they are ready to slide any day now. After all, the sideways trading created a flag pattern, and this is a “continuation pattern.”
Why is this important for gold and silver investors and traders? Because the last two big moves took place more or less in line with each other – in stocks and in precious metals (and miners). The slide in stocks could also trigger something similar in the case of commodities like crude oil. The same thing is likely to happen again this time, especially given what’s happening in the USD Index.
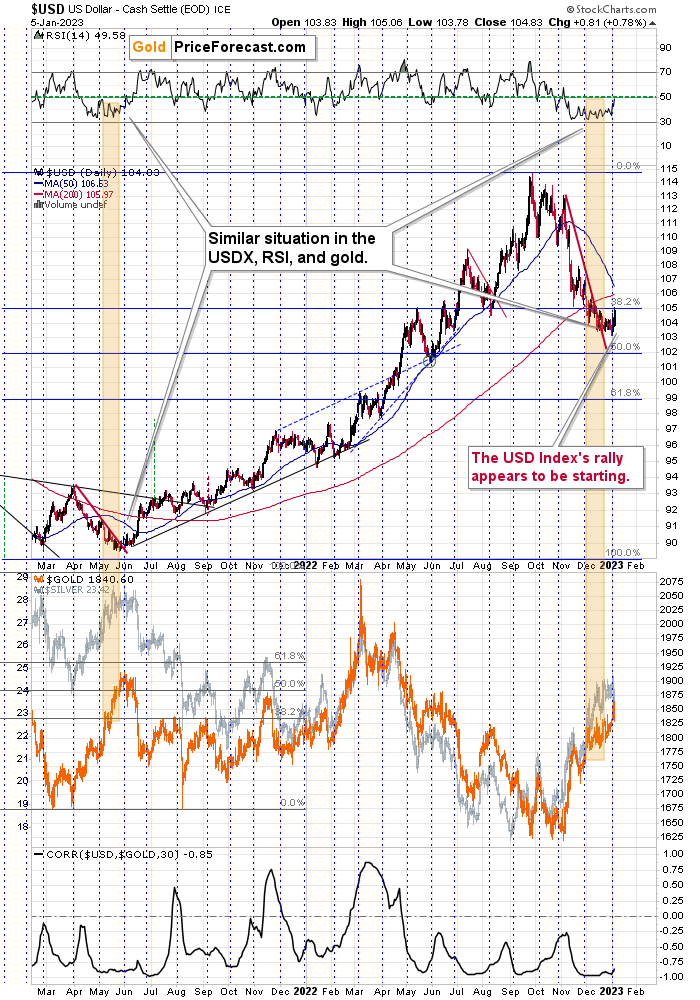
Namely, the USD Index finally showed sizable short-term strength and moved higher in a meaningful way.
Since this comes after a monthly turning point and the lengthy consolidation that’s similar to the mid-2021 one (also in the RSI indicator – visible in the upper part of the chart), the implications are very bullish.
From a long-term point of view, the breakout above the 2016 and 2020 highs in the USDX has been fully verified.
All this means that the USD Index is likely to move higher, which, in turn, is likely to trigger declines in the precious metals sector. The relative performance of gold, silver, and mining stocks indicates that the precious metals sector just can’t wait for a good reason to start its next huge move lower. It looks like they’re about to get it.
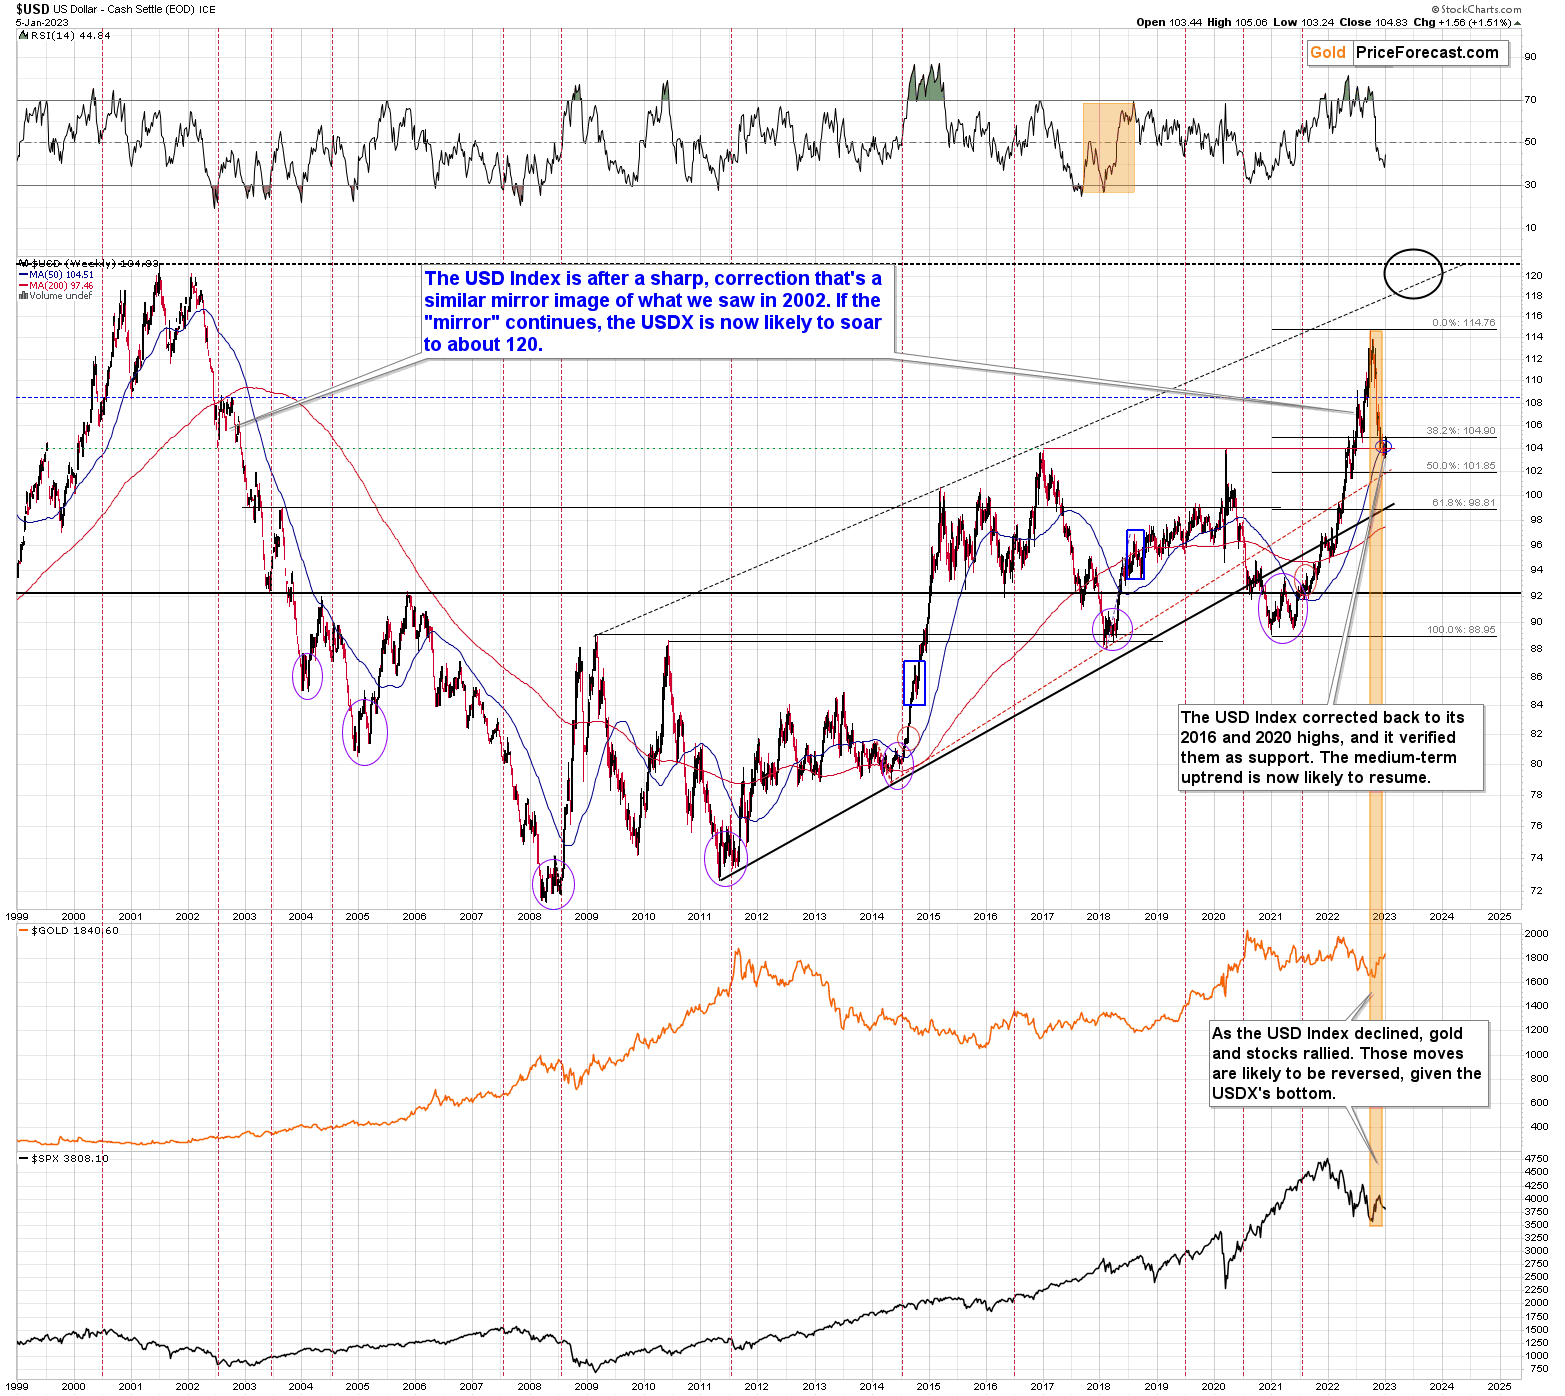
As I indicated previously, the 2016 and 2020 tops (as well as the 2002 low and the 1999 top) currently serve as very strong support at about 104 level.
To clarify, the highest of those highs has 103.5 as the highest daily closing price.
This means that there was no breakdown recently and any tiny attempts were quickly invalidated.
Conversely, based on this week’s rally, it appears that the bottom is already behind us as the support held.
This means that gold, silver, and mining stocks are likely to decline profoundly as they are very negatively correlated with the USD Index.
Also, after a similar correction in 2000, the USD Index bottomed a bit below its 200-day moving average. And, guess what – the USDX almost moved below the same average recently. Consequently, another rally could indeed be in the cards.
Before summarizing, I would like to add a note about the reasons behind the recent weakness in the USD Index.
In short, it was not about the U.S. dollar’s weakness – it was about the yen’s strength.
So, what is the real implication for gold?
It’s easier to understand the implication based on a counter-example. Remember when all the monetary authorities around the world were getting more and more dovish and they kept printing more and more money? That was bullish for gold, right?
Ok, so, now what we see is the opposite. The monetary authorities around the world are getting more and more hawkish, and the Bank of Japan appears to be finally joining the hawkish party, and that’s bearish for gold.
This remains true despite any short-term price movements caused by individual currency exchange rate changes. So, even if the yen continues to strengthen relative to the dollar for some time, gold might not be willing to react to it for much longer.
Why? Because in the short-term markets are particularly emotional. “OMG, USDX fell, let’s buy gold!” can dominate traders’ way of feeling/thinking (on a side note, “feenking” could be a new verb to describe the situation when one thinks that they are thinking about something, but actually they are just rationalizing their feelings).
Then, as the traders have some time to think about what’s really happening, they could sell gold as it becomes less and less appealing, given that fiat money can (at least for now…) provide more interest payments.
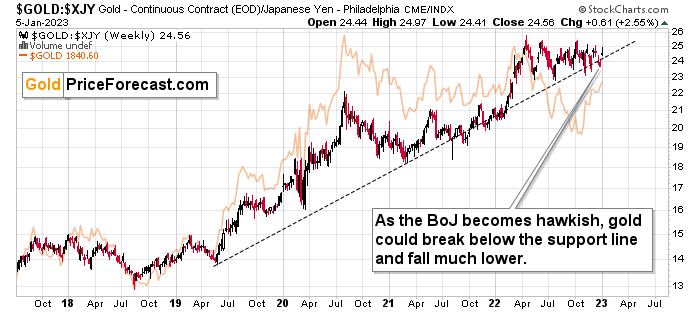
As you can see on the above chart, gold priced in the Japanese yen has been in a rather steady long-term uptrend for years. It’s close to the support line, though.
Based on the hawkish indications from the Bank of Japan, it seems that we might finally see a confirmed breakdown below this line, and when we do, the decline that could follow could be huge.
The buying pressure from the yen holders might have been a major driving force behind the rally in gold that we saw in the last few years. And as the interest rates in Japan increase, gold’s gleam to yen holders is likely to begin to wane.
Overview of the Upcoming Part of the Decline
- It seems to me that the corrective upswing is over (or about to be over) and that the next big move lower is already underway (or that it’s about to start).
- If we see a situation where miners slide in a meaningful and volatile way while silver doesn’t (it just declines moderately), I plan to – once again – switch from short positions in miners to short positions in silver. At this time, it’s too early to say at what price levels this could take place and if we get this kind of opportunity at all – perhaps with gold prices close to $1,500 - $1,550.
- I plan to switch from the short positions in junior mining stocks or silver (whichever I’ll have at that moment) to long positions in junior mining stocks when gold / mining stocks move to their 2020 lows (approximately). While I’m probably not going to write about it at this stage yet, this is when some investors might consider getting back in with their long-term investing capital (or perhaps 1/3 or 1/2 thereof).
- I plan to return to short positions in junior mining stocks after a rebound – and the rebound could take gold from about $1,450 to about $1,550, and it could take the GDXJ from about $20 to about $24. In other words, I’m currently planning to go long when GDXJ is close to $20 (which might take place when gold is close to $1,450), and I’m planning to exit this long position and re-enter the short position once we see a corrective rally to $24 in the GDXJ (which might take place when gold is close to $1,550).
- I plan to exit all remaining short positions once gold shows substantial strength relative to the USD Index while the latter is still rallying. This may be the case with gold prices close to $1,400 and GDXJ close to $15 . This moment (when gold performs very strongly against the rallying USD and miners are strong relative to gold after its substantial decline) is likely to be the best entry point for long-term investments, in my view. This can also happen with gold close to $1,400, but at the moment it’s too early to say with certainty.
- The above is based on the information available today, and it might change in the following days/weeks.
You will find my general overview of the outlook for gold on the chart below:
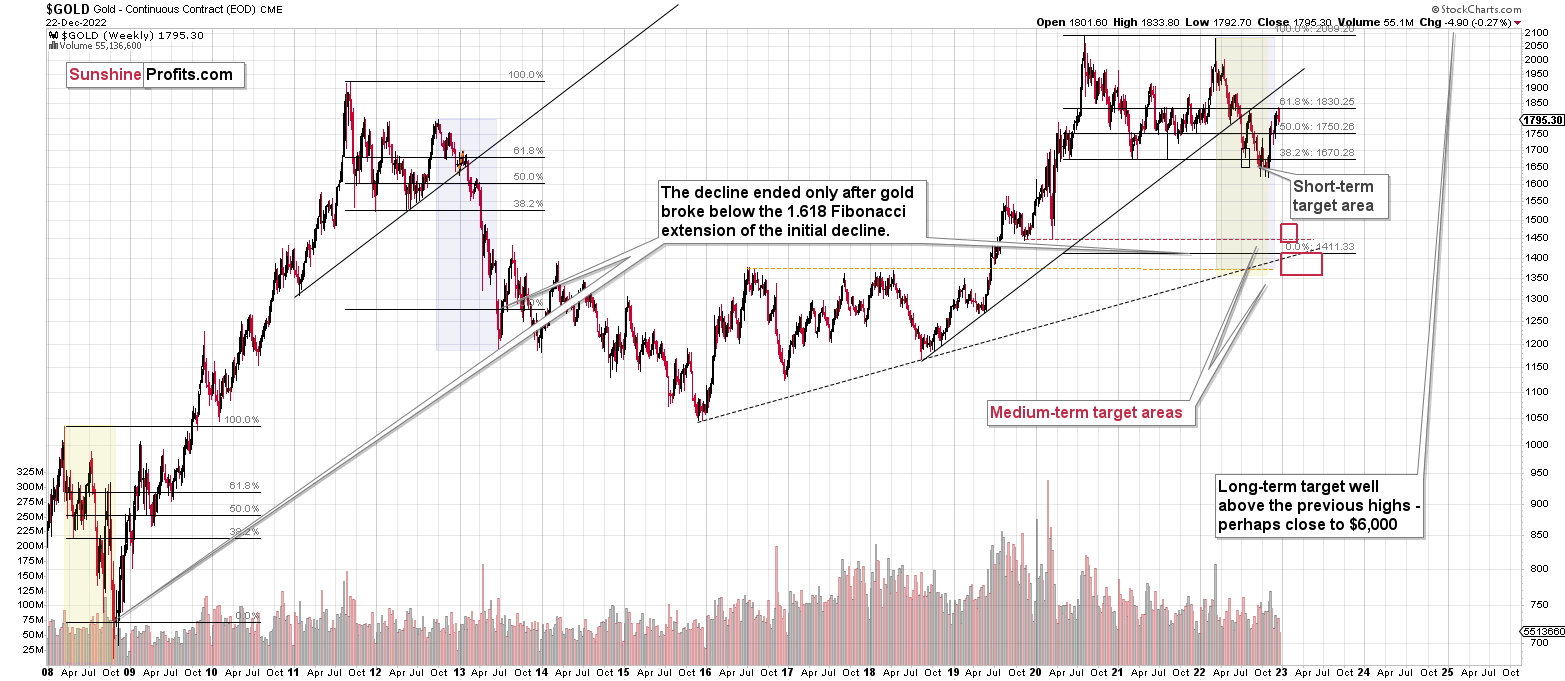
Please note that the above timing details are relatively broad and “for general overview only” – so that you know more or less what I think and how volatile I think the moves are likely to be – on an approximate basis. These time targets are not binding nor clear enough for me to think that they should be used for purchasing options, warrants, or similar instruments.
Letters to the Editor
We received a few messages over e-mail, but as we are moving to our new platform, we will be transferring them below the articles as comments – and that’s where we’ll be replying to them.
Asking your questions below the articles or in the spaces called “Ask the Community” or “Position Sizes” directly will help us deliver a reply sooner. In some cases, someone from the community might reply and help even before we do.
Please remember about the Pillars of our Community, especially about the Kindness of Speech Pillar.
Also, if there’s anything that you’re unhappy with, it’s best to send us a message at [email protected].
Please note that this section is going to go away within the next 1-8 weeks, as you can add comments/questions below the article on Golden Meadow – the platform that we’re using to provide our analyses. Your notification e-mails include an invitation link that allows you to access the “Gold Trading Alerts” space.
Also, if you haven’t had the chance to see the video, in which I’m talking about the new platform and why we essentially moved from Sunshine Profits to Golden Meadow, I strongly encourage you to do so:
Summary
Summing up, it seems that the major bottom in the USD Index is in, while the correction in stocks, gold, silver, and mining stocks is over.
Gold and junior miners corrected half of their 2022 declines (gold a bit more), while silver corrected over 61.8% of the decline. Silver’s move above the 61.8% Fibonacci retracement was just invalidated, just as gold’s move above the 50% Fibonacci retracement was.
Now, as more investors realize that interest rates will have to rise sooner than expected, the prices of precious metals and mining stocks (as well as other stocks) are likely to fall. In my opinion, the current trading position is going to become profitable in the following weeks, and quite possibly in the following days. And while I can’t promise any kind of performance, I fully expect it to become very profitable before it’s over and to prolong our 2022 winning streak.
After the final sell-off (that takes gold to about $1,350-$1,500), I expect the precious metals to rally significantly. The final part of the decline might take as little as 1-5 weeks, so it's important to stay alert to any changes.
As always, we'll keep you – our subscribers – informed.
To summarize:
Short-term outlook for the precious metals sector (our opinion on the next 1-6 weeks): Bearish
Medium-term outlook for the precious metals sector (our opinion for the period between 1.5 and 6 months): Bearish initially, then possibly Bullish
Long-term outlook for the precious metals sector (our opinion for the period between 6 and 24 months from now): Bullish
Very long-term outlook for the precious metals sector (our opinion for the period starting 2 years from now): Bullish
As a reminder, Gold Investment Updates are posted approximately once per week. We are usually posting them on Friday, but we can’t promise that it will be the case each week.
Our preferred ways to invest in and to trade gold along with the reasoning can be found in the how to buy gold section. Additionally, our preferred ETFs and ETNs can be found in our Gold & Silver ETF Ranking.
Moreover, Gold & Silver Trading Alerts are posted before or on each trading day (we usually post them before the opening bell, but we don’t promise doing that each day). If there’s anything urgent, we will send you an additional small alert before posting the main one.
Thank you.
Przemyslaw K. Radomski, CFA
Founder, Editor-in-chief

