

Briefly: gold and the rest of the precious metals market are likely to decline in the next several weeks/months and then start another powerful rally. Gold’s strong bullish reversal/rally despite the USD Index’s continuous strength will likely be the signal confirming that the bottom is in.
Welcome to this week's Gold Investment Update. Predicated on last week’s price moves,
our most recently featured outlook remains the same as the price moves align with our
expectations. On that account, there are parts of the previous analysis that didn’t change at all
in the earlier days, which will be written in italics.
The key thing is that while the medium-term outlook remains profoundly bearish, the short-term outlook changed from bearish to bullish – and no, yesterday’s move lower in the precious metals sector doesn’t change that.
Let’s start today’s analysis with a recap of what recently happened on the fundamental front.
The Weekly Fundamental Roundup
With the Consumer Price Index (CPI) outperforming expectations and the Bank of Canada (BoC) shocking investors with a 100 basis point rate hike, this week was all about central banks confronting the elephant in the room.
Moreover, while I’ve warned for many months that inflation would be higher and much longer-lasting than the consensus expected, the Fed and the BoC are now forced to play catch-up. Therefore, the medium-term outlooks for the PMs and the S&P 500 are profoundly bearish.
However, with the technicals signaling a short-term upswing for the GDXJ ETF, a fundamental catalyst could also provide assistance. For example, the U.S. Census Bureau releases its U.S. retail sales report at 8:30 a.m. ET today. Moreover, with Bank of America forecasting a weak print, a realization could pare back some rate hike expectations, hurt the USD Index and uplift the GDXJ ETF.
Please see below:
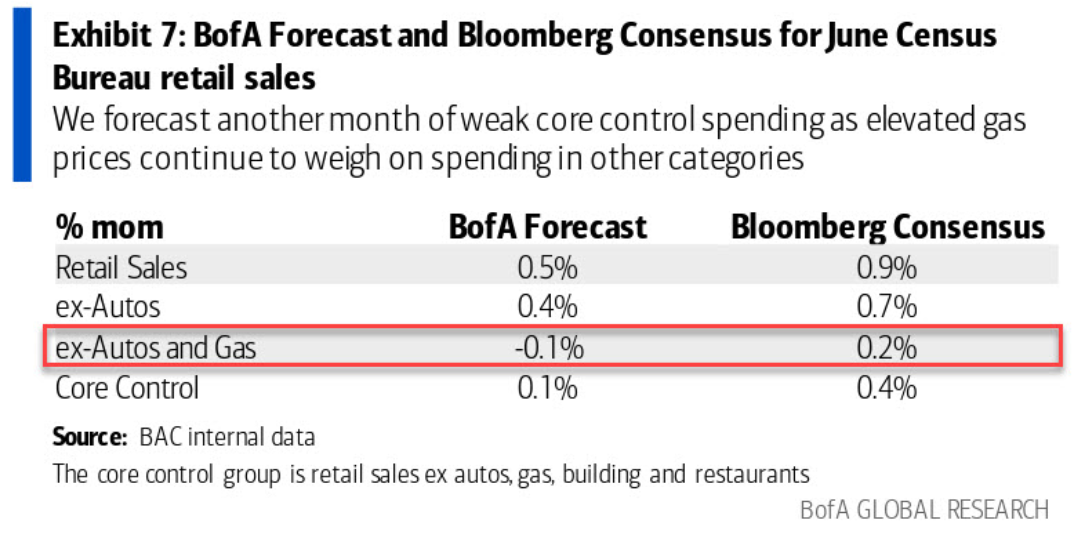
To explain, economists polled by Bloomberg expect a 0.2% month-over-month (MoM) increase in U.S. retail sales (excluding autos and gas) today. However, Bank of America’s credit and debit card data has its strategists forecasting a 0.1% MoM decline. Therefore, liquidity beneficiaries like the GDXJ ETF should catch a bid if the latter proves prescient.
To that point, while the BoC’s hawkish surprise fueled speculation that the Fed will drop a 100 basis point hammer later this month, Fed Governor Christopher Waller was less enthusiastic. He said on Jul. 14:
“With the CPI data in hand, I support another 75 basis point increase (…). Don’t say because you are not doing a 100 you are not doing your job. You don’t want to really overdo the rate hikes.”
For context, the difference between 75 or 100 basis points is the perfect example of sentiment versus fundamentals. In reality, the 25 basis point difference is immaterial, and neither will be enough to curb inflation. However, since we’re concerned about the GDXJ ETF’s short-term price action and sentiment plays an important role, Waller’s pushback offers an olive branch to the bulls. He added:
“My base case for July depends on incoming data. We have important data releases on retail sales and housing coming in before the July meeting. If that data comes in materially stronger than expected, it would make me lean towards a larger hike at the July meeting to the extent it shows demand is not slowing down fast enough to get inflation down.”
Therefore, with the U.S. retail sales print in the Fed’s crosshairs, an accurate prediction by Bank of America could slow the Fed’s roll and provide fundamental fuel for the GDXJ ETF.
Missing the Mark
While I noted that sentiment (short term) and fundamentals (medium term) play different roles in an investment thesis, Waller’s willingness to rely on relatively immaterial data releases highlights why the FOMC is in this inflationary mess to begin with. Yes, officials’ rhetoric and beliefs move markets, and that’s why a weak U.S. retail sales report would be perceived as dovish, and therefore, bullish for the GDXJ ETF.
However, Fed officials are still missing the medium-term mark. For example, St. Louis Fed President James Bullard (who has been notoriously hawkish) shared Waller’s sentiment on Jul. 14. He said:
“So far, we’ve framed this mostly as 50 versus 75 at this meeting. I think 75 has a lot of virtue to it. As of today, I would advocate 75 basis points again at the next meeting.”
Thus, while 75 basis points passes for dovish news these days, the reality is that inflation is still running away from the Fed.
Please see below:
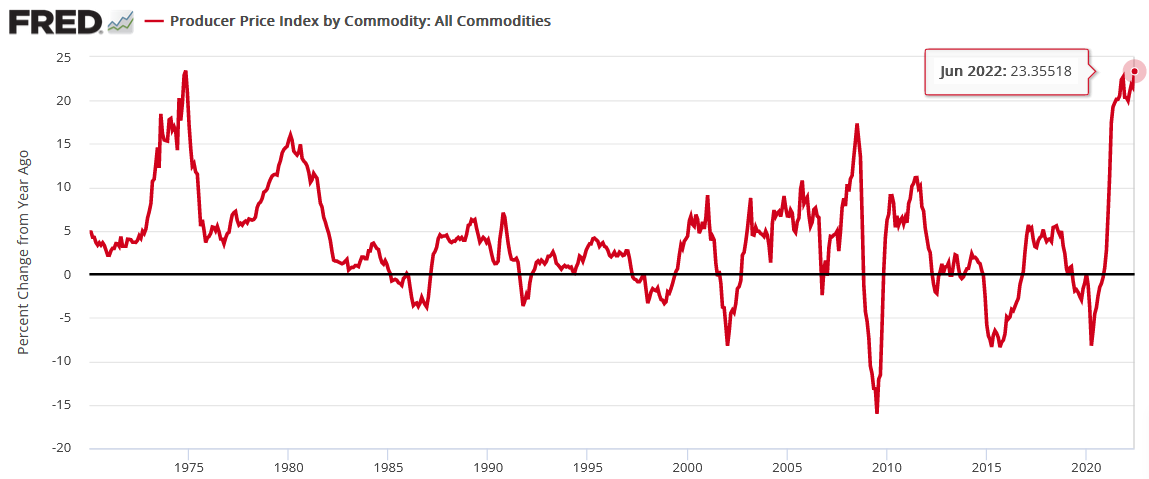
To explain, the Commodity Producer Price Index (PPI) was released on Jul. 14, and the red line above tracks the year-over-year (YoY) percentage change. If you analyze the right side of the chart, you can see that the metric hit a new 2022 high of 23.4% YoY. Moreover, this is the highest reading since 1974.
However, market participants will note that commodity prices have declined substantially over the last ~45 days, which is true. But the S&P Goldman Sachs Commodity Index (S&P GSCI) declined by 9.82% MoM in June and by 8.62% so far this month, and the commodity PPI remained uplifted.
For context, the S&P GSCI contains 24 commodities from all sectors: six energy products, five industrial metals, eight agricultural products, three livestock products and two precious metals. However, energy accounts for roughly 54% of the index's movement.
Thus, while a delayed filter-through of lower commodity prices should reduce next month's commodity PPI, a reduction to pre-COVID-19 levels is unlikely without a material recession. Think about it: the S&P GSCI collapsed in June when the Fed upped the hawkish ante and promised several rate hikes of 50+ basis points.
Furthermore, copper paints the perfect portrait. The metal is known as a bellwether of economic growth, and with the Fed on a hawkish warpath to kill demand, copper has suffered mightily over the last ~45 days.
Please see below:
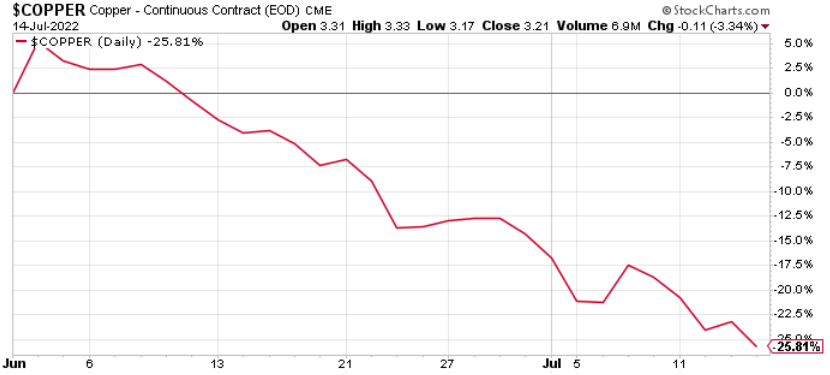
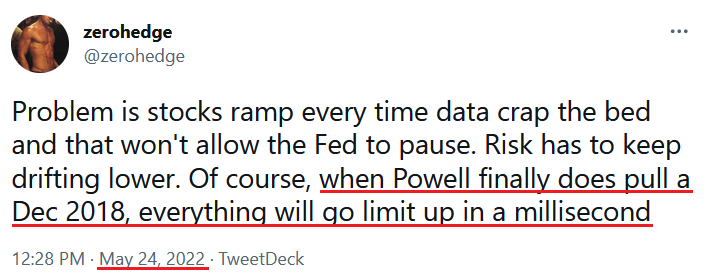
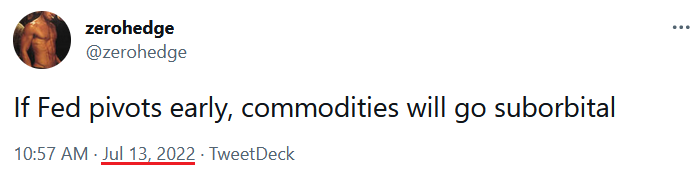
Therefore, if the Fed reverses its hawkish stance, commodities will surge once again and any inflation progress will evaporate. To that point, while the hyper-inflationist commodity bulls are licking their wounds after heavy losses, they’re still steadfast that the Fed will pivot and inflation will go parabolic. To explain, I wrote on May 25:
With inflation rivaling the 1970s, still increasing MoM and U.S consumers still eager to spend, a third category of investors enters the equation: the hyper-inflationists. For context, they resemble permabears, but the idea is that the Fed can't stomach a recession, so officials will let inflation rage.
Please see below:
And:
As such, while Waller, Bullard, and the majority of investors cite the recent decline in commodity prices as a sign that inflation is moderating and, therefore, the Fed can pause, the harsh reality is that rate hikes and recession fears are the only fundamental reasons that commodity prices have fallen. As a result, what do you think will happen if the Fed becomes less aggressive?
Thus, inflation is nowhere near subsiding, and any weakness by the Fed will only embolden the commodity bulls and worsen an already bad situation. A case in point: the Atlanta Fed updated its Wage Growth Tracker on Jul. 14. And surprise, surprise, wage inflation hit a new all-time high in June.
Please see below:
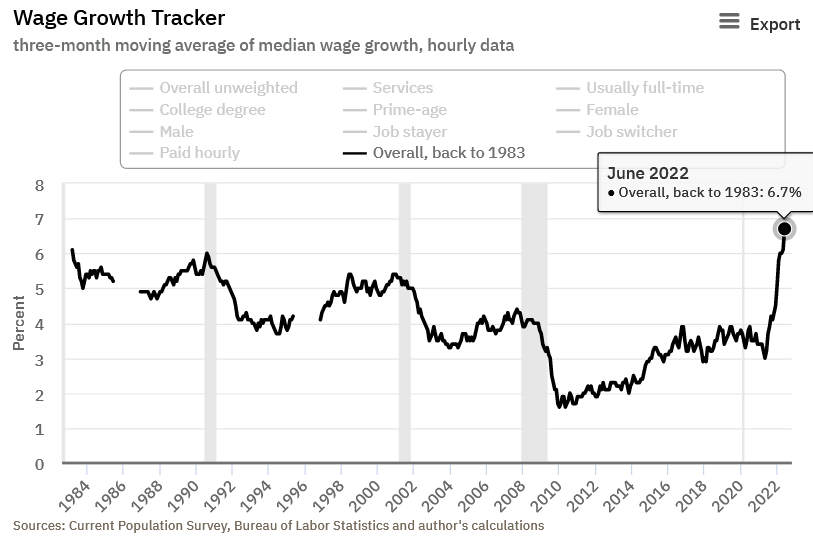
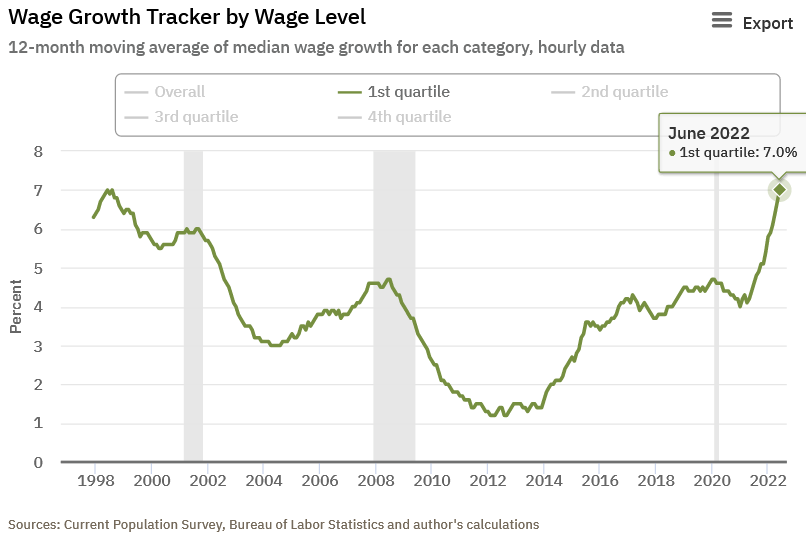
Likewise, the lowest-earning Americans saw their wages increase by 7%.
Please see below:
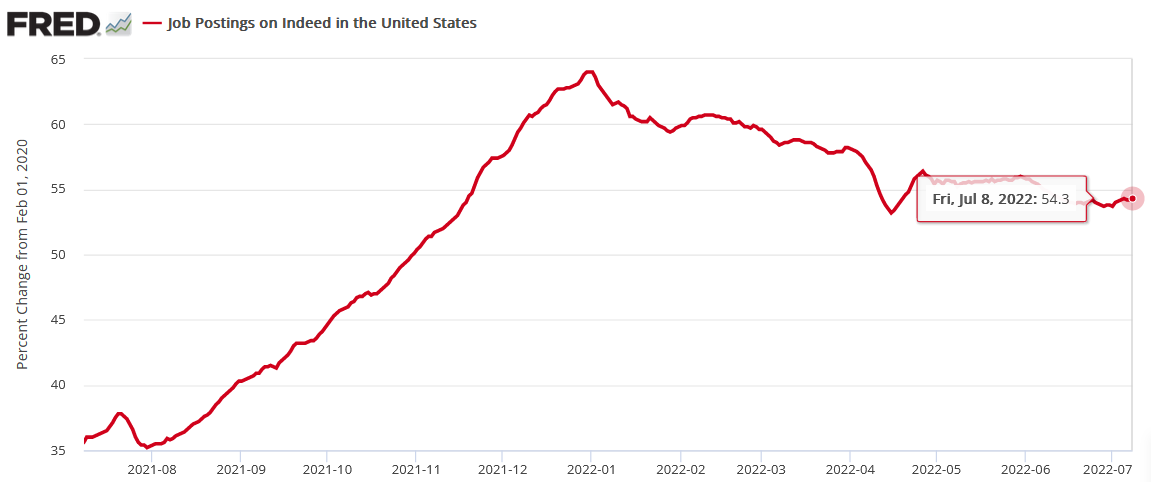
In addition, while investors continue to Goal Seek reasons why the U.S. labor market will fall off a cliff, the data suggests otherwise. For example, Indeed updated its job postings on Jul. 12. Moreover, while the figure has come down from its January high, it’s held steady recently (54.3% above its pre-COVID-19 high) and is nowhere near a collapse.
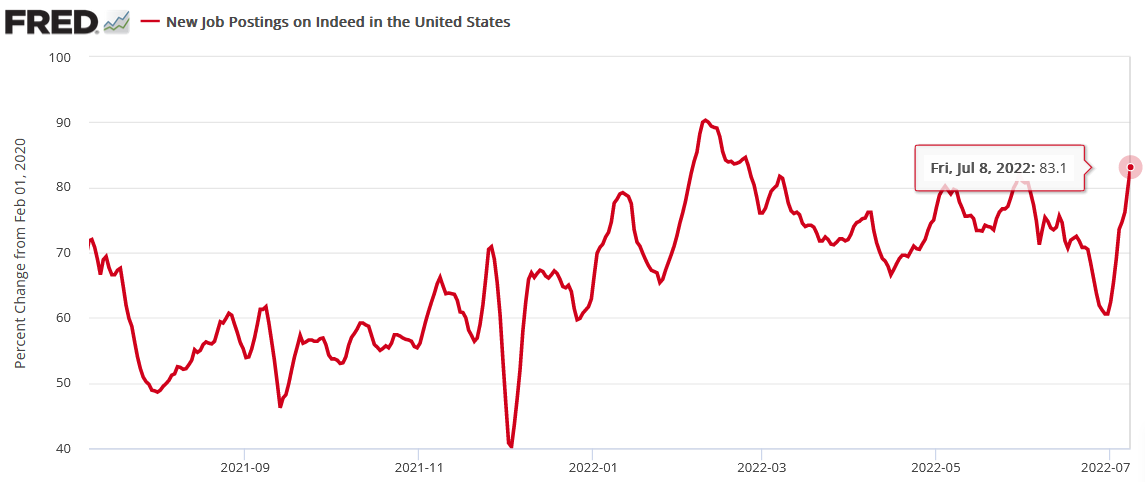
Furthermore, new job postings on Indeed increased materially for the week ended Jul. 8.
Finally, Paychex – an American provider of human resource, payroll, and benefits outsourcing services for small-to-medium-sized businesses – released its fourth-quarter earnings on Jun. 29. CEO Marty Mucci said during the Q4 earnings call:
“The latest Paychex IHS Small Business Employment Watch reflected a 12th consecutive month of increasing hourly earnings gains, though we did notice a slowing a bit of the pace of job growth in May. However, this is more reflective of being near full employment and the difficulty of finding employees. Job growth at U.S. small businesses remained strong in the face of a tight labor market and inflation pressures.”
As a result, if Fed officials and investors assume the wage-price spiral will vanish without the central bank materially raising interest rates and inducing a recession, they’re likely in for a major surprise.
 Source: Paychex/The Motley Fool
The Bottom Line
Since the GDXJ ETF showcases technical strength and should benefit from Fed officials toning down their hawkish rhetoric, a weak U.S. retail sales print could help spur the next upswing. Therefore, we expect the junior miners to outperform to the upside over the coming days/weeks.
However, with Fed officials and investors still underestimating inflation’s fervor, the recent drawdown in commodities should prove short-lived if the central bank backs off its hawkish stance. Moreover, I’ve noted on numerous occasions that a hyper-inflationary collapse is much worse than a rate-hike-induced recession. Therefore, since Fed Chairman Jerome Powell stated he already knows this, he’s unlikely to repeat the monumental mistakes of the 1970s.
In conclusion, the PMs declined on Jul. 14, as weakness across European stocks hurt sentiment. However, with a bottom likely near, the GDXJ ETF should seek higher ground in the coming days. As a result, while the medium-term outlook is profoundly bearish, the near term should be more sanguine.
What to Watch for Next Week
With more U.S. economic data releases next week, the most important are as follows:
- Jul. 21: Philadelphia Fed Manufacturing Index
The Philadelphia Fed’s survey is a leading indicator of inflation and employment activity in Pennsylvania.
- Jul. 22: S&P Global U.S. Composite PMI
The PMI data from S&P Global is arguably more important than any other economic release. It's a nationwide survey that details output, inflation, and employment across the U.S. Therefore, the results often lead the government's future data.
All in all, economic data releases impact the PMs because they impact monetary policy. Moreover, if we continue to see higher employment and inflation, the Fed should keep its foot on the hawkish accelerator. If that occurs, the outcome is profoundly bearish for the PMs in the medium term.
Technically Speaking
Let’s start today’s technical discussion with a quick check on copper prices.
Practically, everything that I wrote about it last week (and in the previous weeks/months) remains up-to-date:
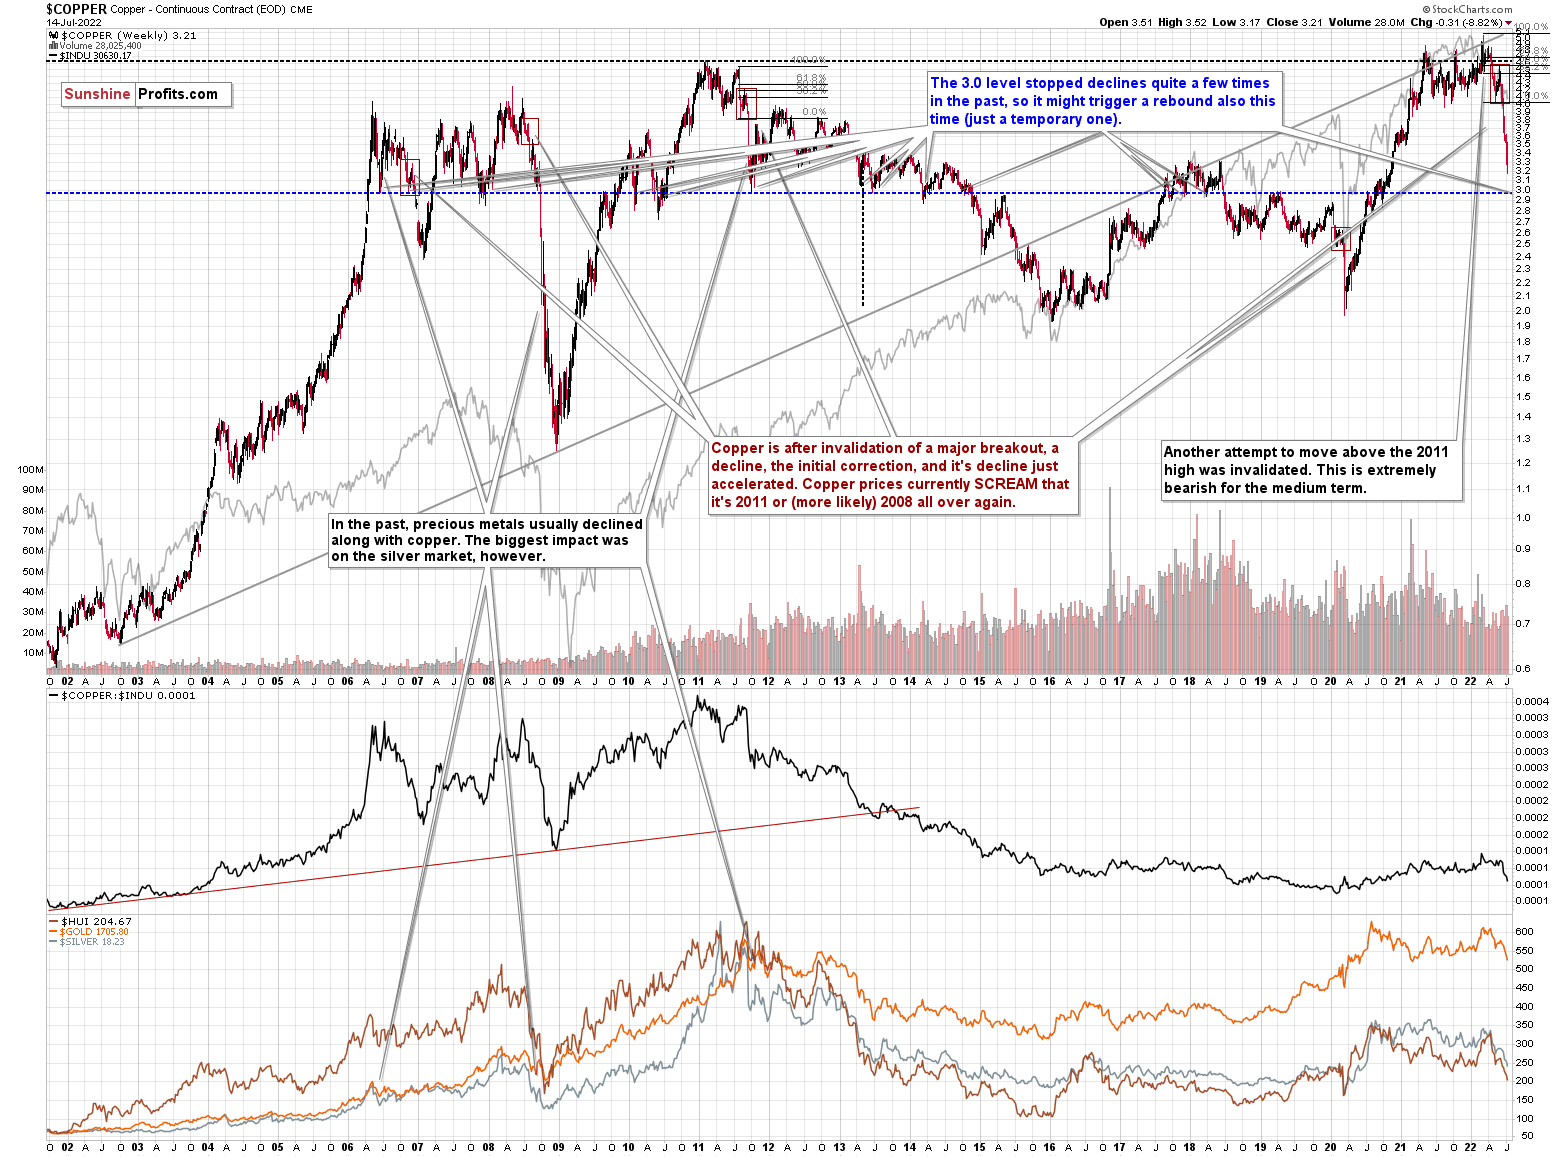
Copper recently CLEARLY invalidated another attempt to move above its 2011 high. This is a very strong technical sign that copper (one of the most popular commodities) is heading lower in the medium term.
The interest rates are going up, just like they did before the 2008 slide. What did copper do before the 2008 slide? It failed to break above the previous (2006) high, and it was the failure of the second attempt to break higher that triggered the powerful decline. What happened then? Gold declined, but silver and mining stocks truly plunged.
Again, copper is after invalidation of a major breakout, a decline, the initial correction, and its decline just accelerated. Copper prices currently SCREAM that it’s 2011 or (more likely) 2008 all over again. This is extremely bearish for mining stocks (especially juniors) and silver.
Still, as you know, no market moves up or down without corrections, and copper is no exception. The 3.0 level (and its proximity) stopped declines and triggered corrections or rallies multiple times in the past, and given how oversold (on a short-term basis) the copper market is already, it’s likely that we’ll see something similar this time.
So, while copper might have already formed a short-term bottom, it seems that it’s likely to decline even more before correcting in a more visible manner (and then declining much more). The medium-term implications remain bearish. However, the above confirms the theory that a short-term, corrective upswing might be just around the corner.
Consequently, what we saw recently is just a confirmation of the bearish analogy.
Having said that, let’s check junior miners’ really big picture.
I previously commented on the above chart in the following way:
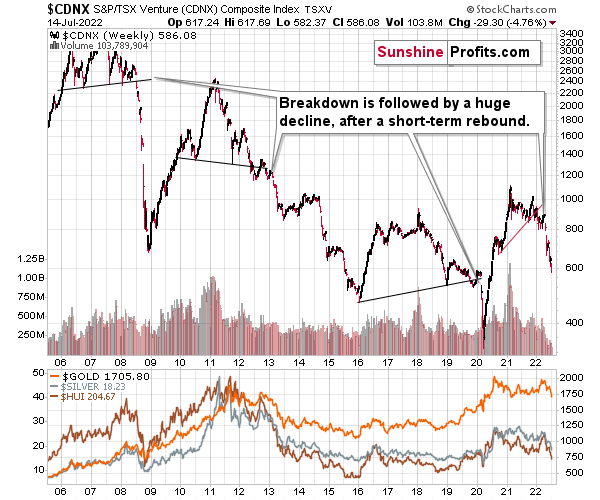
The Toronto Stock Exchange Venture Index includes multiple junior mining stocks. It also includes other companies, but juniors are a large part of it, and they truly plunged in 2008.
In fact, they plunged in a major way after breaking below their medium-term support lines and after an initial corrective upswing. Guess what – this index is after a major medium-term breakdown and a short-term corrective upswing. It’s likely ready to fall – and to fall hard.
So, what’s likely to happen? We’re about to see a huge slide, even if we don’t see it within the next few days.
The index corrected just like the PMs, but it didn’t change anything with regard to the medium term.
What has happened recently?
In yesterday’s analysis, I commented on the above chart in the following way:
We also see something similar in gold’s pre-market trading, and the implications are just as bullish. Gold futures are down by about $20, but they are well above yesterday’s intraday low of $1,704.50.
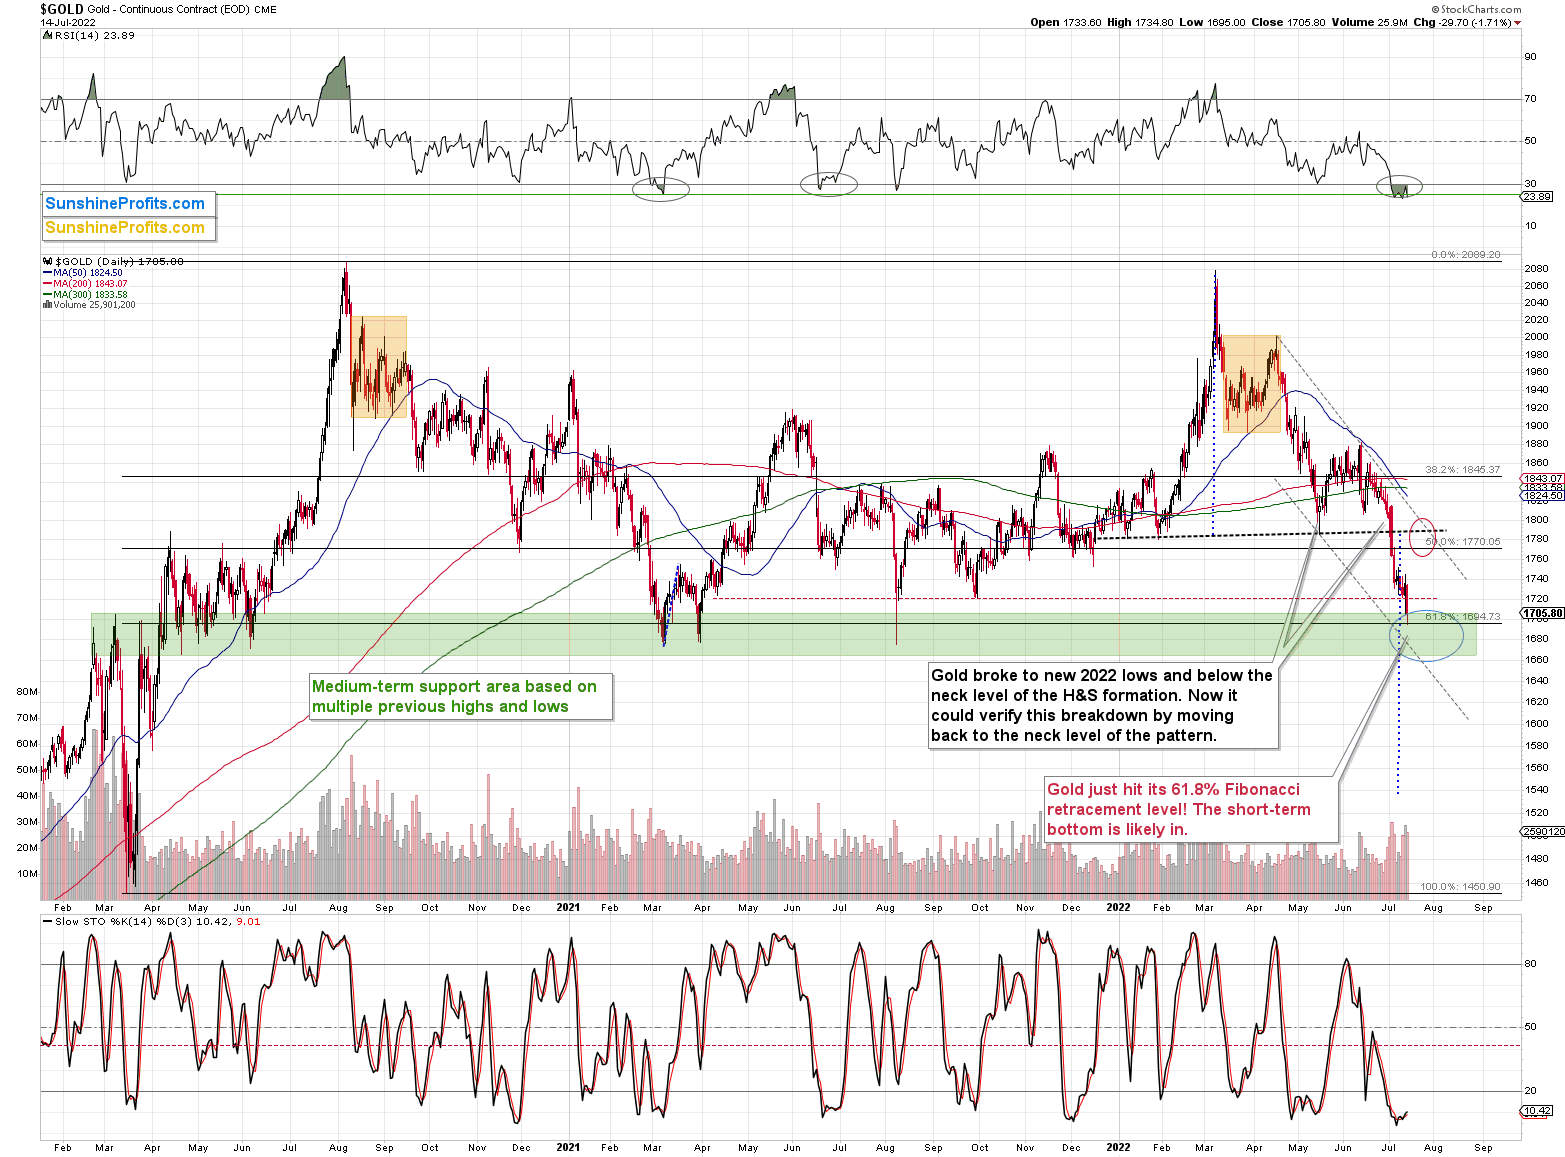
On the above gold chart, you can see that gold just touched the upper border of my original target area for this short-term decline, and then moved back up, closing above the red dashed line. This way, both targets were reached, and we saw a big-volume reversal that confirmed that the short-term trend has just most likely changed.
How high is gold likely to rally from here?
To about $1,770-1,800. That’s where we have several resistance levels, including the neck level of the previously broken head-and-shoulders pattern. The silver price is likely to rally too – in the near term, that is.
Additionally, please note the situation in the RSI in the upper part of the chart. What we saw recently is very similar to what we saw in March 2021, only this time the RSI indicated slightly more oversold conditions.
How high did gold rally back then? Well, it bottomed and kept on rallying for months, but it doesn’t mean that exactly the same thing is likely to happen now. You see, the further price moves from the “signal”, the less likely the price performance is likely to be repeated. So, while the initial several days are quite likely to be similar, the following few weeks might also be similar, but it’s a rather weak indication. The following months might develop completely differently.
Let’s focus on the short-term indications that are most likely to be meaningful.
After bottoming in March 2021, gold moved up rather quickly, and it stopped only after it moved close to the previous lows that provided resistance. That’s exactly what I expect to see this time too. Gold could move visibly higher in the near term, topping close to its resistance levels or between them.
After I wrote the above, gold continued to decline, and it reversed only after moving slightly below $1,700.
In fact, it reversed practically right at its 61.8% Fibonacci retracement based on the entire 2020 rally and within my original target area for this decline.
How does that change what I wrote yesterday and the short-term upside target area?
It doesn’t!
It perfectly confirms it. The upside target area remains intact.
The RSI continues to support a short-term rally, and the powerful support that was just reached (the 61.8% retracement) makes it much more likely.
I was a bit early to take profits from the previous short position and to enter a long one, but please keep in mind that I made the decision to take profits and then to enter a new long position based on the risk-to-reward ratio. While we now know that gold moved lower and did indeed hit its 61.8% retracement, it was far from certain that this would happen just a few days ago, especially given what we saw in the USD Index at that time.
The bullishness of the above chart increased because of the profound support from the retracement that already worked three times (twice in March 2021 and once in August 2021) and because of the epic development that we saw in the EUR/USD currency pair (clear reversal that also served as an invalidation of the attempt to break below the 1 level).
Before looking at mining stocks, let’s take a look at gold from a broader point of view.
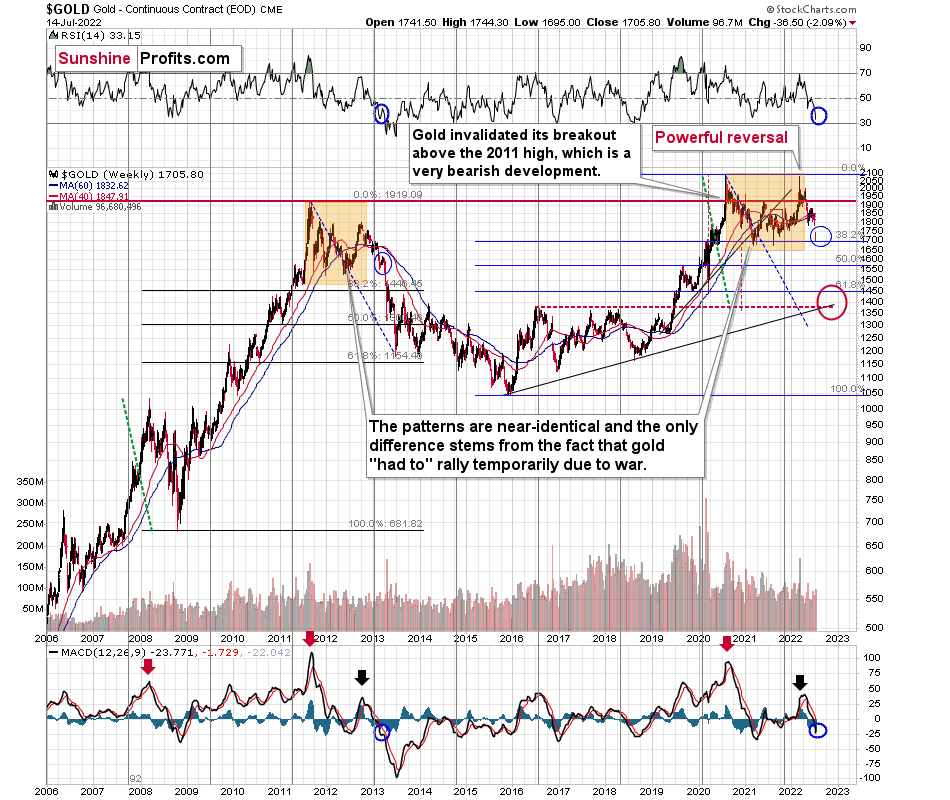
Let’s keep in mind that between 2020 and now, quite a lot happened, quite a lot of money was printed, and we saw a war breaking out in Europe. Yet, gold failed to rally to new highs.
In fact, it’s trading very close to its 2011 high, which tells you something about the strength of this market. It’s almost absent.
Truth be told, what we see in gold is quite in tune with what we saw after the 2011 top, and in particular, shortly after the 2012 top. The long-term gold price chart below provides details.
Please note that the 38.2% Fibonacci retracement based on the entire 2015-2020 rally is very close to $1,700, which makes the above-mentioned support area even stronger.
It seems that if it weren’t for the war in Europe, gold wouldn’t have been able to move above $2,000 and instead it would have topped close to its previous highs, which provided strong resistance.
The extraordinary thing about that is that that’s exactly what happened in 2012. Gold moved higher but only until it reached its previous highs, which happened in the second half of 2012.
This time the RSI was a bit higher, but it was close to 70, just like in 2012.
Yes, this time gold moved back to the previous high, but:
- This happened as a result of a geopolitical event (the war in Europe) and geopolitically-driven rallies are generally unsustainable;
- When gold reached its previous highs, it also formed a profound weekly reversal, which formed on huge volume, and that’s very bearish.
So, the current medium-term outlook for gold is very bearish.
There are also very interesting short-term takeaways from the above chart.
If the 2012-2013 is currently being replayed (at least to a significant extent), then let’s not forget that this decline initially took the shape of a back-and-forth decline with lower lows and lower highs (but there were notable short-term rallies within the decline).
The final of the corrections that still took place within the back-and-forth decline started in early 2013 - when gold moved close to its previous medium-term lows, when RSI was a bit above 30, and when the MACD was close to -20, which was also slightly below its previous medium-term low.
We can see all three above-mentioned similarities on the above chart. I marked them with blue ellipses. They are not “somewhat similar” – they are remarkably similar in both cases!
What does it imply going forward? It simply confirms the indications from the short-term chart. That is, we’re about to see a corrective upswing, which will almost certainly be followed by a massive plunge in gold prices.
Silver and mining stocks are likely to be affected even more than gold, though.
Let’s take a look at the silver market.
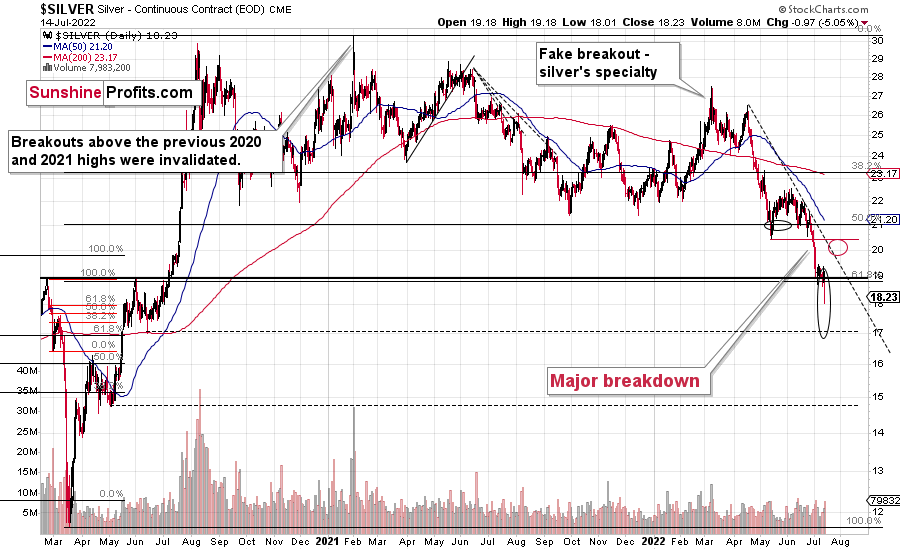
Silver once again moved to new lows this week. However, given what we saw in the gold (and EUR/USD) market, it seems that silver will reverse shortly as well.
Please keep in mind that silver is known for fake moves with regard to its support and resistance levels (I marked one on the above chart – in early 2022), and yesterday’s breakdown below the support provided by the 61.8% Fibonacci retracement based on the 2020-2021 rally and the 2020 highs could also be a fake move.
How high would silver be likely to move? Probably to its previous lows, or slightly below or above them. The move back above them could also be small, fake breakout – also with regard to the declining dashed resistance line.
As you see, the silver outlook is not as precise as it is for gold, as the support levels and targets based on multiple techniques don’t necessarily align. In the case of gold, they do.
Fortunately, it’s very likely that the short-term correction in gold, silver, and miners will start at more or less the same time – which probably means that it’s going to start either right away or soon.
Let’s not forget that gold is not the only precious metal that is repeating its 2012 performance right now, and you can see more details on silver’s long-term chart.
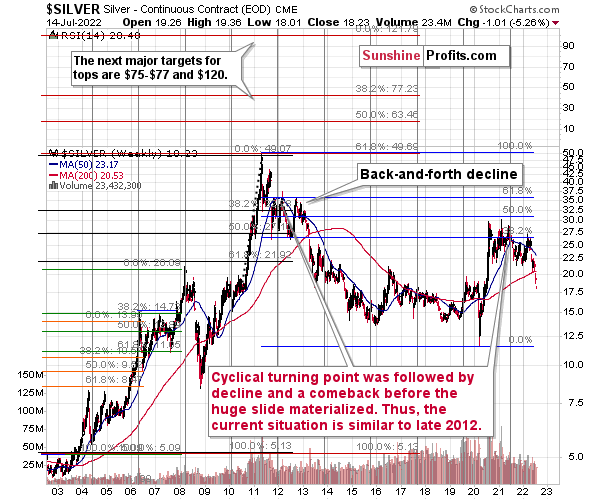
As you can see on the above chart, silver corrected about 50% of the previous downswing, and this correction ended at about $30, a long time ago. Ever since, silver has been declining, and even the outbreak of war in Europe didn’t make silver rally above that level.
On the above chart, you can see how silver first topped in 2011, then declined and formed another top at the cyclical turning point. Next, it declined once again – to the previous lows. After that, silver rallied (in 2012 and 2022), and it topped between its 50-week moving average (marked in blue) and the previous top. Now silver is declining in a back-and-forth manner (you can see it more clearly on the previous short-term silver chart).
Back in 2012, these were just the early days of a gargantuan decline, and the same appears likely to be the case this time. Interest rates are going up after all, and the Fed is determined to quench inflation.
Let’s not forget that rising interest rates are likely to negatively impact not just commodities, but practically all industries. This will likely cause silver’s price to decline profoundly, as silver’s industrial demand could be negatively impacted by lower economic growth (or a decline in economic activity).
Besides, please note that silver didn’t even manage to rally as much as copper (which tried to move to new highs recently) or most other commodities, thus being rather weak.
Consequently, it seems that silver will need to decline profoundly before it rallies (to new all-time highs) once again.
Having said that, let’s take a look at what happened in mining stocks.
History tends to repeat itself. Not to the letter, but in general. The reason is that while economic circumstances change and technology advances, the decisions to buy and sell are still mostly based on two key emotions: fear and greed. They don’t change, and once similar things happen, people’s emotions emerge in similar ways, thus making specific historical events repeat themselves to a certain extent.
For example, right now, gold stocks are declining similarly to how they did in 2008 and in 2012-2013.
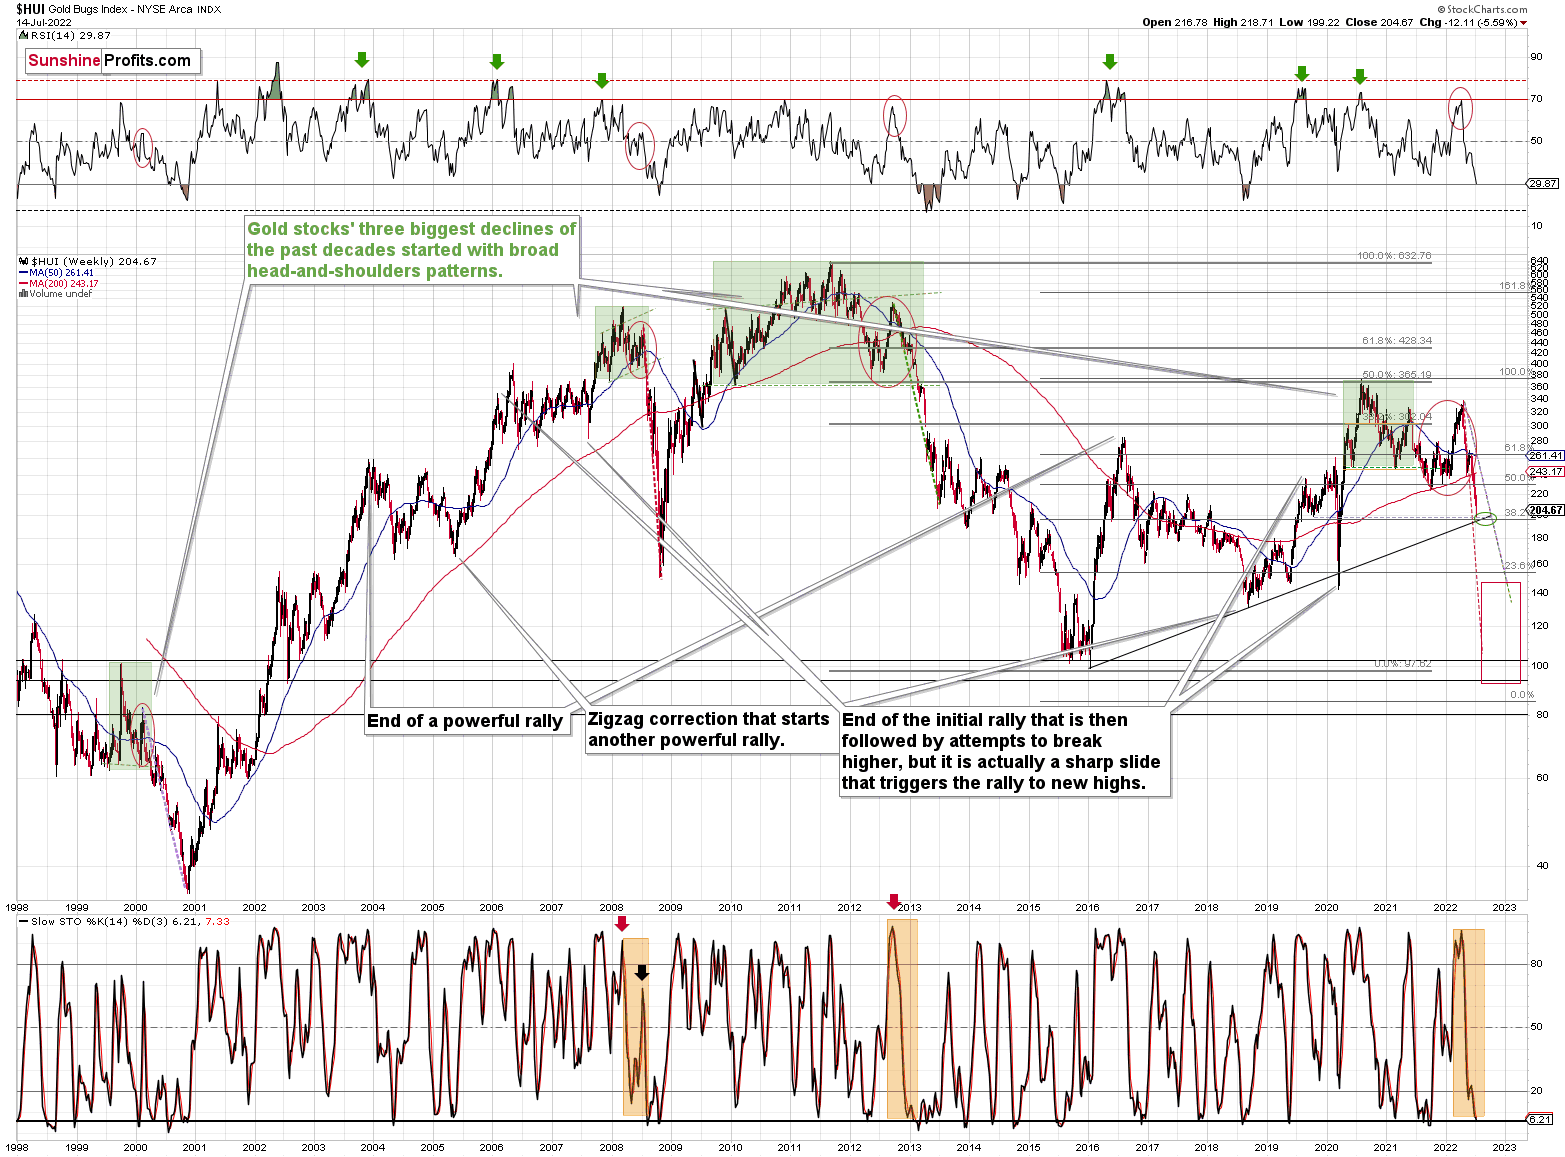
The Russian invasion triggered a rally, which was already more than erased, and if it wasn’t for it, the self-similarity would be very clear (note the head-and-shoulders patterns marked with green). Since the latter happened, it’s not as clear, but it seems that it’s still present. At least that’s what the pace of the current decline suggests.
I used a red dashed line to represent the 2008 decline, and I copied it to the current situation. They are very similar. We even saw a corrective upswing from more or less the 200-week moving average (red line), just like what happened in 2008.
We saw a breakdown to new short-term lows, which means that the volatile part of the slide is likely already underway.
Moreover, last week, I commented on the above chart in the following way:
On a short-term basis, we see a short-term (only) downside target of around 200. That’s about 10% below yesterday’s (Thursday’s) closing price. There are several reasons for it:
- It’s a round number, and those tend to be more important psychologically than other numbers.
- That’s where we have the rising medium-term support line based on the 2016 and 2018 lows. The temporary move below this line triggered a massive rally in 2020.
- That’s where we have the 61.8% Fibonacci retracement level based on the entire 2016-2020 rally.
The 200 target was just reached yesterday. In fact, what happened was even more bullish than that – we saw a tiny move below this level – to 199.22, and then a comeback and a close visibly above 200 – at 204.67.
Ultimately, the HUI Index moved lower yesterday, and many will view this simple fact as something bearish. However, doing that would be a “rookie mistake” – after all, major bottoms can only form after declines, right? My point is that a move higher or lower is not bullish or bearish by itself. It’s the context that adds meaning to a certain price move. In this case, a major support level was reached while the HUI Index was already heavily oversold.
In fact, based on the RSI, the gold stocks are even more oversold than they were at their 2020 bottom!
Consequently, a rebound here is a likely short-term outcome.
All right, let’s zoom in and see how mining stocks declined in 2008.

Back then, the GDXJ ETF was not yet trading, so I’m using the GDX ETF as a short-term proxy here.
The decline took about 3 months, and it erased about 70% of the miners’ value. The biggest part of the decline happened in the final month, though.
However, the really interesting thing about that decline – that might also be very useful this time – is that there were five very short-term declines that took the GDX about 30% lower.
I marked those declines with red rectangles. After that, a corrective upswing started. During those corrective upswings, the GDX rallied by 14.8-41.6%. The biggest corrective upswing (where GDX rallied by 41.6%) was triggered by a huge rally in gold, and since I don’t expect to see anything similar this year, it could be the case that this correction size is an outlier. Not paying attention to the outlier, we get corrections of between 14.8% and 25.1%.
The interesting thing was that each corrective upswing was shorter (faster) than the preceding one.
The first one took 12 trading days. The second one took seven trading days. The third one took 2 trading days, and the fourth and final one took just 1 trading day.
Fast forward to the current situation. Let’s take a look at the GDXJ ETF.

The GDXJ ETF declined by 32.4% and then corrected – it rallied by about 20.3%. The corrective upswing took 14 trading days.
Now, it has declined by about 31.5%.
The above is in perfect tune with the previous patterns seen in the GDX during the 2008 slide.
I previously wrote the following:
What does it tell us? It indicates that history can be rhymed, and while it will not be identical, we should pay attention to the indicators that worked in 2008. The next corrective upswing (a notable one, that is) might start when the GDXJ ETF declines by about 29-35% from its recent top. To clarify, I don’t claim that the above technique would be able to detect all corrective upswings, or that I aim to trade all of them. For instance, in my view, it was a good idea to enter a long position on May 12 and switch to a short position on May 26, but I wasn’t aiming to catch the intraday moves.
Again, yesterday’s bottom formed about 31.5% below the recent high, which perfectly fits my previous estimate and the analogy to 2008.
Based on how long the corrective upswings took in 2008 and how long the recent one took, the upcoming corrective upswing is likely to take between 5 and 10 trading days. If the bottom formed yesterday, which seems likely as the GDXJ ETF is already up by over 1% in today’s London trading, then we can expect the next local top to form within 1-2 weeks. In other words, it seems that the corrective upswing is likely to end in the next part of July – probably in its final week.
Back in 2008, the counter-trend rallies varied greatly in their magnitude, but please keep in mind that back then, the decline was very much news-based – Lehman Brothers’ collapse, etc. This time, the decline is more measured, so declines and corrections are more measured as well.
While back in 2008, during the first correction, the GDX gained only 14.8% and during the second one it gained a sizable 41.6%, this time the first rally provided a measured 20.3% increase. If the upcoming correction is also measured, then the GDXJ might also rally by about 20%.
If yesterday’s intraday low was indeed the final bottom, then the starting price would be $28.88 and a price 20% higher is ~$34.66, which fits my target area for the upcoming correction.
Naturally, the above is up-to-date only at the moment of writing these words (Friday, July 15th), but I’ll keep my subscribers informed with regard to any changes.
Also, let’s not forget about the forest while looking at individual trees. By that, I mean looking at how gold stocks perform relative to gold. That’s one of the major indications that the current situation is just like what we saw at the 2012 top.
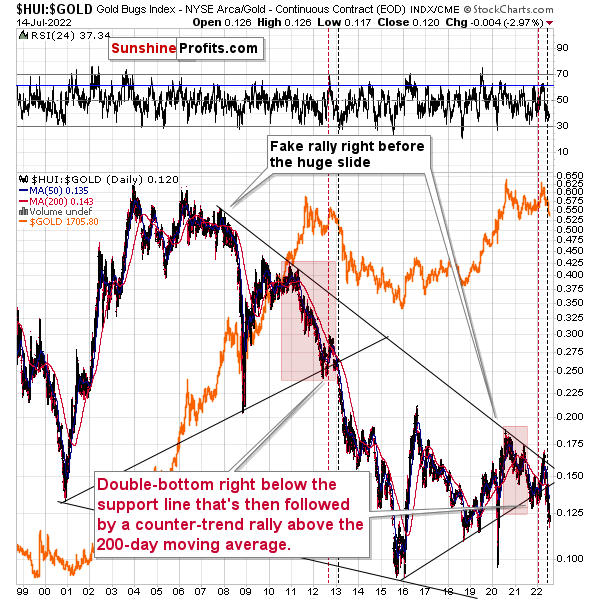
The situation in the gold stock to gold ratio is similar to what we saw in late 2012 and early 2013. The HUI to gold ratio invalidated its first attempt to break lower (marked with red, dashed lines), but after a corrective upswing, it then broke lower more decisively. That’s what I marked using black, dashed lines.
If history is to rhyme, we’re about to see a profound decline. In fact, we’re likely already seeing its beginning.
Also, please note that the pattern that we currently see, which started in early 2016, is somewhat similar to what happened between 2003 and 2008.
Back in 2008, the breakdown from the consolidation resulted in sharply lower ratio values and much lower prices of gold stocks.
So, if the situation is analogous to 2012-2013, we’re likely to see a big decline in the following weeks/months, and if it’s analogous to 2008, we’re likely to see an enormous decline in the following weeks/months.
Declining stock prices would only add fuel to the bearish fire (after all, gold stocks are… just stocks) and that’s exactly what’s likely to happen.
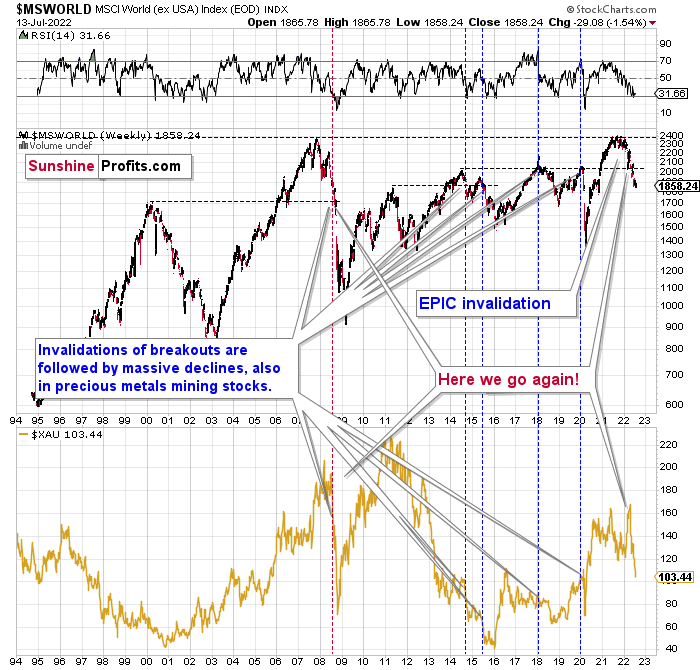
The technical picture in the case of world stocks remains extremely bearish, and my previous comments on it were just confirmed. Here’s what I’ve been writing about the above chart for quite a few weeks now:
World stocks have already begun their decline, and based on the analogy to the previous invalidations, the decline is not likely to be small. In fact, it’s likely to be huge.
For context, I explained the ominous implications on Nov. 30. I wrote:
Something truly epic is happening in this chart. Namely, world stocks tried to soar above their 2007 high, they managed to do so, and… failed to hold the ground. Despite a few attempts, the breakout was invalidated. Given that there were a few attempts and that the previous high was the all-time high (so it doesn’t get more important than that), the invalidation is a truly critical development.
It's a strong sell signal for the medium - and quite possibly for the long term.
From our – precious metals investors’ and traders’ – point of view, this is also of critical importance. All previous important invalidations of breakouts in world stocks were followed by massive declines in mining stocks (represented by the XAU Index).
Two of the four similar cases are the 2008 and 2020 declines. In all cases, the declines were huge, and the only reason why they appear “moderate” in the lower part of the above chart is that it has a “linear” and not a “logarithmic” scale. You probably still remember how significant and painful (if you were long, that is) the decline at the beginning of 2020 was.
All those invalidations triggered big declines in the mining stocks, and we have “the mother of all stock market invalidations” at the moment, so the implications are not only bearish, but extremely bearish.
World stocks have declined below their recent highs, and when something similar happened in 2008, it meant that both stocks and gold and silver mining stocks (lower part of the chart) were about to slide much further.
The medium-term implications for mining stocks are extremely bearish.
However, let’s get back to the short- and medium-term point of view.
Last week, I wrote the following:
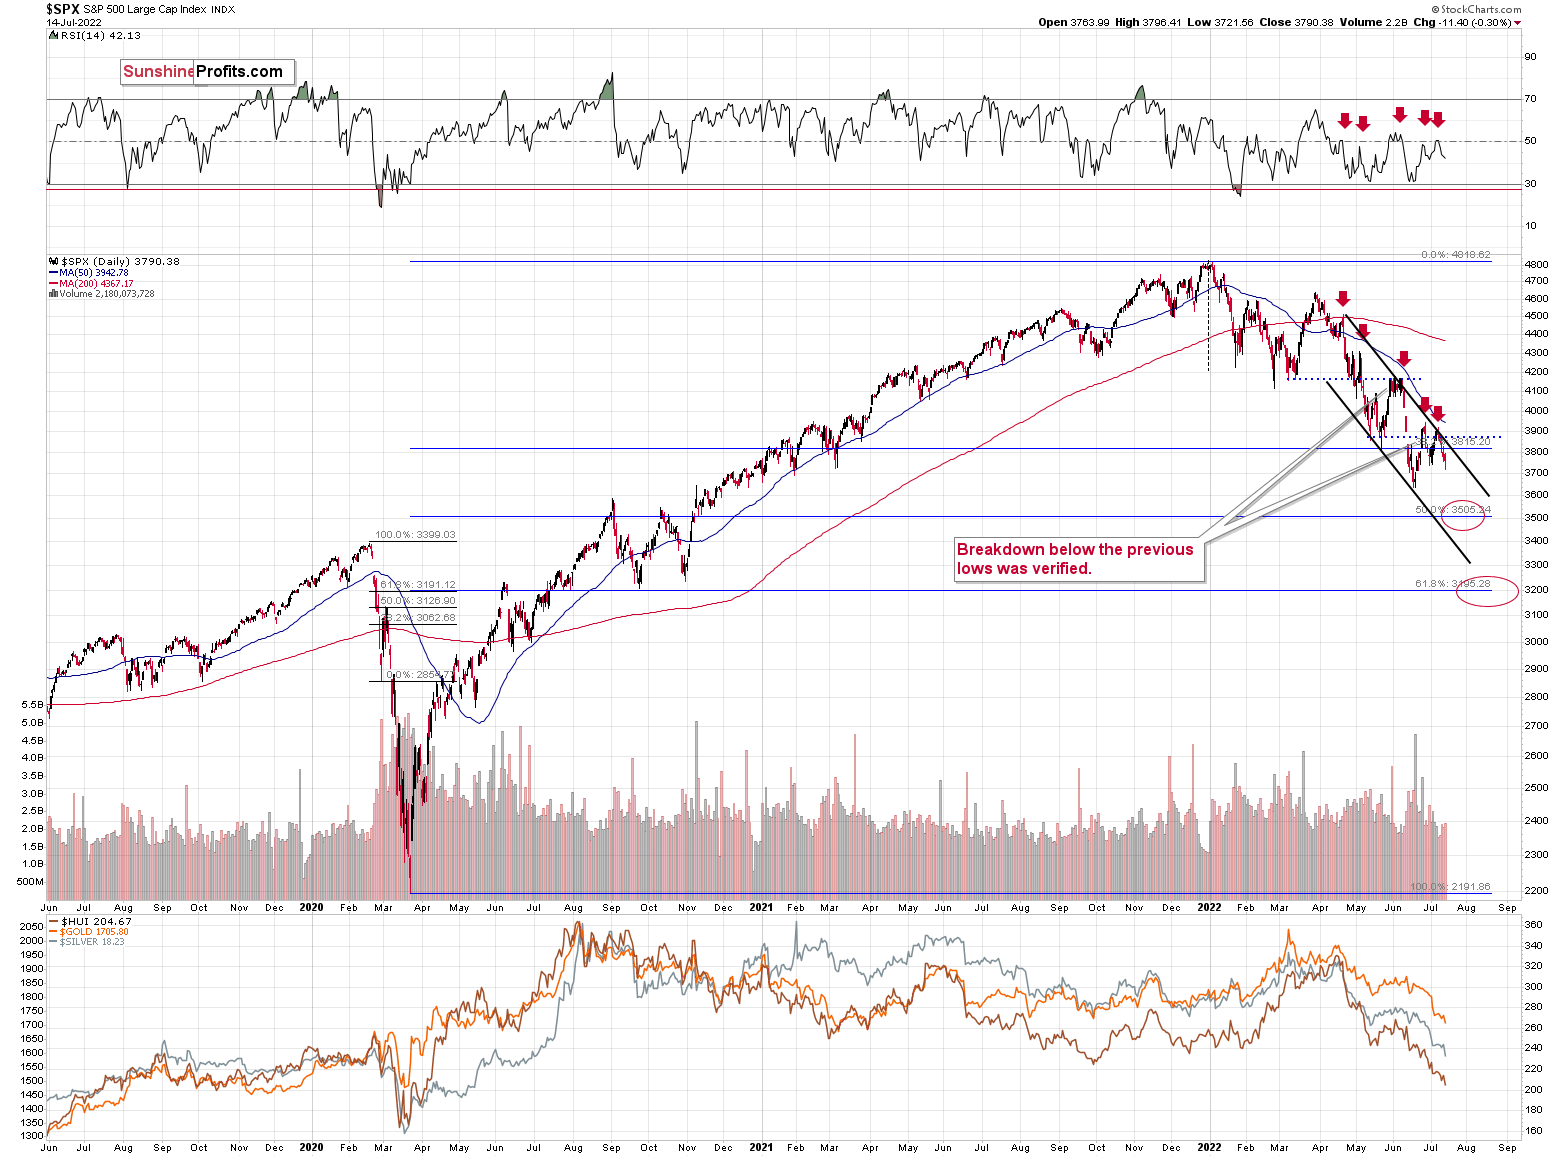
The S&P 500 just moved to the upper border of its trading channel, which means that it’s now likely to reverse its course. This scenario is supported by the action in the RSI indicator.
As you can see on the above chart (marked with red arrows), when the RSI moved to or close to 50 in recent months, it meant that the corrective rally was either over or about to end. The RSI just moved to 50.76.
In all recent cases, the declines that followed this RSI-close-to-50 sell signal were sharp. All of them, except the last one, were quite significant from the short-term point of view. In fact, if the S&P 500 does exactly what it did after the previous signals, it will likely move close to the 3,500 level, which has been my target area for some time now. That’s where we have the 50% Fibonacci retracement based on the entire 2020-2022 rally.
Most interestingly, though, such a decline would likely have a devastating effect on the prices of mining stocks (especially junior mining stocks) and silver. There might be some impact on gold, too.
The above would also be in tune with an extra rally in the USD Index. After all, less competitive exports are not that favorable for the U.S. economy.
That’s pretty much what happened this week. Stocks, PMs, and junior miners decline as the USD Index rallied. However, even though S&P 500 didn’t move to its downside target area, its short-term picture suggests higher prices.
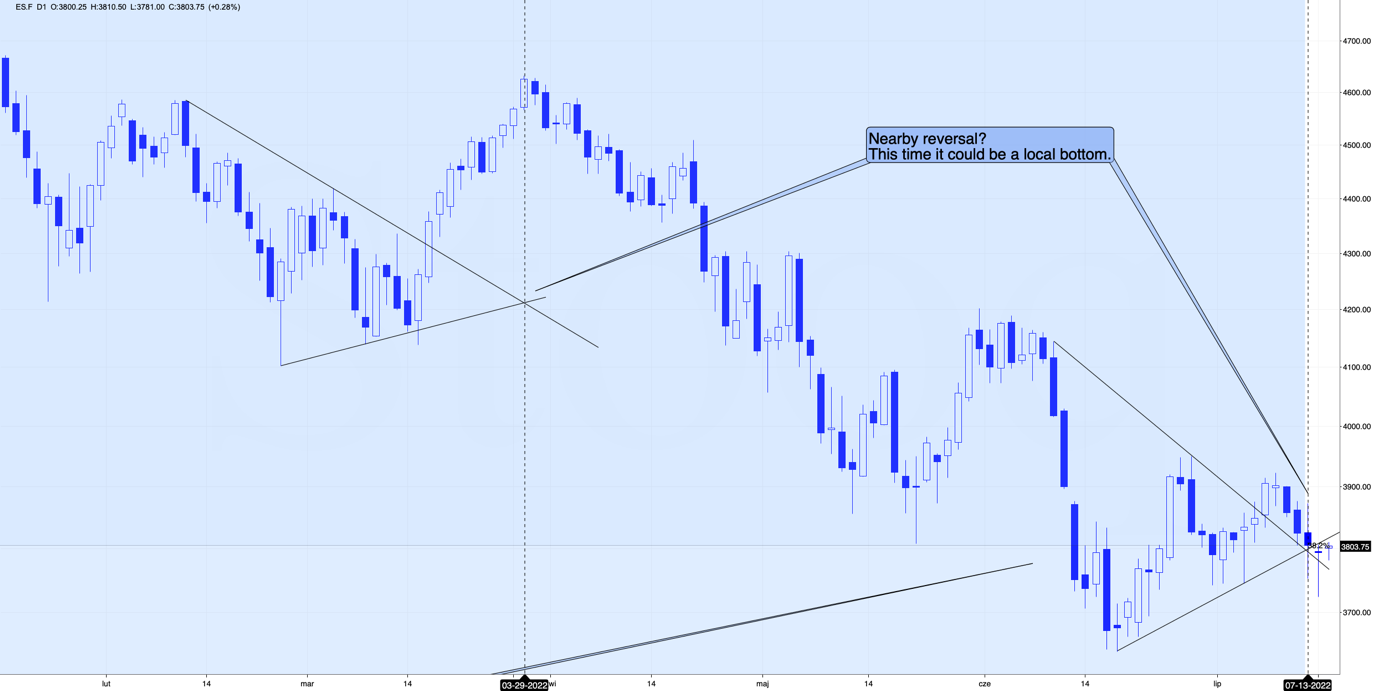
During yesterday’s session, S&P 500 futures repeated the reversal and they are up in today’s pre-market trading. This is a bullish indication for the short run, especially since yesterday’s reversal took place right after Wednesday’s reversal that was based on both technical (triangle-vertex-based reversal) and news-based factors (sell-the-rumor-buy-the-fact type of reaction based on the CPI details).
Having said that, let’s take a look at the key market where the most notable thing happened this week – the forex market.
Last week, I commented on the above USD Index in the following way:
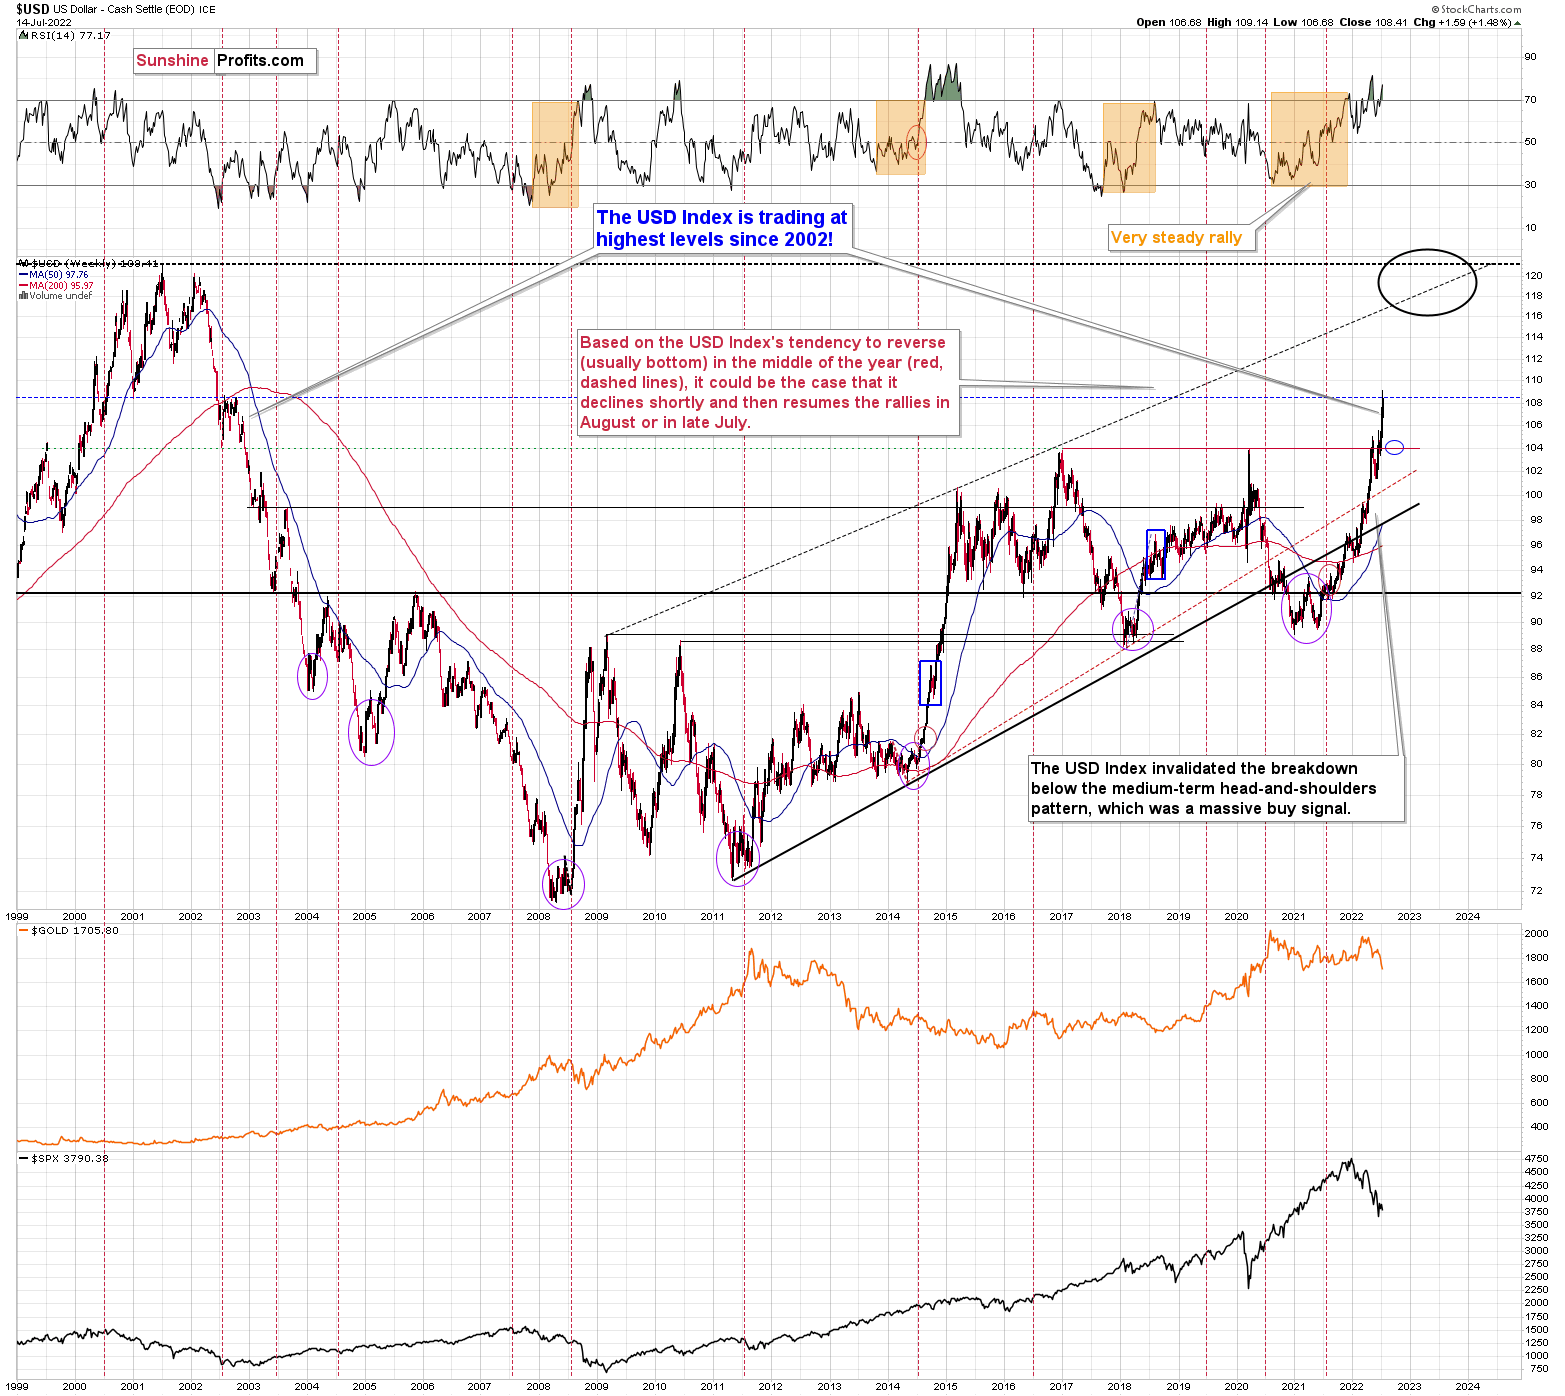
Speaking of the USD Index, after invalidating the breakout below the multi-year head-and-shoulders pattern, the USDX was poised to soar, just like I’ve been expecting it to do for more than a year, and that’s exactly what it did. And now it’s as high as it hasn’t been that high in 20 years!
The USD Index just broke above the previous highs, and it did so after correcting, which means that it just completed a massively bullish cup-and-handle pattern. This pattern is likely to send the USD Index much higher. However, since no market moves in a straight line, either up or down, let’s see where we have potential resistance levels.
The nearest resistance is provided by the 2002 high, and it’s slightly above the 108 level.
This means that the USD Index could easily rally by another 1 index point or so, which in turn could easily trigger another profound decline in gold.
This could happen this week (or early next week), so please stay tuned.
Whether this triggers a massive decline in junior miners or not is a different matter. It might, but it also might trigger a move back to this week’s intraday lows or just somewhat below them, and then miners could show strength. Either of the above – if accompanied by gold’s move to/below $1,700 – would serve as a signal for closing one’s current short positions and taking our massive profits off the table.
If the general stock market declines along with a rally in the USD Index, then the scenario in which the junior miners decline profoundly will likely be realized. I think it’s the more likely scenario here.
Do I plan to enter a long position once I close the current short position? Yes (just like I did at the end of the previous big correction), but only if gold declines below $1,700. If it doesn’t, and it moves higher right now, then I most likely won’t make any adjustments to the current short position. Remember – it’s not the point to catch each and every price move – in fact, it’s impossible to do so. The point is to select those trades that have the best risk-to-reward ratio and then enter trades while waiting out (i.e., ignoring) possible trades that don’t have a very favorable risk-to-reward ratio.
Well, that’s exactly what happened this week. As the target for the USD Index was reached, it’s now likely to correct. Based on the risk to reward ratio, I closed the previous short position, taking huge profits off the table, and I – again based on the risk to reward ratio – I opened long positions in the precious metals sector.
The USD Index has quite likely formed a short-term top here, and it’s now likely to correct. How low would the USD Index be likely to move? Quite possibly to the 104 level or so, as that’s where we have very strong medium-term support. This support level is strengthened by the 1999 high (approximately), the 2002 low, the 2016 high, and the 2020 high – all very important highs.
The key technical reason due to which a decline in the USD Index is now so likely came from the key component of the Index – the EUR/USD currency pair.
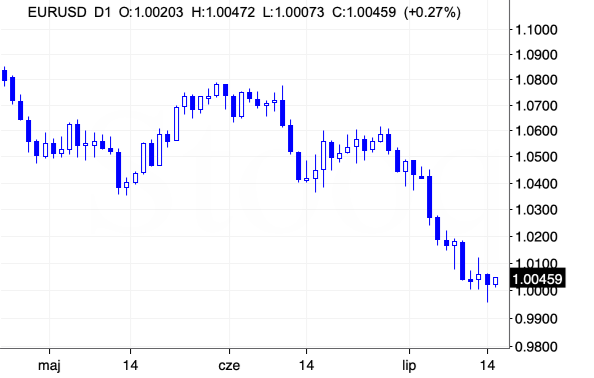
I can’t stress enough how CRITICAL yesterday’s session was on a technical level.
The shape of the session itself is already profoundly bearish, as the EUR/USD pair reversed after a sizable decline in a hammer candlestick fashion, thus indicing a reversal.
However, it is the level itself that was first slightly broken and then proved to be a strong support, after all, that really matters. It’s the all-important 1 level.
Yesterday, for a short while (yes, I took some screenshots for the record, just as I did when crude oil futures were trading below 0 months ago), the euro was cheaper than the U.S. dollar!
If this isn’t a headline-worthy piece of news for the financial world, then I don’t know what is. This is likely to attract many buyers in the short term and trigger a rally in the pair – thereby triggering a decline in the USD Index.
Ultimately – after a correction – I think that this key level (1) will be broken and that’s when the real panic will set in (also in the PMs), but for now, it seems that a corrective upswing is due. This goes for PMs and junior miners, too.
Naturally, as always, I’ll keep you – my subscribers – informed.
Overview of the Upcoming Part of the Decline
- It seems to me that we’re going to see a corrective upswing here (probably ending in the final week of July) that will then be followed by a very big decline in the precious metals sector.
- If we see a situation where miners slide in a meaningful and volatile way while silver doesn’t (it just declines moderately), I plan to – once again – switch from short positions in miners to short positions in silver. At this time, it’s too early to say at what price levels this could take place and if we get this kind of opportunity at all – perhaps with gold prices close to $1,600.
- If we see a situation where miners slide in a meaningful and volatile way while silver doesn’t (it just declines moderately), I plan to – once again – switch from short positions in miners to short positions in silver. At this time, it’s too early to say at what price levels this could take place and if we get this kind of opportunity at all – perhaps with gold prices close to $1,600.
- I plan to exit all remaining short positions once gold shows substantial strength relative to the USD Index while the latter is still rallying. This may be the case with gold close to $1,400. I expect silver to fall the hardest in the final part of the move. This moment (when gold performs very strongly against the rallying USD and miners are strong relative to gold after its substantial decline) is likely to be the best entry point for long-term investments, in my view. This can also happen with gold close to $1,400, but at the moment it’s too early to say with certainty.
- The above is based on the information available today, and it might change in the following days/weeks.
You will find my general overview of the outlook for gold on the chart below:
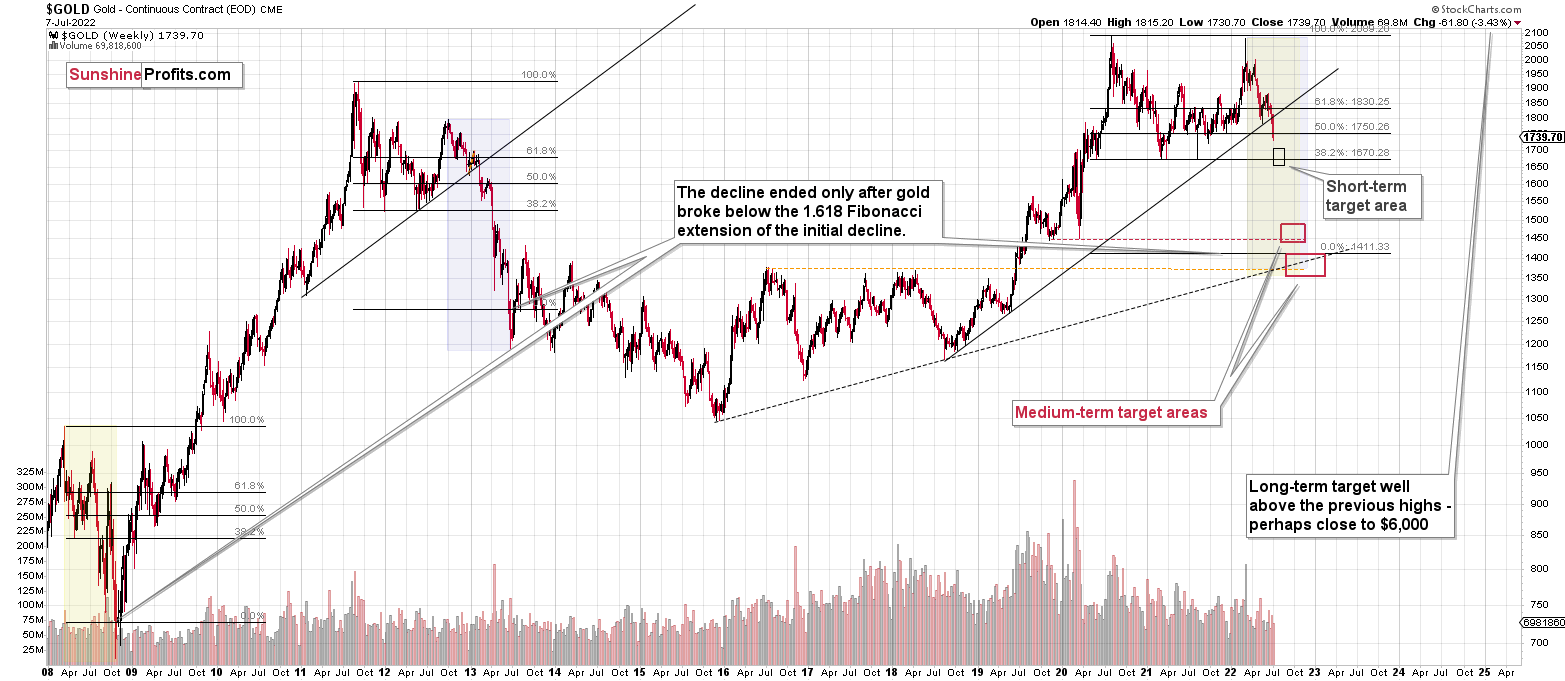
Please note that the above timing details are relatively broad and “for general overview only” – so that you know more or less what I think and how volatile I think the moves are likely to be – on an approximate basis. These time targets are not binding or clear enough for me to think that they should be used for purchasing options, warrants, or similar instruments.
Summary
Summing up, it seems to me that the short-term rally in the precious metals market is either over or close to being over. In fact, it’s so close to being over that I think it’s already a good idea to be shorting junior mining stocks.
I previously wrote that the profits from the previous long position (congratulations once again) were likely to further enhance the profits on this huge decline, and that’s exactly what happened. The profit potential with regard to the upcoming gargantuan decline remains huge.
As investors are starting to wake up to reality, the precious metals sector (particularly junior mining stocks) is declining sharply. Here are the key aspects of the reality that market participants have ignored:
- rising real interest rates,
- rising USD Index values.
Both of the aforementioned are the two most important fundamental drivers of the gold price. Since neither the USD Index nor real interest rates are likely to stop rising anytime soon (especially now that inflation has become highly political), the gold price is likely to fall sooner or later. Given the analogy to 2012 in gold, silver, and mining stocks, “sooner” is the more likely outcome.
After the final sell-off (that takes gold to about $1,350-$1,500), I expect the precious metals to rally significantly. The final part of the decline might take as little as 1-5 weeks, so it's important to stay alert to any changes.
As always, we'll keep you – our subscribers – informed.
To summarize:
Short-term outlook for the precious metals sector (our opinion on the next 1-6 weeks): Bearish
Medium-term outlook for the precious metals sector (our opinion for the period between 1.5 and 6 months): Bearish initially, then possibly Bullish
Long-term outlook for the precious metals sector (our opinion for the period between 6 and 24 months from now): Bullish
Very long-term outlook for the precious metals sector (our opinion for the period starting 2 years from now): Bullish
As a reminder, Gold Investment Updates are posted approximately once per week. We are usually posting them on Friday, but we can’t promise that it will be the case each week.
Our preferred ways to invest in and to trade gold along with the reasoning can be found in the how to buy gold section. Additionally, our preferred ETFs and ETNs can be found in our Gold & Silver ETF Ranking.
Moreover, Gold & Silver Trading Alerts are posted before or on each trading day (we usually post them before the opening bell, but we don’t promise doing that each day). If there’s anything urgent, we will send you an additional small alert before posting the main one.
Thank you.
Przemyslaw Radomski, CFA
Founder, Editor-in-chief

