

Briefly: gold and the rest of the precious metals market are likely to decline in the next several weeks/months and then start another powerful rally. Gold’s strong bullish reversal/rally despite the USD Index’s continuous strength will likely be the signal confirming that the bottom is in.
While we usually post longer analyses on Fridays, this week we’re once again moving this to today, as your Editor (PR) will be traveling tomorrow, and the technical part will thus be rather short.
Having said that, let’s start today’s analysis with a recap of what recently happened on the fundamental front.
The Weekly Fundamental Roundup
Despite the fact that the financial markets were closed for the Easter holiday, there was still plenty of drama. For example, the U.S. 10-Year real yield hit 0% and briefly turned positive for the first time since 2020, the USD Index topped 101, and Fed officials warned of several rate hikes in the coming months.
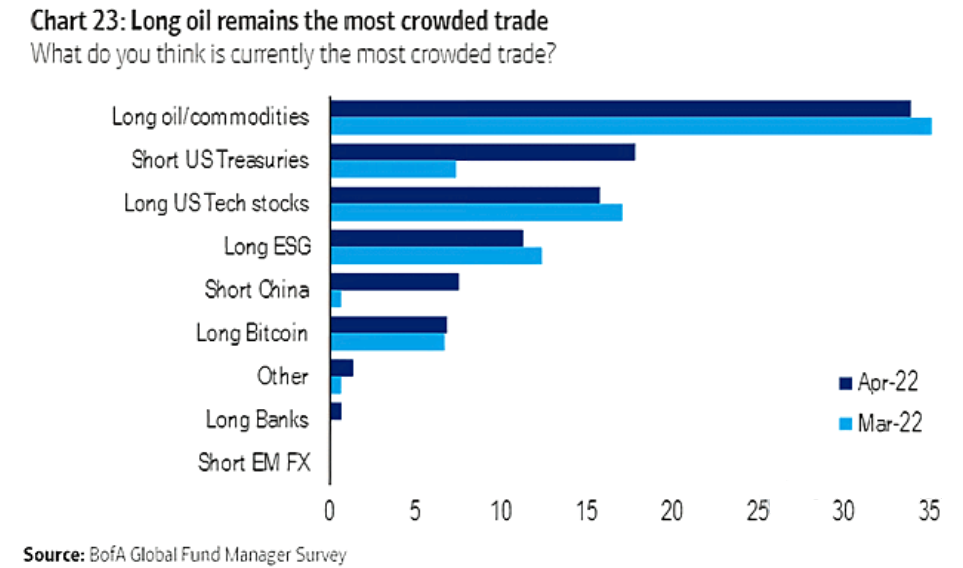
However, while all of these developments are fundamentally bearish for the PMs, the most crowded trade on Wall Street has the commodities complex sitting pretty.
Please see below:
While Netflix's drubbing on Apr. 20 should be a cautionary tale of the consequences of deteriorating fundamentals, the PMs remain uplifted, but with the medium term likely to elicit a material shift in sentiment, don't be surprised if investors' wrath is eventually thrust upon them.
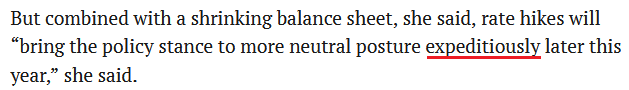
To explain, the devil is in the details, and when you watch for subtle clues, the puzzle pieces come together. For example, I warned on Apr. 13 that Fed officials' messaging couldn't be clearer. I wrote:
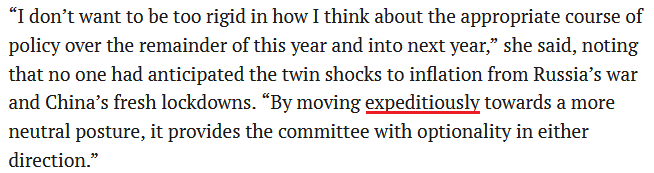
Fed Governor Lael Brainard said on Apr. 12: “Inflation is too high, and getting inflation down is going to be our most important task.”
More importantly, notice her use of that all-important buzzword.
 Source: Reuters
And:
 Source: Reuters
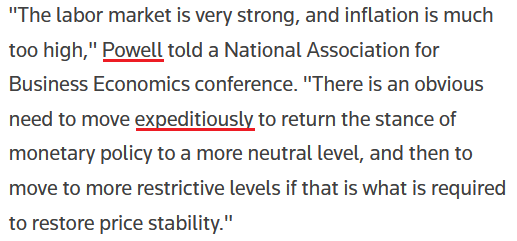
Moreover, where do you think she got it?
 Source: Reuters
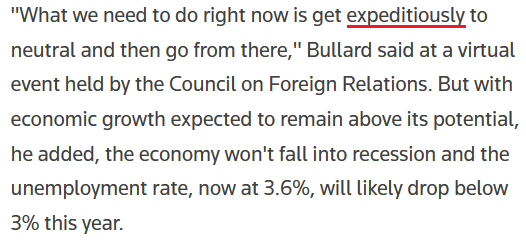
Likewise, St. Louis Fed President James Bullard said on Apr. 18 that inflation is “far too high” and that a rapid rise to neutral is the most likely outcome. For context, he wants to increase the U.S. federal funds rate to 3.5% by the end of 2022. Moreover, there is that word again:
 Source: Reuters
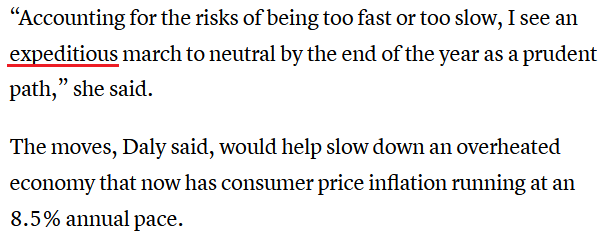
Continuing the theme, San Francisco Fed President Mary Daly said on Apr. 20 that a 50 basis point rate hike in May is "complete" and "solid." As a result, it's like Fed officials have morphed into those toys that repeat the same message when you pull the string.
Please see below:
 Source: CNBC
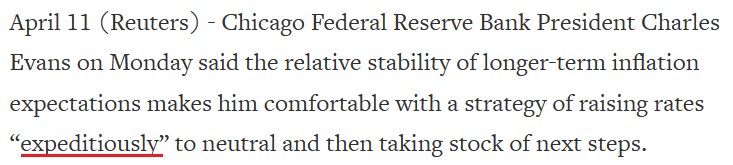
As further evidence, can you guess what Chicago Fed President Charles Evans said on Apr. 11?
 Source: Reuters
Therefore, do you think it’s a coincidence that Fed officials are repeating the same message? Of course not. After the FOMC’s December monetary policy meeting, I warned that Chairman Jerome Powell uses his deputies to deliver remarks on his behalf. I wrote on Dec. 16:
As one of the most important quotes of the press conference, [Powell] admitted:
“My colleagues were out talking about a faster taper, and that doesn’t happen by accident. They were out talking about a faster taper before the president made his decision. So it’s a decision that effectively was more than entrained.”
While Powell sounded a little rattled during the exchange, his slip highlights the importance of Fed officials’ hawkish rhetoric. Essentially, when Clarida, Waller, Bostic, Bullard, etc., are making the hawkish rounds, “that doesn’t happen by accident.” As such, it’s an admission that his understudies serve as messengers for pre-determined policy decisions.
To that point, Evans added on Apr. 19: “On the way to December, you’d be looking for any confirmation of the storyline. It could be that short-term neutral is actually lower, and that by the time we get to 2.5%, it’s actually contractionary for a variety of reasons. It could go the other way too.”
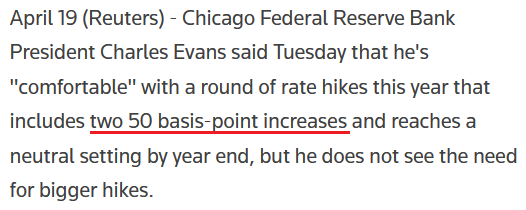
However, given the state of inflation, he realistically said: “Probably we are going beyond neutral. That’s my expectation.” As a result, more than one 50 basis point rate hike is on the table.
Please see below:
 Source: Reuters
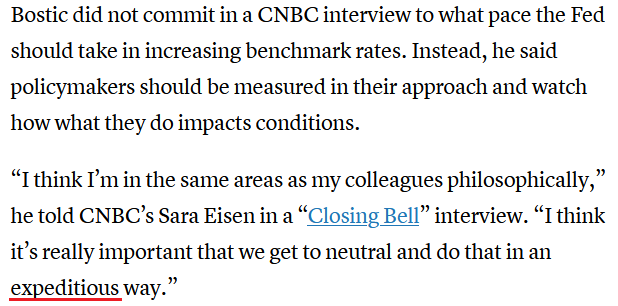
Also noteworthy, Atlanta Fed President Raphael Bostic was the most dovish of the crew this week. He said:
“I really have us looking at one and three-quarters by the end of the year, but [inflation] could be slower depending on how the economy evolves and we do see greater weakening than I’m seeing in my baseline model. This is one reason why I’m reluctant to really declare that we want to go a long way beyond our neutral place, because that may be more hikes than are warranted given sort of the economic environment.”
However, stating that the neutral U.S. federal funds rate could range from 2% to 2.5% or be as low as 1.75%, he remains aligned with the FOMC's median projection of six more rate hikes (seven in total) in 2022. Also, there is that word again.
 Source: CNBC
As a result, it’s funny how obvious Fed officials’ messaging has become. In a nutshell: Powell sets the tone, and his deputies recite his message in hopes that investors will react accordingly. However, with investors in denial and/or unable to see the forest through the trees, they’re not heeding the warnings.
Ironically, the U.S. technology sector has been decimated in recent months, while commodities remain uplifted. However, seven to 12 rate hikes over nine months will heavily impact demand and are materially bearish for commodities’ fundamentals. Therefore, one could argue that commodities have more to lose in the coming months than technology stocks.
In any event, investors seem to believe that either inflation will subside on its own or the Fed will back off. However, neither outcome is realistic. I’ve mentioned on numerous occasions that political ramifications should keep the pressure on the Fed. As a result, as long as inflation persists, the prospect of a dovish 180 is slim to none. To explain, I wrote on Apr. 20:
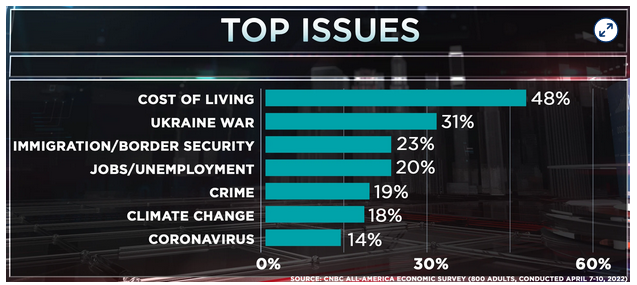
CNBC released its All-America Economic Survey on Apr. 13. The report revealed that “47% of the public say the economy is ‘poor,’ the highest number in that category since 2012. Only 17% rank the economy as excellent or good, the lowest since 2014.”
Please see below:
Likewise, I’ve also noted on numerous occasions that U.S. President Joe Biden’s approval rating is inversely correlated with inflation.
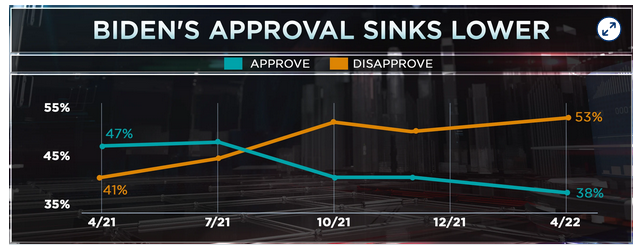
As a result, while investors assume that the Fed will bow down to the financial markets, the reality is that the game has changed. Previously, the Fed could support asset prices without the general public noticing. Now, inflation is front-page news and is hurting middle-class and poor Americans. Therefore, the Fed has to deal with the issue, and political pressure should force officials’ hands, whether they like it or not.
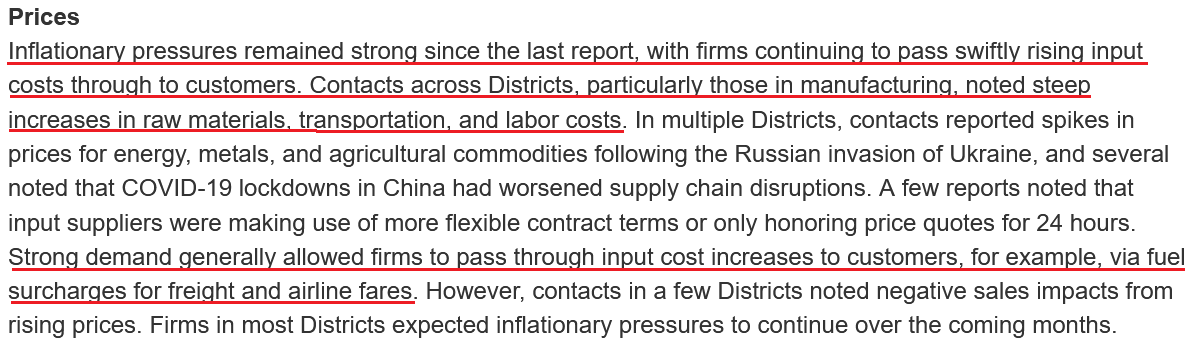
To that point, the inflation data continues to sizzle. For example, the Fed released its Beige Book on Apr. 20. The report revealed:
 Source: U.S. Fed
As for wage inflation:
“Employment increased at a moderate pace. Demand for workers continued to be strong across most Districts and industry sectors. But hiring was held back by the overall lack of available workers, though several Districts reported signs of modest improvement in worker availability. Many firms reported significant turnover as workers left for higher wages and more flexible job schedules.”
“Persistent labor demand continued to fuel strong wage growth, particularly for footloose workers willing to change jobs. Firms reported that inflationary pressures were also contributing to higher wages, and that higher wages were doing little to alleviate widespread job vacancies. But some contacts reported early signs that the strong pace of wage growth had begun to slow.”
As a result, with inflation and employment still holding firm, this is bullish for Fed policy and bearish for the PMs.
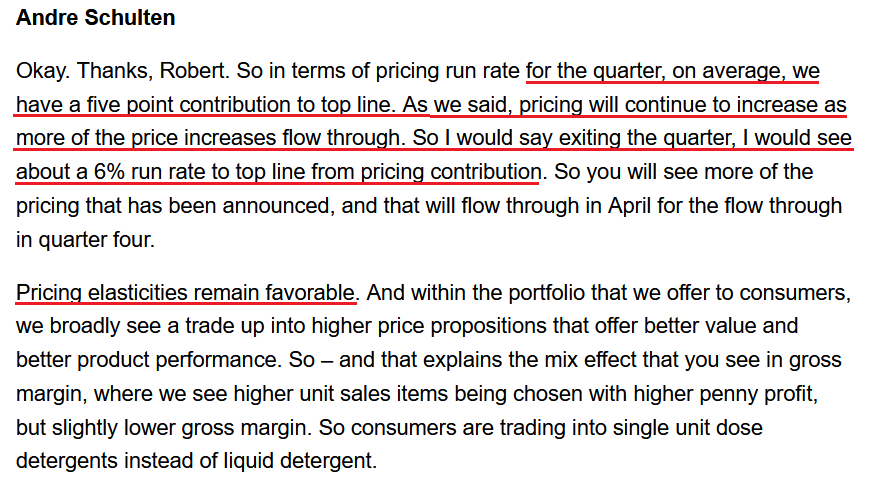
Furthermore, Procter & Gamble (P&G) released its third-quarter earnings on Apr. 20. For context, the company sells various consumer staples and household products. CFO Andre Schulten said during the Q3 earnings call:
“We said each quarter that we will undoubtedly experience more volatility as we move through the fiscal year. We've seen another step in cost pressures, and foreign exchange rates have moved further against us. Transportation and labor markets remain tight. Availability of materials remains stretched in some categories and markets. Inflationary cost pressures are broad-based and continue to increase with little sign of near-term relief and have resulted in consumer price increases across CPG categories and beyond.”
Thus, Schulten noted that ~5% price hikes in Q3 will look more like ~6% in Q4.
Please see below:
 Source: P&G/Seeking Alpha
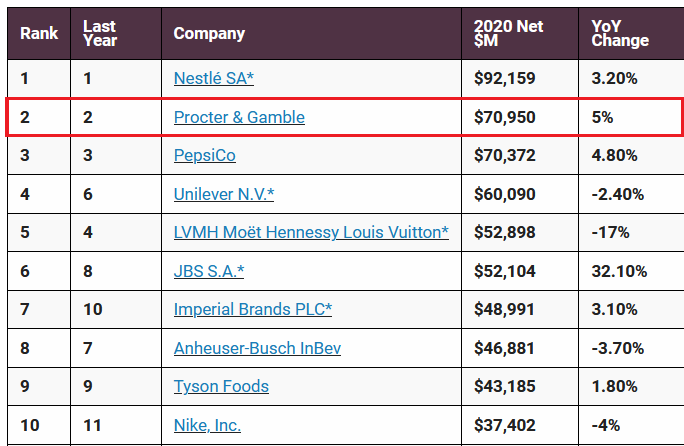
For your reference, favorable price elasticities mean that when P&G raises prices, the company is not seeing a drop-off in demand. Moreover, P&G is no small fry. In fact, the company ranked second on Consumer Goods Technology's (CGT) 2021 Top 100 Consumer Goods Companies list. Therefore, it's more fuel for the hawkish fire.
 Source: CGT
The bottom line? While the answers are hiding in plain sight, investors do what they usually do: they ignore the fundamentals until something breaks. Then, it’s a rush for the exits and the financial media does a post-mortem about why everyone should have seen it coming. However, it’s simply the nature of investor psychology.
Therefore, no matter how many times Fed officials say “expeditious-ly” or how much the inflation data supports even more hawkish policy, investors usually don’t get the message until it’s too late. However, when reality re-emerges, there will likely be a long way down before the PMs’ prices get to the oversold territory, from which another powerful rally could emerge.
In conclusion, the PMs were mixed on Apr. 20, as momentum still remains elevated. However, with real yields and the USD Index rising, the only things holding up the PMs are the Russia-Ukraine conflict and sentiment. Therefore, when the latter two wane and the former two remain, gold, silver, and mining stocks should suffer profound drawdowns.
What to Watch for Next Week
With more U.S. economic data releases next week, the most important ones are as follows:
- Apr. 26: Confidence Board consumer confidence, Richmond and Dallas Fed’s manufacturing and services indexes, S&P/Case-Shiller home price index.
With consumer confidence providing insight into employment and inflation sentiment, the data highlights how “anchored,” or lack thereof, consumers’ medium-term expectations are with the Fed’s mandate. Likewise, the Richmond and Dallas Fed indexes are leading indicators of inflation and employment, while the S&P/Case-Shiller home price index offers a lagged look at housing inflation (which often leads to rent inflation).
- Apr. 28: Q1 GDP and Kansas City Fed manufacturing index.
GDP is lagged data, and investors are forward-looking. However, it's still important to monitor. Moreover, it will be interesting to see if the Kansas City Fed's data aligns with the Richmond and Dallas Fed's results.
All in all, economic data releases impact the PMs because they impact monetary policy. Moreover, if we continue to see higher employment and inflation, the Fed should keep its foot on the hawkish accelerator. If that occurs, the outcome is profoundly bearish for the PMs.
Let’s start today’s technical discussion with a quick check on copper prices.
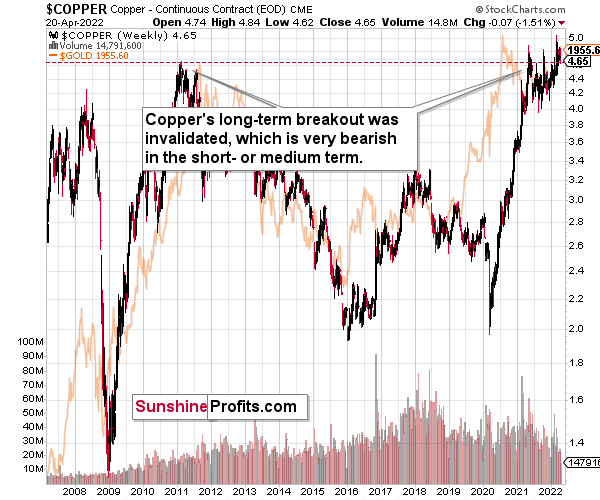
Copper recently invalidated another attempt to move above its 2011 high. This is a very strong technical sign that copper (one of the most popular commodities) is heading lower in the medium term.
Right now, copper is trying to break above its 2011 high once again, but given the previous invalidations, it’s doubtful that this attempt will be successful, especially given the situation in interest rates.
The interest rates are going up, just like they did before the 2008 slide. What did copper do before the 2008 slide? It failed to break above the previous (2006) high, and it was the failure of the second attempt to break higher that triggered the powerful decline. What happened then? Gold declined, but silver and mining stocks truly plunged. The GDXJ was not trading at the time, so we’ll have to use a different proxy to see what this part of the mining stock sector did.
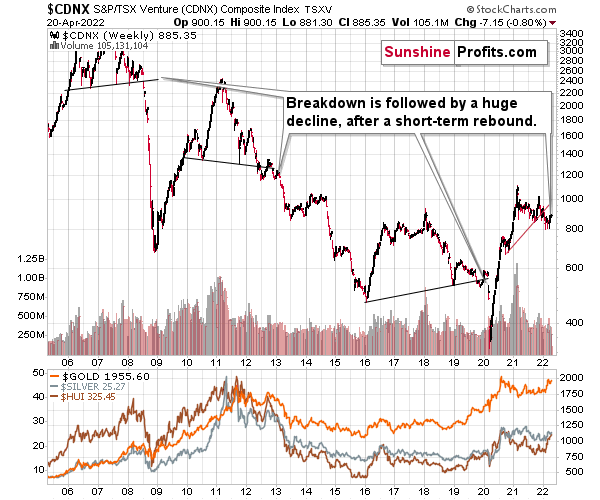
The Toronto Stock Exchange Venture Index includes multiple junior mining stocks. It also includes other companies, but juniors are a large part of it, and they truly plunged in 2008.
In fact, they plunged in a major way after breaking below their medium-term support lines and after an initial corrective upswing. Guess what – this index is after a major medium-term breakdown and a short-term corrective upswing. It’s likely ready to fall – and to fall hard.
So, what’s likely to happen? We’re about to see a huge slide, even if we don’t see it within the next few days.
What has happened recently?
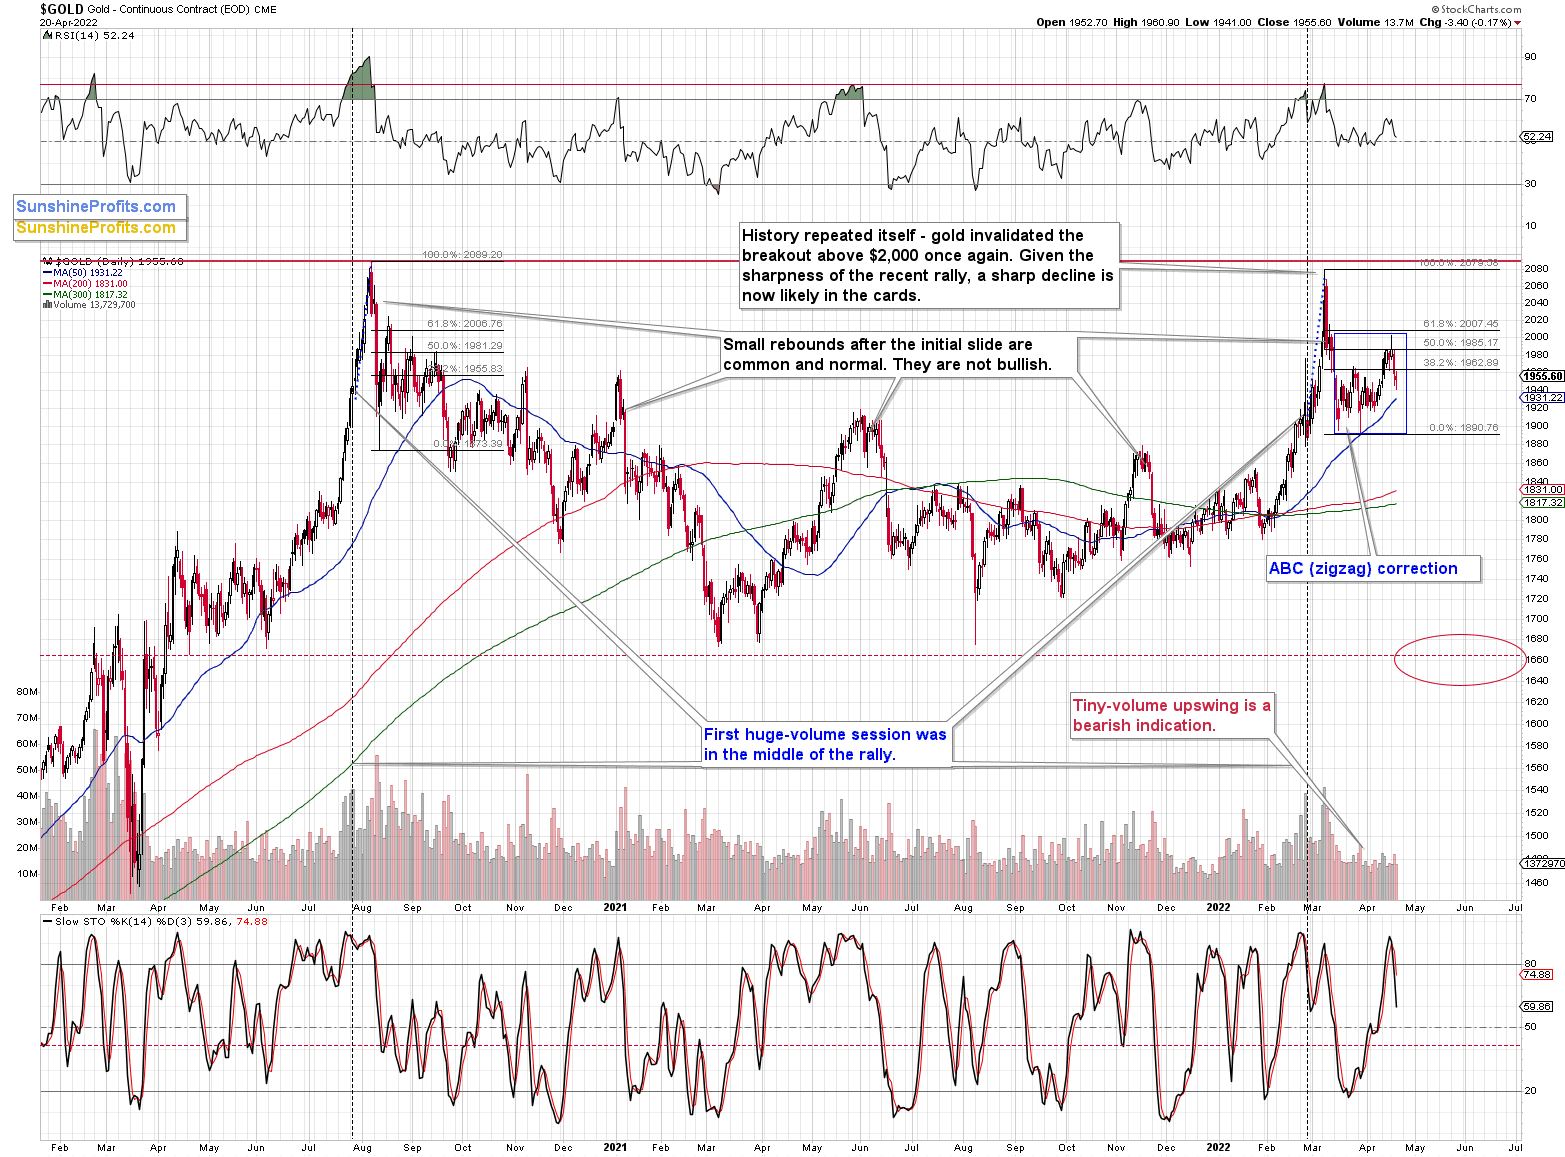
Gold declined after reversing and failing to break above $2,000.
Last week (on Thursday), I wrote the following:
However, there’s also a good reason why gold and the rest of the precious metals sector could postpone their decline to next week. It’s the simple fact that it’s a long weekend and many people will take their thoughts off the day-to-day price swings, so they will be better able to realize what’s really going on.
While people might not necessarily recognize the long-term analogies on the charts (or they might – my point is that the following is more likely to be the topic of conversations), they could realize (especially as they spend time with and talk with their families and friends) that the situation in interest rates and the USD Index doesn’t support higher, but much lower stock, commodity, and gold prices in the following months and (probably) weeks. In other words, the extra day off from the markets might help people re-focus on what’s actually going on instead of simply following the momentum.
Indeed, the gold price declined substantially this week, and it closed below its late-March 2022 high, thus invalidating the breakout above it. Instead of the breakout above $2,000, we saw the above. Instead of a bullish sign, we got a sell signal.
We also got another from the stochastic indicator that not only moved below its signal line, but also below the 80 level.
Moreover, let’s not forget that it all happened in tune with what we saw back in 2020, after gold’s major top.
Back then, gold retraced slightly more than 61.8% of the decline. Although this time it retraced slightly less, both cases are still very similar.
Consequently, this month’s recent upswing was not really bullish – it was a natural part of a bigger bearish pattern.
Moreover, let’s keep in mind that between 2020 and now, quite a lot happened, quite a lot of money was printed, and we saw a war breaking out in Europe. Yet, gold failed to rally to new highs.
In fact, it’s trading very close to its 2011 high, which tells you something about the strength of this market. It’s almost absent.
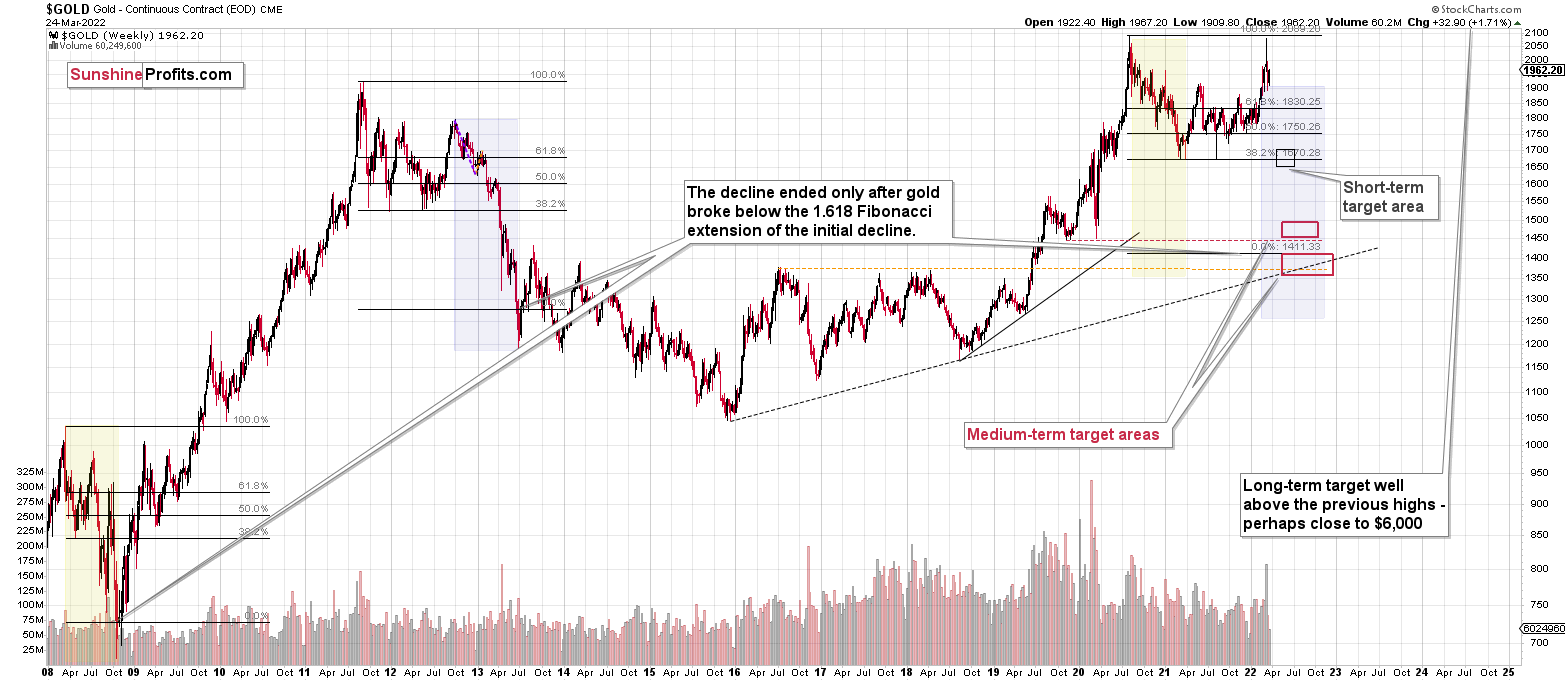
Truth be told, what we see in gold is quite in tune with what we saw after the 2011 top, and in particular, shortly after the 2012 top. The long-term gold price chart below provides details.
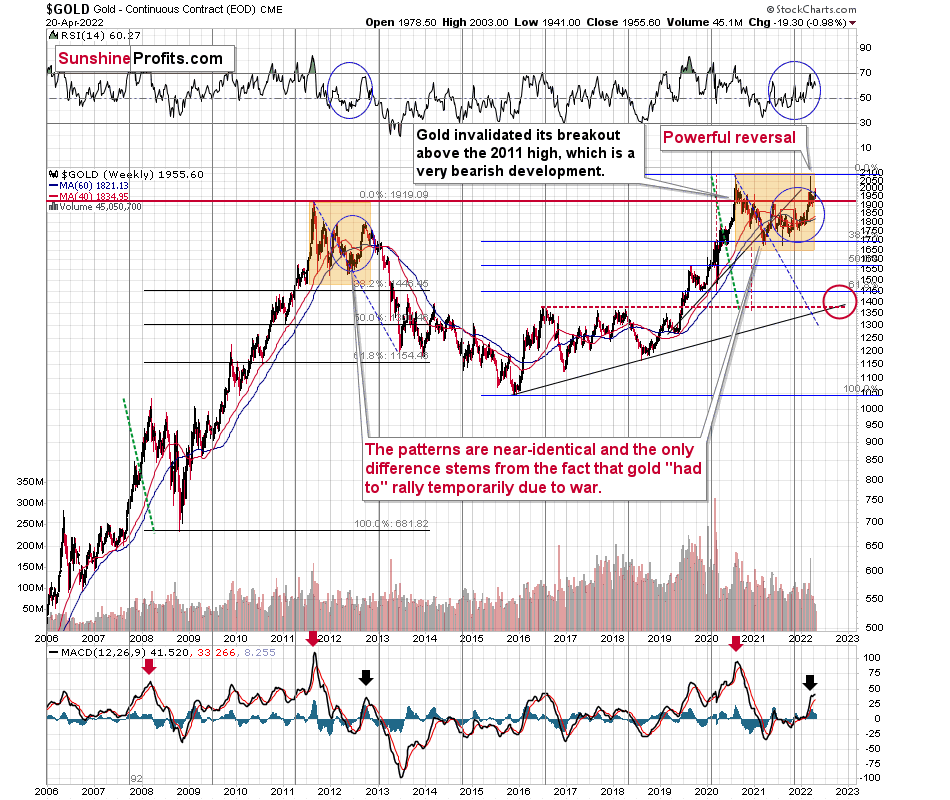
It seems that if it weren’t for the war in Europe, gold wouldn’t have been able to move above $2,000 and instead it would have topped close to its previous highs, which provided strong resistance.
The extraordinary thing about that is that that’s exactly what happened in 2012. Gold moved higher but only until it reached its previous highs, which happened in the second half of 2012.
This time the RSI was a bit higher, but it was close to 70, just like what we saw in 2012.
The moves that we see in the long-term MACD indicator (lower part of the above chart) also confirm the analogy between now and 2012. The indicator is between 25 and 50, and it’s above its previous local top (early 2012 and mid-2021), and this local top formed after a profound decline from the ultimate top.
Yes, this time gold moved back to the previous high, but:
- This happened based on a geopolitical event (war in Europe) and geopolitically-driven rallies are generally unsustainable;
- When gold reached its previous highs, it also formed a profound weekly reversal, which formed on huge volume, and that’s very bearish.
So, the current outlook for gold is very bearish – the recent back and forth movement (the consolidation) appears analogous to the back-and-forth part of the decline that we saw right after the 2012 top. That was the beginning of a huge medium-term downswing.
Meanwhile, silver is correcting too. The white metal had moved to approximately its previous high, which provided resistance, and then it declined. In other words, silver once again failed to rally above the 50% retracement based on the 2021 decline.
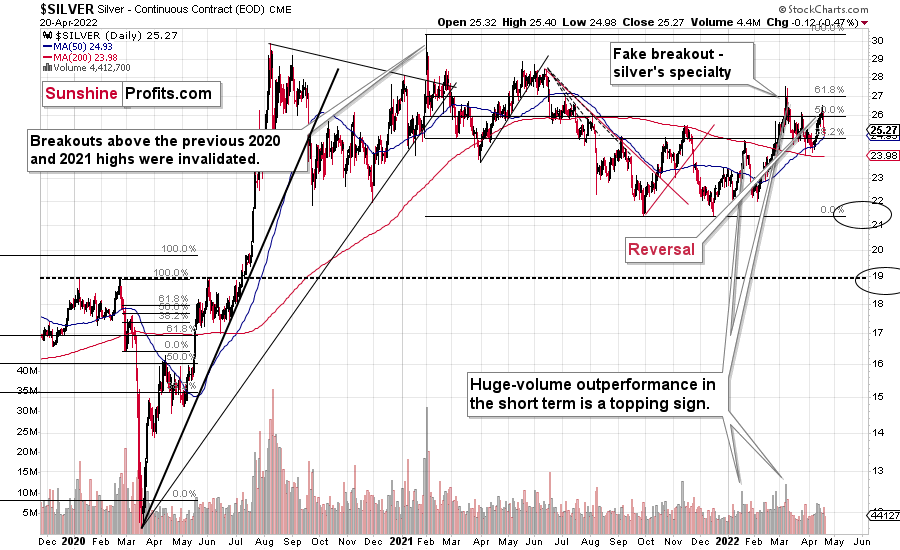
Let’s keep in mind that silver outperformed gold right at the end of the recent rally, which further validates the theory that the rally is already over – silver’s outperformance is what we tend to see in the final parts of a given rally.
Also, silver is known for its fake breakouts, so the fact that we just saw one isn’t really bullish (especially that it was already invalidated!). In fact, I wrote about that several days ago – it was possible that it would happen, and it did. It didn’t change the outlook – what we see is in near-perfect tune with what we saw in 2012 – that’s the back-and-forth decline in gold and silver and the consolidation in the mining stocks.
This is bearish, and it’s in tune with other indications that we have gotten previously from the price of the white metal.
First of all, when silver got really popular in early 2021, it still failed to hold the breakout above the previous highs. Back then, very few people wanted to listen to this, but I warned that this was the exact wrong moment to buy silver and that better buying opportunities were likely ahead. Well, it turns out that those buying at close to $30 have bought at close to a year+ top. As practically everyone interested had already gotten in, the price declined as there was nobody (of course, that’s just an oversimplification) else who wanted to buy, and the market needs to attract fresh buying power if the price is to rally.
Anyway, after that invalidation, silver never managed to get very close to the $30 level.
Sure, it will likely surpass it, and then the previous all-time high, and then move to three digits, but it doesn’t mean that it has to happen very soon, as well as that silver can’t slide profoundly before that happens.
In fact, gold is not the only precious metal that is repeating its 2012 performance right now, and you can see more details on silver’s long-term chart.
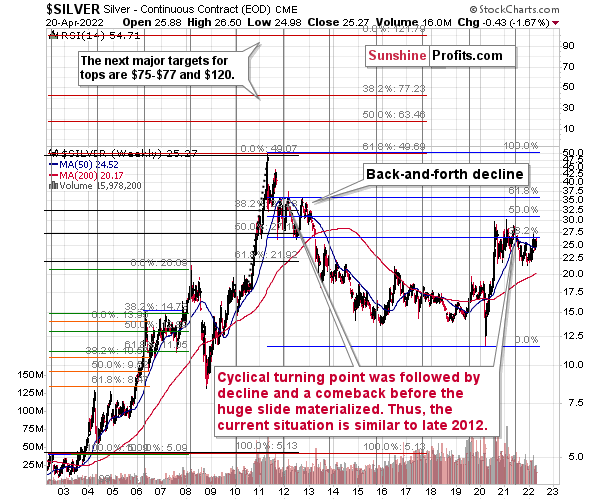
As you can see on the above chart, silver corrected about 50% of the previous downswing, and this correction ended at about $30, a long time ago. Ever since, silver has been declining, and even the outbreak of war in Europe didn’t make silver rally above that level.
On the above chart, you can see how silver first topped in 2011, then declined and formed another top at the cyclical turning point. Next, it declined once again – to the previous lows. After that, silver rallied (in 2012 and 2022), and it topped between its 50-week moving average (marked in blue) and the previous top. Now silver is declining in a back-and-forth manner (you can see it more clearly on the previous short-term silver chart).
Back in 2012, these were just the early days of a gargantuan decline, and the same appears likely to be the case this time. Interest rates are going up after all, and the Fed is determined to quench inflation.
Let’s not forget that rising interest rates are likely to negatively impact not just commodities, but practically all industries. This will likely cause silver’s price to decline profoundly, as silver’s industrial demand could be negatively impacted by lower economic growth (or a decline in economic activity).
Besides, please note that silver didn’t even manage to rally as much as copper (which tried to move to new highs recently) or most other commodities, thus being rather weak.
Consequently, it seems that silver will need to decline profoundly before it rallies (to new all-time highs) once again.
Having said that, let’s take a look at what happened in junior mining stocks.
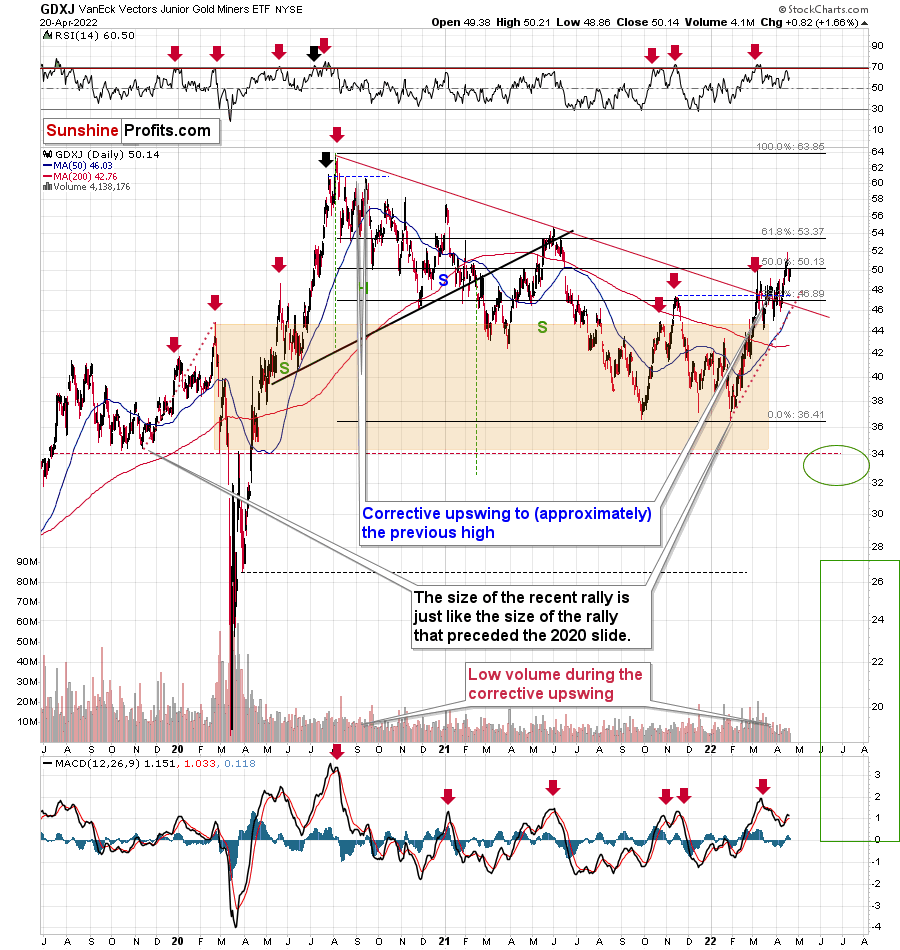
In short, they are now lower than they were 7 days ago, even though the change in trend is not yet apparent based on the above chart.
The GDXJ ETF closed the day just one cent above its 50% retracement based on its 2020-2022 decline. This move is not confirmed, and given the current volume readings, it’s very doubtful that it will be confirmed. Especially since the very recent attempt to break higher was invalidated as well.
Also, let’s not forget about the forest while looking at individual trees. By that, I mean looking at how gold stocks perform relative to gold. That’s one of the major indications that the current situation is just like what we saw at the 2012 top. In other words, my last week's comments on the chart below remain up-to-date.
Gold stocks (GDX, GDXJ, and HUI Index) have recently been quite strong relative to gold. OK, but is this necessarily bullish? It might be, until one considers the fact that we saw the same thing at the 2012 top! This changes everything, and it does so, because the links between now and that top are almost everywhere: in gold, in silver, in gold stocks, and even in their ratios.
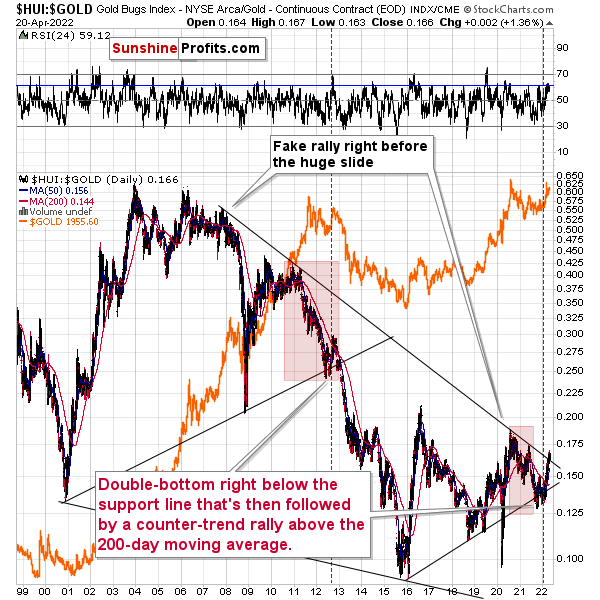
As it turns out, the gold stocks to gold ratio is behaving almost identically as it was behaving at the 2012 top in the precious metals sector.
In both cases, the ratio moved below the rising medium-term support line, then formed a double-bottom below the line, and invalidated the breakdown, which resulted in a counter-trend rally. The rally ended shortly after the ratio moved above its 200-day moving average (marked in red). That’s what happened recently. What happened next in 2012? The decline not only continued – it accelerated!
Consequently, the recent action in the ratio is not really bullish. In other words, the fact that gold stocks were recently (in the short run only) strong relative to gold doesn’t make the medium-term outlook for the precious metals sector bullish. However, it remains bearish.
Interestingly, the ratio itself moved to its declining resistance line (and it even moved slightly above it, but the move is too small to be viewed as reliable yet), indicating that the corrective upswing might already be over or almost over. We get the same indication from the RSI indicator. It’s not above 70, but in the case of most local tops, the RSI didn’t have to move above 70. It just moved to more or less the same levels – I marked it with a horizontal blue line.
The above is actually a confirmation of the analogy that is visible directly in all three key components of the precious metals sector: gold, silver, and mining stocks.
I already discussed the ones in gold and silver, so let’s take a look at the analogy in the HUI Index – a proxy for gold stocks.
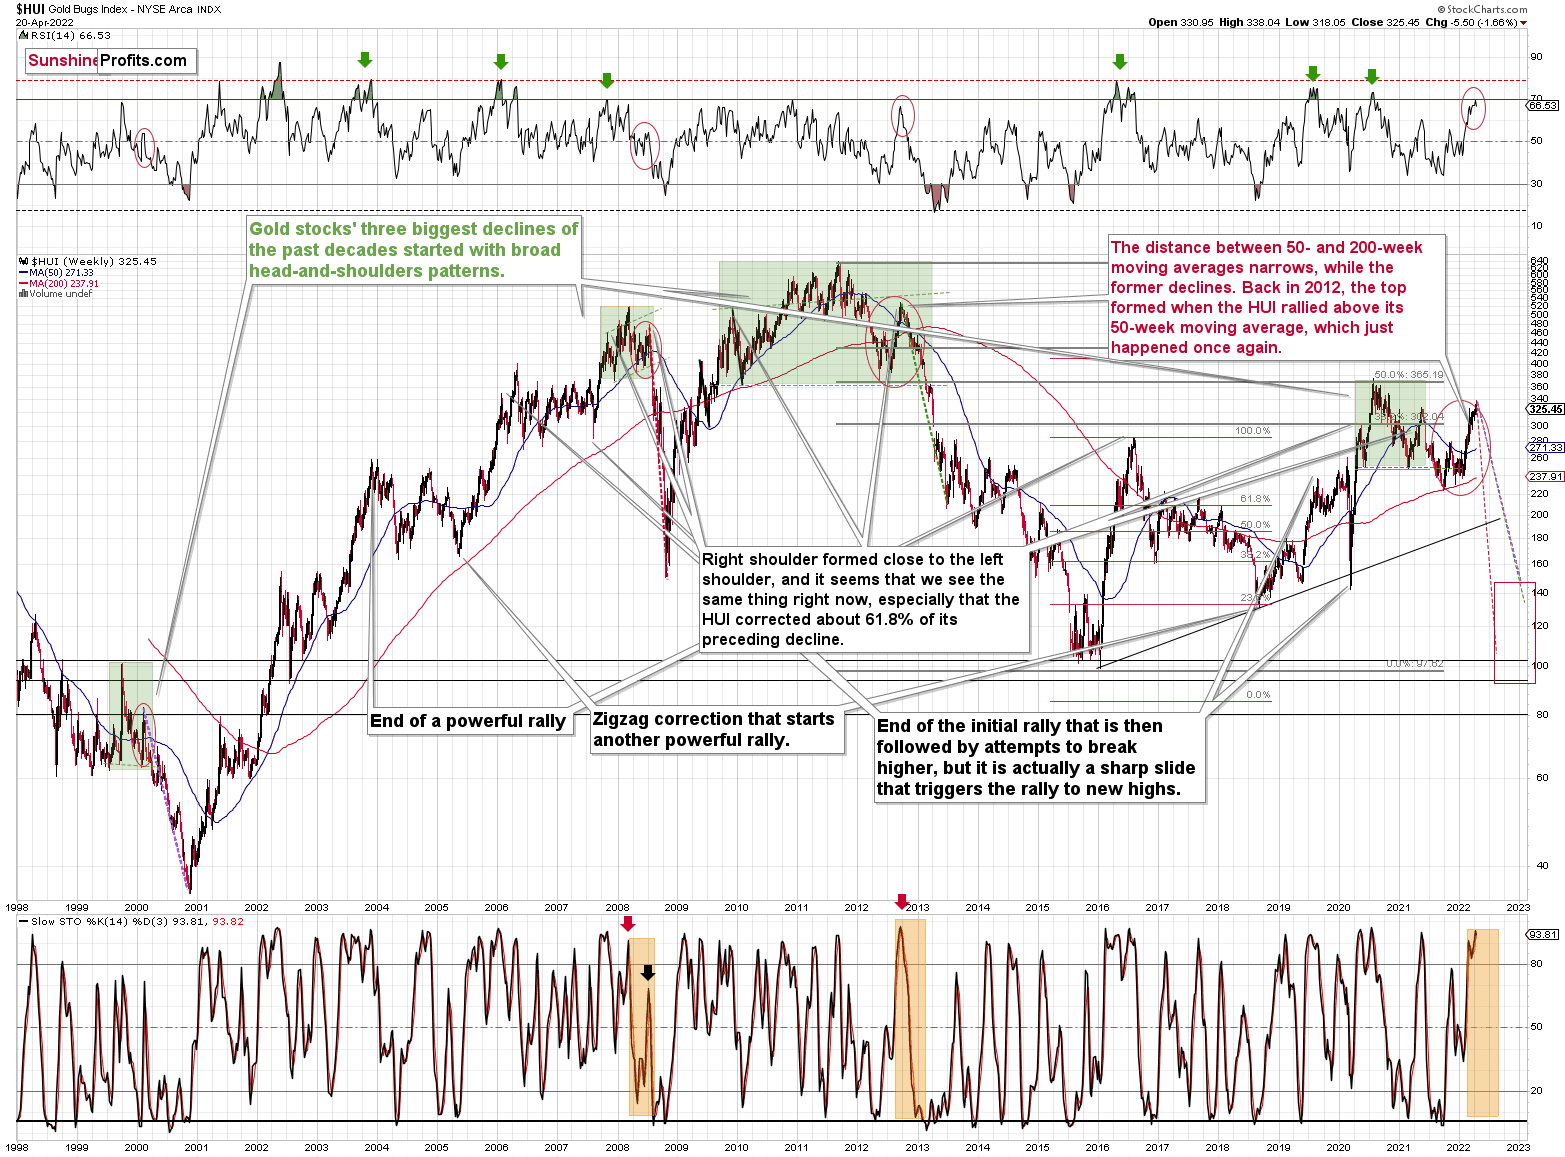
If you look at the areas marked with red circles (especially now, 2012/2013, and 2008), you’ll notice that they are very similar. These are the sizable short-term rallies that we saw after / in the final parts of the broad head-and-shoulders patterns.
The moves were quite sizable – the 2012 rally was even bigger than the current one, even though there was no war in Europe at that time.
Based on how broad the pattern is and the self-similarity present in gold, it seems that the analogy to what happened in 2012 is most important right now.
Looking at the moving averages, we see that the 50-week moving average (blue) and 200-week moving average (red) performed quite specifically in late 2012, and we see the same thing this year.
The distance between 50- and 200-week moving averages is currently narrowing, while the former is declining. Back in 2012, the top formed when the HUI rallied above its 50-week moving average, which just happened once again.
The RSI indicator (above the price chart), based on the HUI Index’s weekly chart, provides us with another confirmation of the analogy, and the same goes for the stochastic indicator (below the price chart). The former is just below the 70 level – exactly what we saw at the 2012 top, and the latter is above 90 – again, something that we saw at the 2012 top.
As history tends to rhyme, gold stocks are likely to slide, similarly to how they declined in 2012 and 2013.
Still, if the general stock market slides, and that appears likely for the following weeks and months, then we might have a decline that’s actually similar to what happened in 2008. Back then, gold stocks declined profoundly, and they have done so very quickly.
The dashed lines that start from the recent prices are copy-paste versions of the previous declines that started from the final medium-term tops. If the decline is as sharp and as big as what we saw in 2008, gold stocks would be likely to decline sharply, approximately to their 2016 low. If the decline is more moderate, then they could decline “only” to 120-150 or so. Either way, the implications are very, very, very bearish for the following weeks.
Also, we saw a fresh sell signal from the weekly stochastic indicator, which (unlike its 4-hour version) is quite efficient. This is a very bearish development for the medium term. After all, the last two times we saw this signal, were at the 2021 and 2020 tops.
Let’s take a brief look at the stock market indices.
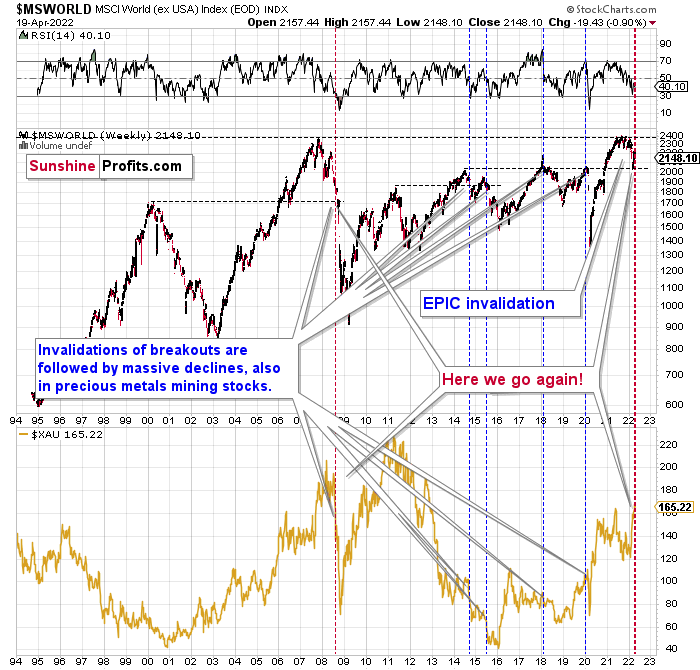
The technical picture in the case of world stocks remains extremely bearish, and my previous comments on it remain up-to-date:
World stocks have already begun their decline, and based on the analogy to the previous invalidations, the decline is not likely to be small. In fact, it’s likely to be huge.
For context, I explained the ominous implications on Nov. 30. I wrote:
Something truly epic is happening in this chart. Namely, world stocks tried to soar above their 2007 high, they managed to do so and… they failed to hold the ground. Despite a few attempts, the breakout was invalidated. Given that there were a few attempts and that the previous high was the all-time high (so it doesn’t get more important than that), the invalidation is a truly critical development.
It's a strong sell signal for the medium- and quite possibly for the long term.
From our – precious metals investors’ and traders’ – point of view, this is also of critical importance. All previous important invalidations of breakouts in world stocks were followed by massive declines in mining stocks (represented by the XAU Index).
Two of the four similar cases are the 2008 and 2020 declines. In all cases, the declines were huge, and the only reason why they appear “moderate” in the lower part of the above chart is that it has a “linear” and not a “logarithmic” scale. You probably still remember how significant and painful (if you were long, that is) the decline at the beginning of 2020 was.
Now, all those invalidations triggered big declines in the mining stocks, and we have “the mother of all stock market invalidations” at the moment, so the implications are not only bearish, but extremely bearish.
What does it mean? It means that it is time to get out of the short position in mining stocks to get a few extra dollars from immediate-term trades that might be risky. The possibility that the omicron variant of COVID makes vaccination ineffective is too great to be ignored as well. If that happens, we might see 2020 all over again – to some extent. In this environment, it looks like the situation is “pennies to the upside and dollars to the downside” for mining stocks. Perhaps tens of dollars to the downside… You have been warned.
World stocks have declined to their previous highs, and when something similar happened in 2008, it meant that both stocks and gold and silver mining stocks (lower part of the chart) were about to slide much further. In particular, that’s when the corrective upswing in the miners ended and the huge slide started. The implications for mining stocks are extremely bearish.
Let’s take a look at the U.S. stock market.
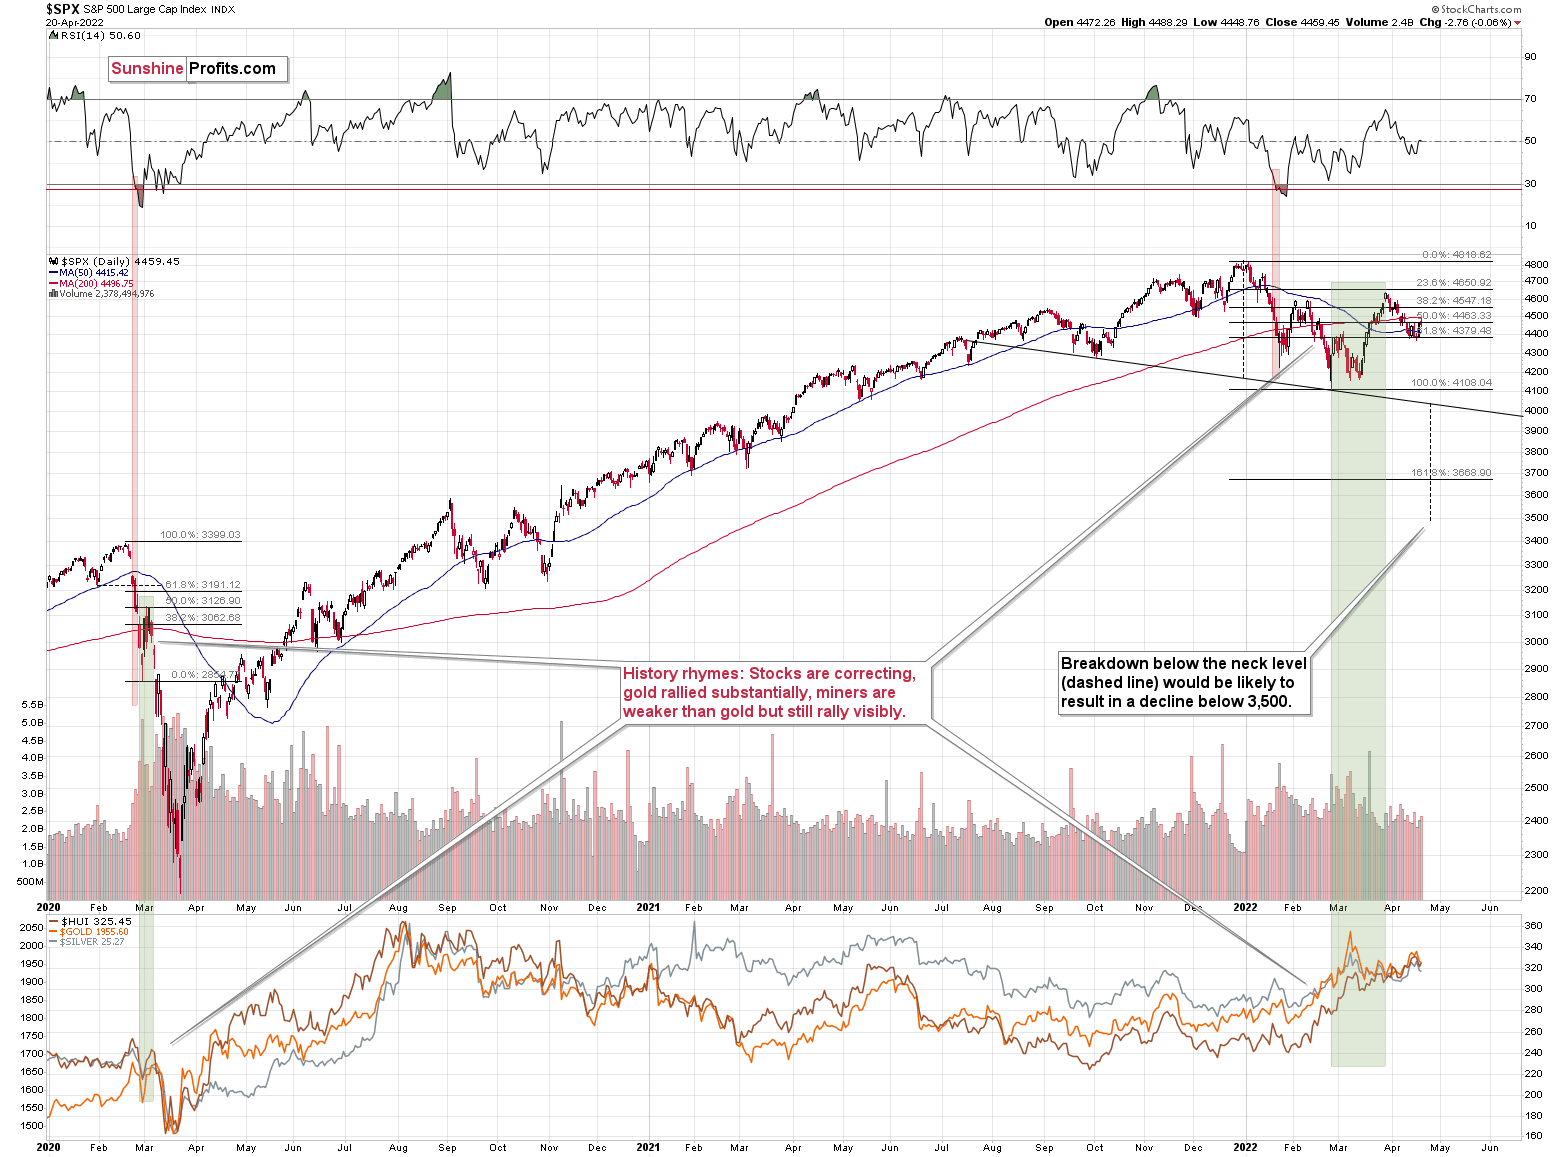
On March 30 (and the following days), I wrote about the above chart:
The S&P 500 rose yesterday and even managed to move above its February highs. At first sight, this appears bullish, but is it really so? Given that the riskiest stocks rallied the most, not necessarily.
Besides, stocks closed below the final of their regular Fibonacci ratios – the less known, but still important 76.4%, so they might reverse as early as today, once this resistance is reached. If that happens and the – unconfirmed (!) – breakout above the February/late-January highs is invalidated, we’ll have a strong sell signal.
While stocks rallied and the investing public (probably) entered the market, they might have also moved other assets that have been performing poorly recently. By “other assets”, I mean mining stocks. Yes, they rallied along with gold, but they were weak relative to it. Gold moved to its previous all-time high recently, and junior miners were able to rally just above their late-2021 high. They are now below this high, anyway.
Stocks just failed to break above the February high, and this invalidation is a strong sell signal for the near term. The decline in stocks is likely to have a particularly bearish effect on junior mining stocks.
Stocks have not yet declined significantly below the previous lows, but it seems that they are on the verge of doing so (the rates are rising and they are about to rise much more based on the fact that inflation has gotten very political). If 2020 could teach us anything, it would be that the following slide could be huge and sharp.
The volatility won’t necessarily match the 2020 one, but the decline is likely to be significant, anyway.
Let’s keep in mind that interest rates are likely to go higher, and that sanctions on Russia could impact global trade in multiple ways, thus negatively affecting the stock market.
This would be likely to have a very negative impact on the precious metals market, in particular on junior mining stocks (initially) and silver (a bit later).
Having said that, let’s take a look at the USD Index as it’s been breaking to new yearly highs recently.
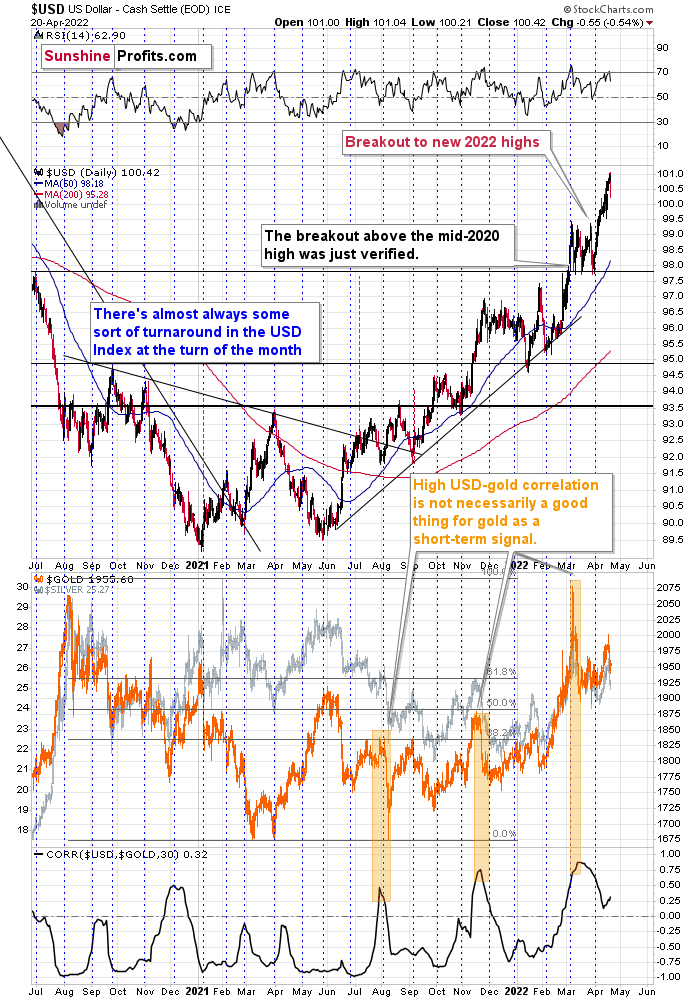
In my previous analyses, I commented on the USD Index in the following way:
If we focus on the USD Index alone, we’ll see that yesterday’s decline was absolutely inconsequential with regard to changing the outlook for the USDX. It simply continues to consolidate after a breakout above the mid-2020 highs. Breakout + consolidation = increasing chances of rallies’ continuation. A big wave up in the USD Index is likely just around the corner, and the precious metal sector is likely to decline when it materializes.
As the war-based premiums in gold and the USD appear to be waning, a high-interest-rate-driven rally in the USD is likely to trigger declines in gold. The correlation between these two assets has started to decline. When that happened during the last two cases (marked with orange), gold plummeted profoundly shortly thereafter.
The USD Index had rallied recently, but it declined yesterday. This daily decline didn’t change anything, though, as it’s been often the case that the USDX corrects to (approximately) its previous highs before moving higher once again.
This is particularly the case since the medium-term picture for the USD Index is very favorable, too.
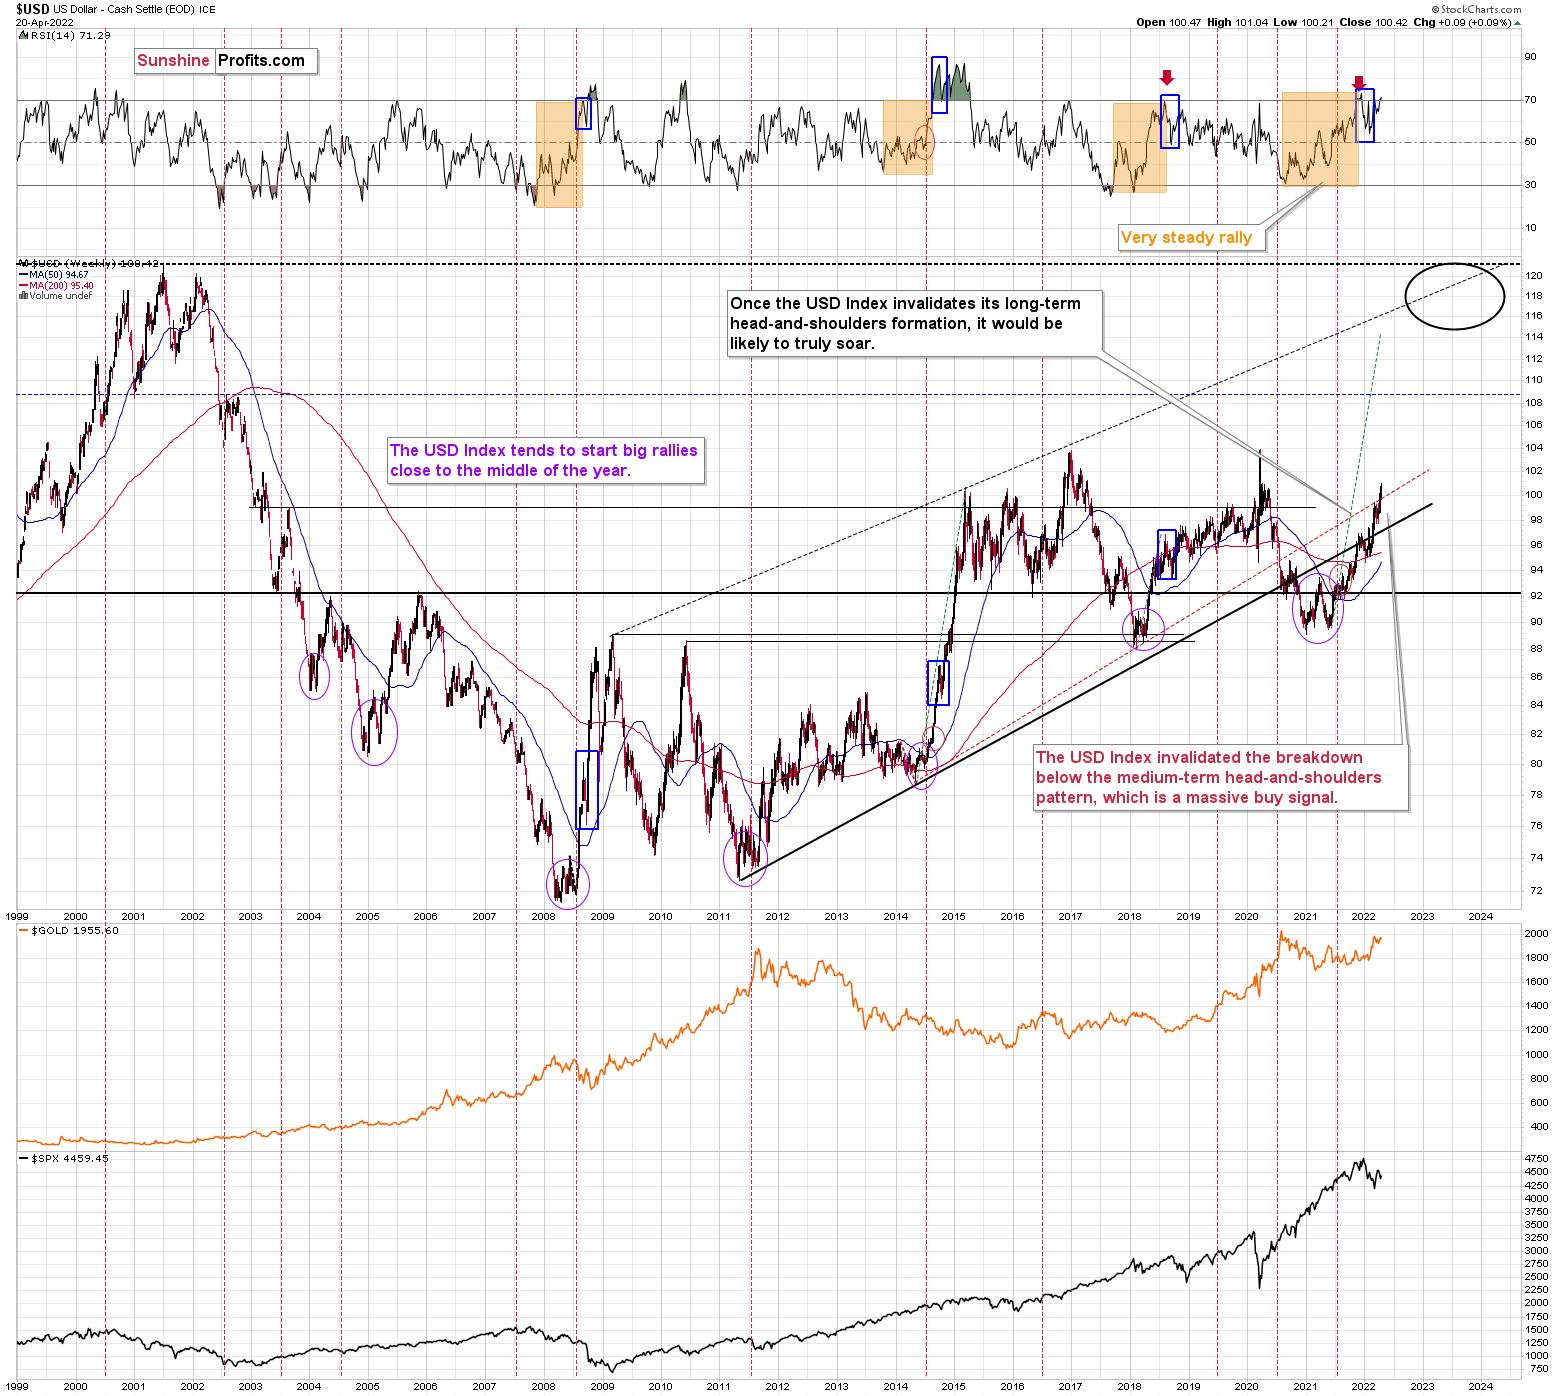
The USD Index recently invalidated the breakdowns below the neck level of its long-term head-and-shoulders formation. This formation didn’t fit the USD’s very long-term chart, so I didn’t think that it would really result in much lower USD prices. Indeed, instead of big declines, we saw a relatively small (from the long-term point of view) move lower – from 94 in 2020 to about 89 in the final part of that year, but then a powerful rally started, and it took the USD Index much, much higher.
The thing is that the USDX rallied well above the neck level, thus not only nullifying the bearish implications of the formation, but actually creating a powerful buy signal. Invalidations of patterns have the opposite effect of what the pattern would have if held. In this case, the implications are bullish.
Now, one could draw the neck level of the pattern in two ways, depending on what bottoms one decides to use. One of them is in black (a thick line) and one of them is in red (a dashed line). The point is that the USD Index invalidated breakdowns below both those lines. Therefore, it’s clear that the bullish implications are present.
Let’s check when the previous times were when the USD Index was about to rally profoundly. The three cases that are most visible on the above chart are mid-2008, mid-2011, and mid-2014. In all those cases, it was right before a major decline in the price of gold.
Yes, we still have some war-concern-based premium in the price of gold, but as the situation stabilizes or at least the tensions don’t increase further (and that’s very unlikely as they are very high right now), gold is likely to react to the things that it’s usually reacting to: the USD Index and real interest rates. The former is very likely to go up and… so does the latter. Therefore, gold, silver, and mining stocks are likely to move lower in the following weeks and months, even though it might not look this way based on the day-to-day price swings.
All in all, technicals favor a decline in the precious metals sector sooner rather than later.
Overview of the Upcoming Part of the Decline
- It seems to me that the corrective upswing is now over or very close to being over , and that gold, silver, and mining stocks are now likely to continue their medium-term decline.
- It seems that the first (bigger) stop for gold will be close to its previous 2021 lows, slightly below $1,800 . Then it will likely correct a bit, but it’s unclear if I want to exit or reverse the current short position based on that – it depends on the number and the nature of the bullish indications that we get at that time.
- After the above-mentioned correction, we’re likely to see a powerful slide, perhaps close to the 2020 low ($1,450 - $1,500).
- If we see a situation where miners slide in a meaningful and volatile way while silver doesn’t (it just declines moderately), I plan to – once again – switch from short positions in miners to short positions in silver. At this time, it’s too early to say at what price levels this could take place, and if we get this kind of opportunity at all – perhaps with gold close to $1,600.
- I plan to exit all remaining short positions once gold shows substantial strength relative to the USD Index while the latter is still rallying. This may be the case with gold close to $1,350 - $1,400. I expect silver to fall the hardest in the final part of the move. This moment (when gold performs very strongly against the rallying USD and miners are strong relative to gold after its substantial decline) is likely to be the best entry point for long-term investments, in my view. This can also happen with gold close to $1,375, but at the moment it’s too early to say with certainty.
- As a confirmation for the above, I will use the (upcoming or perhaps we have already seen it?) top in the general stock market as the starting point for the three-month countdown. The reason is that after the 1929 top, gold miners declined for about three months after the general stock market started to slide. We also saw some confirmations of this theory based on the analogy to 2008. All in all, the precious metals sector is likely to bottom about three months after the general stock market tops.
- The above is based on the information available today, and it might change in the following days/weeks.
You will find my general overview of the outlook for gold on the chart below:
Please note that the above timing details are relatively broad and “for general overview only” – so that you know more or less what I think and how volatile I think the moves are likely to be – on an approximate basis. These time targets are not binding or clear enough for me to think that they should be used for purchasing options, warrants or similar instruments.
Summary
Summing up, despite the recent rally in gold, the outlook for junior mining stocks remains exactly as I described previously.
Investing and trading are difficult. If it was easy, most people would be making money – and they’re not. Right now, it’s most difficult to ignore the urge to trade along with the crowd that’s ignoring two critical factors:
- rising real interest rates,
- rising USD Index values.
Both of the aforementioned are the two most important fundamental drivers of the gold price. Since neither the USD Index nor real interest rates are likely to stop rising anytime soon (especially now that inflation has become highly political), the gold price is likely to fall sooner or later. Given the analogy to 2012 in gold, silver, and mining stocks, “sooner” is the more likely outcome.
It seems that our profits from short positions are going to become truly epic in the coming months.
Moreover, let’s keep in mind that we are not patient with this trade to just get out of it close to being even or with a reasonable (10%-30%) profit. Of course, I can’t promise anything, but this entire short trade is likely to end with gold below $1,500 and junior miners close to or below their 2020 lows. The upside potential for the inversely trading instruments is likely enormous. Yes, we might adjust the trade or exit it temporarily, only to get back to it shortly thereafter, but the overall potential remains gargantuan. It’s quite likely that none of those gains will be reaped by precious metals perma-bulls.
After the sell-off (that takes gold to about $1,350-$1,500), I expect the precious metals to rally significantly. The final part of the decline might take as little as 1-5 weeks, so it's important to stay alert to any changes.
As always, we'll keep you – our subscribers – informed.
To summarize:
Short-term outlook for the precious metals sector (our opinion on the next 1-6 weeks): Bearish
Medium-term outlook for the precious metals sector (our opinion for the period between 1.5 and 6 months): Bearish initially, then possibly Bullish
Long-term outlook for the precious metals sector (our opinion for the period between 6 and 24 months from now): Bullish
Very long-term outlook for the precious metals sector (our opinion for the period starting 2 years from now): Bullish
As a reminder, Gold Investment Updates are posted approximately once per week. We are usually posting them on Monday, but we can’t promise that it will be the case each week.
Our preferred ways to invest in and to trade gold along with the reasoning can be found in the how to buy gold section. Additionally, our preferred ETFs and ETNs can be found in our Gold & Silver ETF Ranking.
Moreover, Gold & Silver Trading Alerts are posted before or on each trading day (we usually post them before the opening bell, but we don’t promise doing that each day). If there’s anything urgent, we will send you an additional small alert before posting the main one.
Thank you.
Przemyslaw Radomski, CFA
Founder, Editor-in-chief

