

Briefly: gold and the rest of the precious metals market are likely to decline in the next several weeks/months and then start another powerful rally. Gold’s strong bullish reversal/rally despite the USD Index’s continuous strength will likely be the signal confirming that the bottom is in.
Welcome to this week's flagship Gold & Silver Trading Alert. Predicated on last week’s price moves, our most recently featured outlook remains the same as the price moves align with our expectations. On that account, there are parts of the previous analysis that didn’t change at all in the earlier days, which will be written in italics.
The key thing that we saw this week is a sharp rally that’s likely based on the (in my view, unfounded) expectations of a Fed’s dovish U-turn. Some geopolitical events likely had an impact on the markets too, but as it’s usually the case, these events are likely to have an impact of only a temporary nature.
Let’s start today’s analysis with a recap of what recently happened on the fundamental front.
The Weekly Fundamental Roundup
With hope overpowering reality, this week was all about investors attempting to create an unrealistic outcome. Moreover, with pivot prayers uplifting the PMs, optimism reigned as the false narrative gained steam.
However, while gold, silver and mining stocks outperformed the S&P 500 on Oct. 6, the hawkish realities that spooked the stock market should upend the PMs in the weeks and months ahead. For example, whether it was Brainard, Daly, Mester, Barkin, Kashkari, Williams, Jefferson, or Bostic, Fed officials were adamant that the U.S. federal funds rate (FFR) must move materially higher to curb inflation.
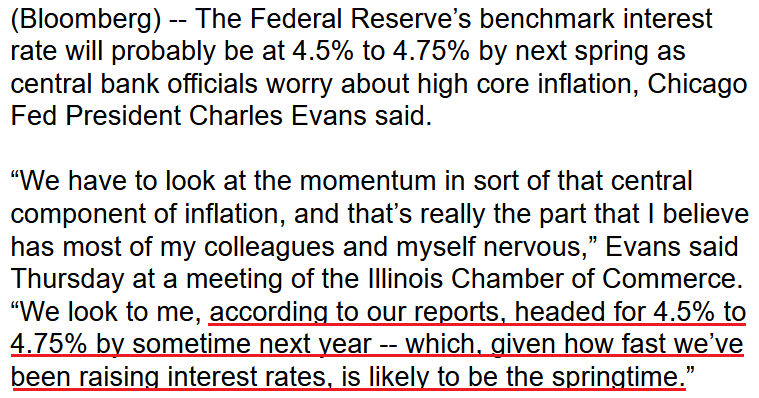
Likewise, with more voices joining the fray on Oct. 6, the chorus continues to grow louder. Chicago Fed President Charles Evans said:
“We have further to go” on rate hikes and “we need a more restrictive setting of monetary policy.” He added, “Inflation is very high right now and that’s the issue that’s top of mind for the Federal Reserve and everyone.”
As a result, while the crowd hopes that inflation will magically disappear and the Fed can pivot, the reality is that the FFR is far from its peak.
Please see below:
 Source: Bloomberg
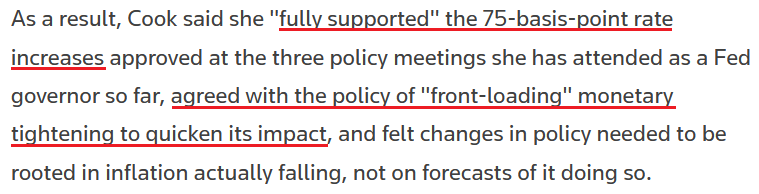
In addition, Fed Governor Lisa Cook said on Oct. 6:
Inflation “remains stubbornly and unacceptably high, and data over the past few months show that inflationary pressures remain broad-based (...). It must come down and we will keep at it until the job is done.”
She added:
“Although lowering inflation will bring some pain, a failure to restore price stability would make it much harder and much more painful to restore it in the future. In the current situation, with risks to inflation forecasts skewed to the upside, I believe policy judgments must be based on whether and when we see inflation actually falling in the data, rather than just in forecasts.”
As such, Fed officials want to see a compelling decline in the Consumer Price Index (CPI) before a pivot is considered.
Please see below:
 Source: Reuters
Thus, while the PMs ignored the implications on Oct. 6, the U.S. 10-Year real yield and the USD Index rallied once again; and with the PMs’ main fundamental adversaries poised to hit higher highs in the months ahead, gold, silver, and mining stocks are unlikely to gain any real traction until they decelerate.
Please see below:
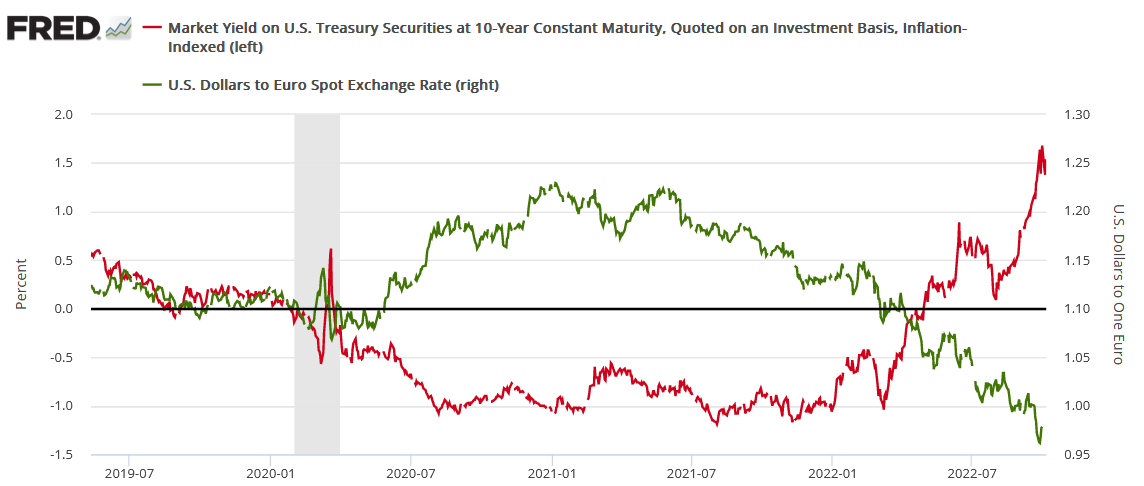
To explain, the red line above tracks the U.S. 10-Year real yield, while the green line above tracks the EUR/USD. For context, the currency pair accounts for nearly 58% of the USD Index’s movement.
If you analyze the relationship, you can see that a higher U.S. 10-Year real yield often coincides with a weaker EUR/USD. Therefore, the U.S. 10-Year real yield and the USD Index often follow in each other’s footsteps, and the Fed’s inflation fight should continue to push them higher.
As further evidence, the U.S. 10-Year real yield often peaks alongside the FFR (or near it). As a result, with the Fed poised to raise the FFR by at least another 1.25% (to reach 4.5%), the U.S. 10-Year real yield should have more room to run, which is bullish for the USD Index.
Please see below:
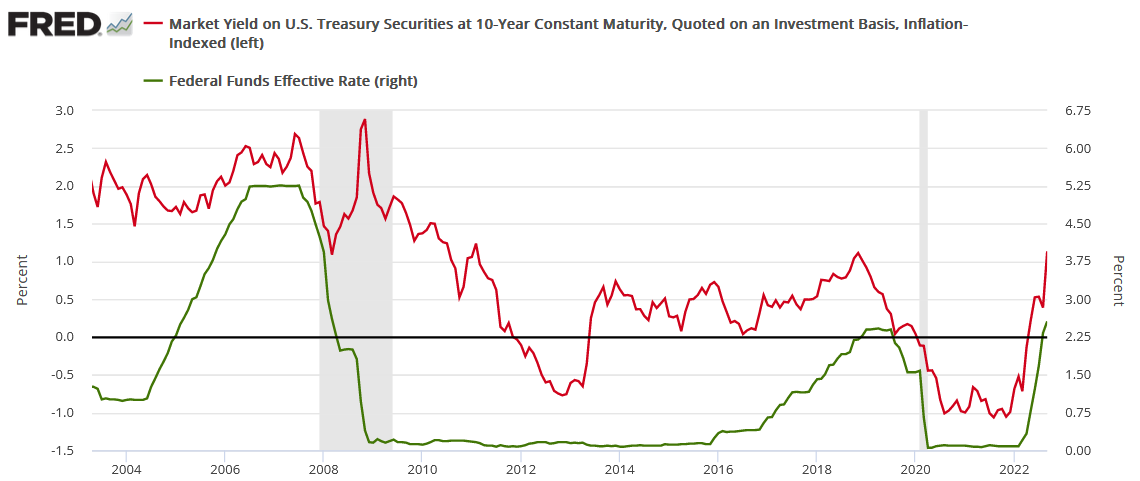
To explain, the red line above tracks the U.S. 10-Year real yield, while the green line above tracks the FFR. As you can see, a higher FFR supports higher real interest rates. Also, when the FFR hit ~4.5% in February 2006, the U.S. 10-Year real yield reached a monthly high of 2.14%, and it occurred with a YoY CPI at roughly half the current rate.
So, with the latter ending the Oct. 6 session at 1.54%, there is still plenty of potential upside over the medium term. As such, the outlook is bullish for the U.S. 10-Year real yield and the USD Index, and the PMs should suffer as interest rates normalize to more appropriate levels.
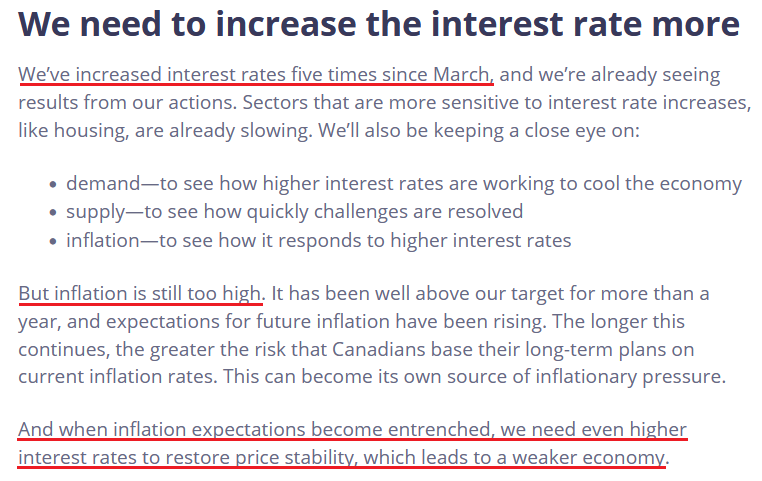
To that point, I warned on Apr. 14 that the Bank of Canada (BoC) was the hawkish canary in the coal mine. Remember, due to their geographical proximity and the fact that 75% or more of Canadian exports are sent to the U.S., the two regions often have similar economic and monetary policy outcomes. I wrote:
The BoC announced a 50 basis point rate hike on Apr. 13. With the Fed likely to follow suit in May, the domestic fundamental environment confronting the PMs couldn’t be more bearish.
Moreover, BoC Governor Tiff Macklem (Canada's Jerome Powell) said that "We are committed to using our policy interest rate to return inflation to target and will do so forcefully if needed."
Furthermore, while he added that the BoC could "pause our tightening" if inflation subsides, he cautioned that "we may need to take rates modestly above neutral for a period to bring demand and supply back into balance and inflation back to target."
However, with the latter much more likely than the former, the BoC's decision is likely a preview of what the Fed should deliver in the months ahead.
Thus, with the BoC and the Fed both increasing their overnight lending rates dramatically in recent months, the correlation continues to hold. Likewise, with BoC Governor Tiff Macklem amplifying his hawkish message on Oct. 6, the BoC and the Fed should continue their connection over the medium term. Macklem said:
“Inflation in Canada peaked at 8.1% in June and has declined for two months. That’s welcome news, but inflation will not fade away by itself. To get it back to more normal levels, we need to slow spending in the economy so supply can catch up with demand (…).
“All the signs today point to an economy that is clearly in excess demand. Labor markets remain very tight. Job vacancies have eased a little in recent months but remain exceptionally high. Our business surveys report widespread labor shortages; and wage growth has risen and continues to broaden.”
As a result:
“We know we are still a long way from the 2% target. We know it will take some time to get there. We also know there could be setbacks along the way, and we can’t afford to let high inflation become entrenched (…). The clear implication is that further interest rate increases are warranted. Simply put, there is more to be done.”
Therefore, while I warned that letting inflation rage was not an option, North American central banks are committed to raising interest rates, and the trend is profoundly bearish for gold, silver, and mining stocks.
 Source: BoC
Mixed Jobs Data
With ADP’s private payrolls outperforming expectations and the Institute for Supply Management (ISM) and S&P Global’s PMIs showing healthy job creation, the U.S. labor market remains on solid footing. Moreover, the resiliency should embolden the Fed to continue its rate hike cycle.
However, Challenger, Gray & Christmas Inc. released its job cuts report on Oct. 6, and the findings were relatively less bullish. An excerpt read:
“U.S.-based employers announced 29,989 cuts in September, a 46.4% increase from the 20,485 cuts announced in August. It is 67.6% higher than the 17,898 cuts announced in the same month last year.”
Please see below:
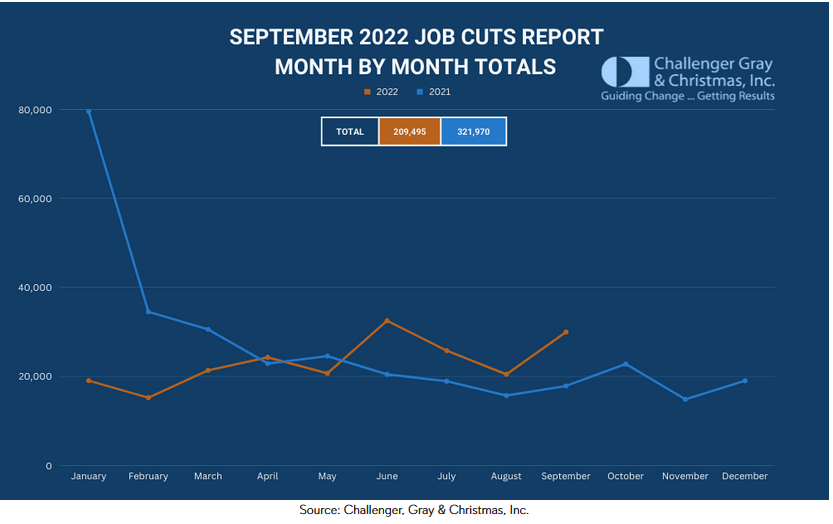
However, the report also stated:
“In the third quarter, employers announced 76,284 job cuts, down 1.6% from the 77,515 cuts announced in the previous quarter (…). So far this year, employers announced plans to cut 209,495 jobs, down 21% from the 265,221 cuts announced in the first nine months of 2021. It is the lowest recorded January-September total since Challenger began tracking monthly job cut announcements in 1993.”
As such, while the month-over-month (MoM) results were weak, the three and nine-month results were strong. Therefore, while rampant layoffs support an eventual dovish pivot, one month doesn’t make a trend, and other data points signal a resilient U.S. labor market.
The Bottom Line
While gold, silver, and mining stocks remained relatively uplifted on Oct. 6, risk assets face an uphill battle over the medium term as interest rates rise and liquidity evaporates. However, with U.S. nonfarm payrolls released today, short-term volatility could be amplified, as a strong or weak print will likely impact rate hike expectations. Either way, the PMs’ technical and fundamental outlooks remain bearish, and more downside should confront the trio during the fall and winter months.
In conclusion, the PMs rallied on Oct. 6, though gold ended the day flat. However, with the U.S. 10-Year real yield and the USD Index continuing their ascents, it’s likely only a matter of time until the PMs notice. As a result, we believe that shorting the GDXJ ETF still offers a solid risk-reward proposition.
What to Watch for Next Week
With more U.S. economic data releases next week, the most important are as follows:
- Oct. 11: NFIB Small Business Optimism Index
Since the NFIB’s data provides key insights into small businesses’ growth, inflation, and employment outlooks, the results are material.
- Oct. 12: Producer Price Index (PPI)
With input prices often leading output prices, the PPI is a meaningful gauge of commodity inflation.
- Oct. 13: Consumer Price Index (CPI)
Like every month, the CPI is highly anticipated, as investors wager their pivot bets on the results. However, the medium-term path is more important than any one print, so while the release should move markets, it’s largely overhyped.
- Oct. 14: U.S. retail sales
With consumer spending a significant driver of inflation, Americans’ shopping habits will help determine when the FFR peaks and a pivot ensues.
All in all, economic data releases impact the PMs because they impact monetary policy. Moreover, if we continue to see higher employment and inflation, the Fed should keep its foot on the hawkish accelerator. If that occurs, the outcome is profoundly bearish for the PMs.
Technically Speaking
Let’s start today’s technical discussion with a quick check on copper prices.
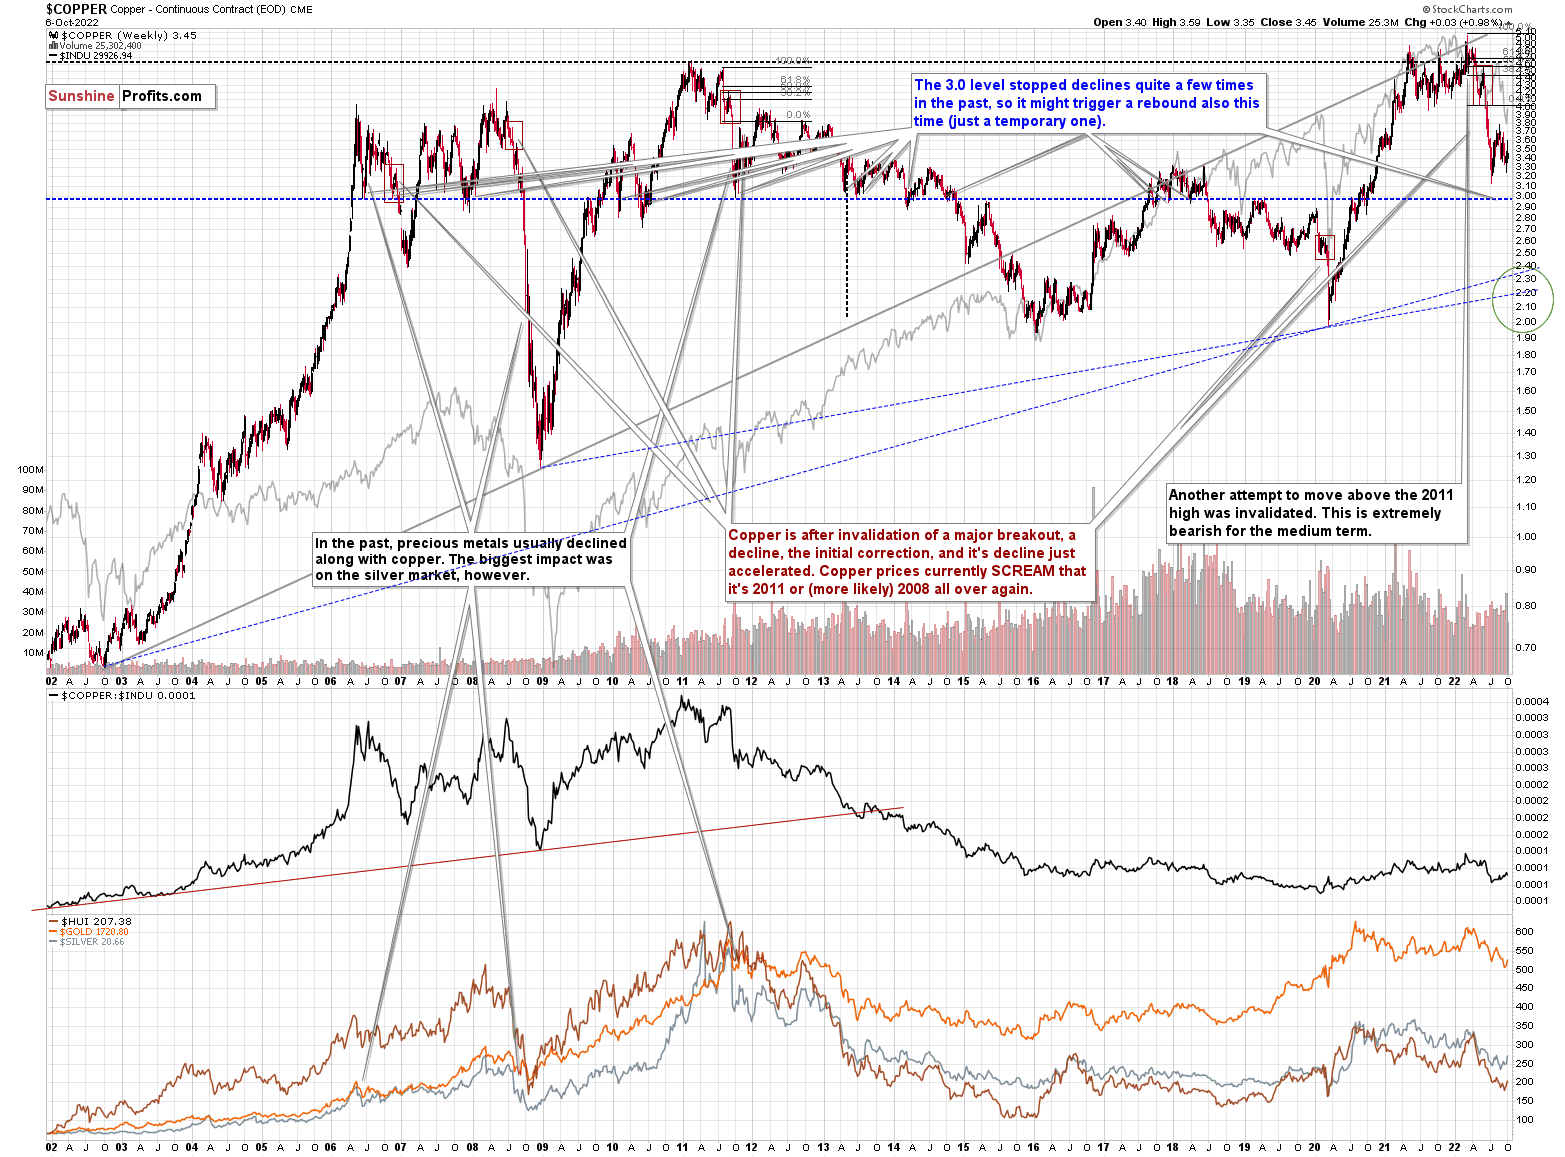
Practically, everything that I wrote about it last week (and in the previous weeks/months) remains up-to-date:
Copper recently CLEARLY invalidated another attempt to move above its 2011 high. This is a very strong technical sign that copper (one of the most popular commodities) is heading lower in the medium term.
It seems to me that there might be some kind of smaller corrective upswing or a pause when copper moves to about $3.0, but that it would then decline profoundly once again, only to bottom in the $2.0-2.4 area. That’s where we have rising, long-term support lines and also the previous – 2016 and 2020 – lows.
Interest rates are going up, just like they did before the 2008 slide. What did copper do before the 2008 slide? It failed to break above the previous (2006) high, and it was the failure of the second attempt to break higher that triggered the powerful decline. What happened then? Gold declined, but silver and mining stocks truly plunged.
Again, copper is after invalidation of a major breakout, a decline, the initial correction, and its decline just accelerated. Copper prices currently SCREAM that it’s 2011 or (more likely) 2008 all over again. This is extremely bearish for mining stocks (especially juniors) and silver.
No market moves in a straight line, up or down, but since we just saw a corrective upswing, the downtrend might now resume.
Based on the recent short-term move lower, it seems that the downtrend has already resumed. This and last week’s rebounds are barely visible from the long-term point of view, and it doesn’t change anything.
Having said that, let’s check junior miners’ really big picture.
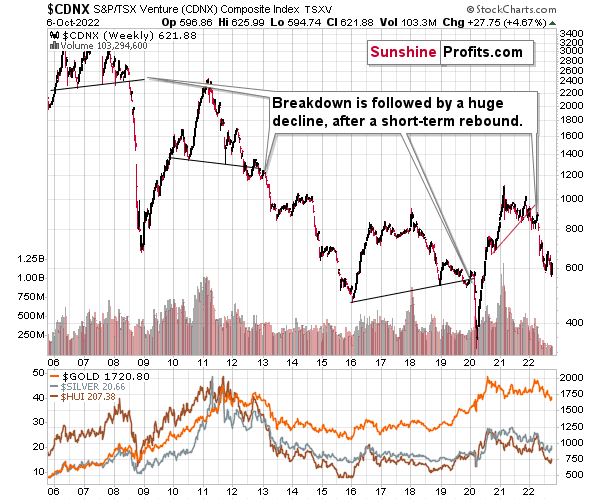
I previously commented on the above chart in the following way:
The Toronto Stock Exchange Venture Index includes multiple junior mining stocks. It also includes other companies, but juniors are a large part of it, and they truly plunged in 2008.
In fact, they plunged in a major way after breaking below their medium-term support lines and after an initial corrective upswing. Guess what – this index is after a major medium-term breakdown and a short-term corrective upswing. It’s likely ready to fall – and to fall hard.
So, what’s likely to happen? We’re about to see a huge slide, even if we don’t see it within the next few days.
Having said that, let’s turn to gold.
Let’s start with context:
Between 2020 and now, quite a lot happened, quite a lot of money was printed, and we saw a war breaking out in Europe. Yet, gold failed to rally to new highs.
In fact, it’s trading very close to its 2011 high, which tells you something about the strength of this market. It’s almost absent.
Truth be told, what we see in gold is quite in tune with what we saw after the 2011 top, and in particular, shortly after the 2012 top. The long-term gold price chart below provides details.
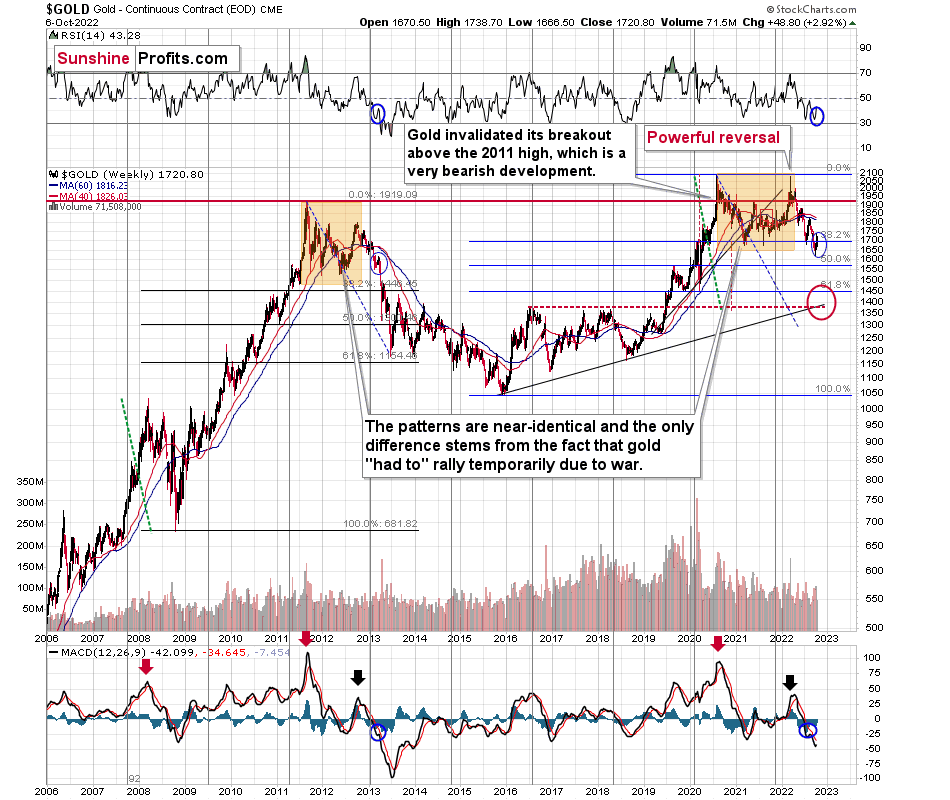
Basically, the key thing about gold’s long-term chart is that it doesn’t show any important changes. The downtrend continues in tune with the 2013 price action, and the very recent rally is barely visible.
To clarify, it is visible, but what’s visible is still in tune with the final attempt for gold to rally in April 2013, right before the biggest part of the slide.
Gold is sometimes forced to react to some geo-political events as the safe-haven buying kicks in, but these moves are usually short-term lived. Looking at long-term charts helps to keep things in proper perspective.
Consequently, my previous comments remain up-to-date:
Based on the above chart, it’s quite clear that the situation that is now being repeated. The patterns marked with orange rectangles and blue ellipses are almost identical (also in the MACD indicator, and to a lesser extent in the RSI indicator).
Sure, the situations are not identical, as this time we had a Russian invasion of Ukraine that pushed gold temporarily higher. Other than that, the situations are extremely similar.
Based on the stage of the self-similarity and the confirmed breakdown below the $1,700 level, gold is now likely to slide.
Based on the analogy to 2013, it’s not only likely to slide, it’s likely to slide profoundly in a sharp manner. These may be the last days or hours before the slide fully begins.
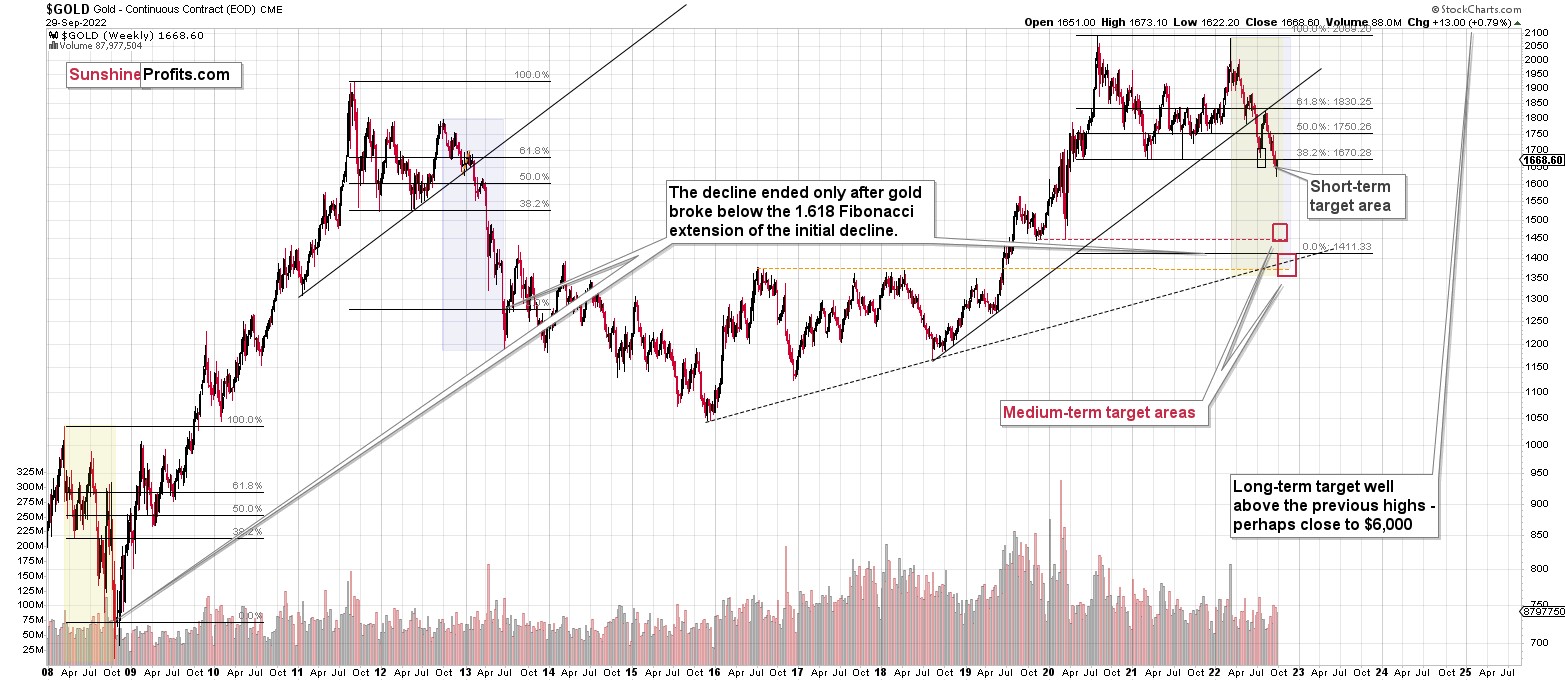
How low is gold likely to go during this upcoming decline? Perhaps as low as its 2020 low – to the $1,450-1,500 area.
I realize this is far from the current price, but nonetheless, this target area appears justified in my opinion. There are two important Fibonacci retracements based on the 2015-2020 rally that gold can bounce from (it recently bounced from the 38.2% retracement). These are 50% and 61.8% retracements.
The support provided by the 61.8% retracement is strengthened by the 2020 low and the support provided by the 50% retracement is strengthened by the 2019 high.
However, based on gold’s self-similarity to 2013, it seems that we’re about to see a slide that’s bigger than what we’ve been seeing so far this year. This time – based on the similarity – gold is likely to decline profoundly, but no longer in the back-and-forth mode. If gold formed its next local low at the 50% retracement (so at about $1,560), then it might do so still within the declining, short-term trend channel (sometime in September).
However, if gold is to stick to the link to 2013, then it should decline more rapidly. In this case, the technique that can help us estimate the short-term target is the one that says that after a breakdown from a trend channel, price is likely to move approximately by as much as the height of the previous trend channel. In this case, gold could break below the trend channel soon and then decline even more. Based on the height of the trend channel, the above means that a move to the 61.8% retracement as the next downside target is more likely than a move to the 50% retracement.
I previously wrote that the above-mentioned decline in gold would likely be linked to a breakdown in the EUR/USD below 1, and we already saw both: decline in gold, and a breakdown in the EUR/USD below 1. The implications remain bearish.
Let’s zoom in on what happened in 2013 after the analogous rebound.
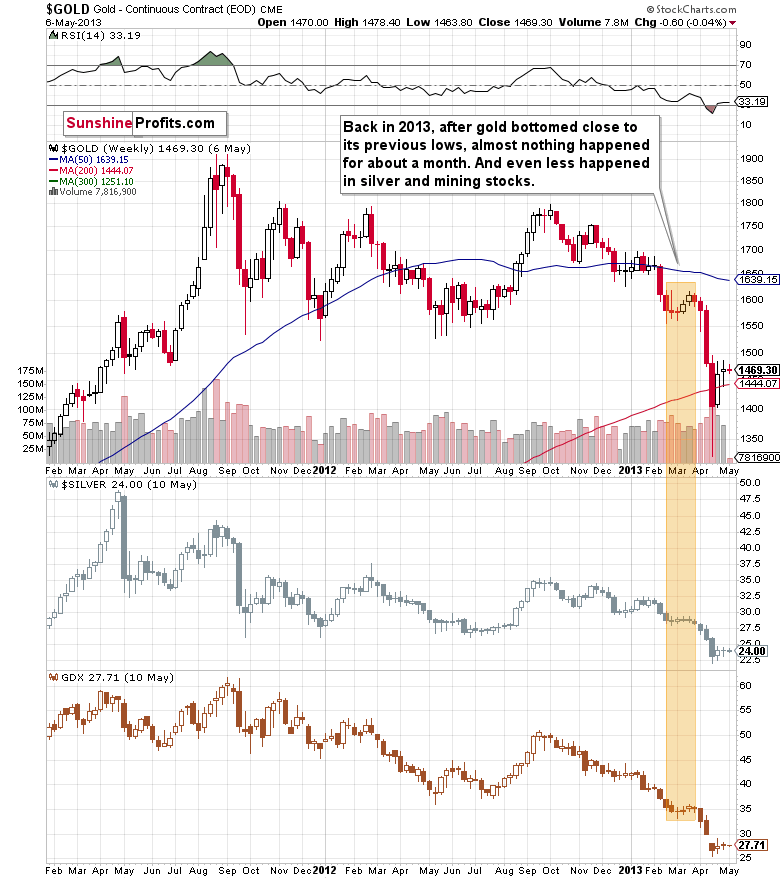
Well, gold consolidated for a few weeks and plunged only after that consolidation.
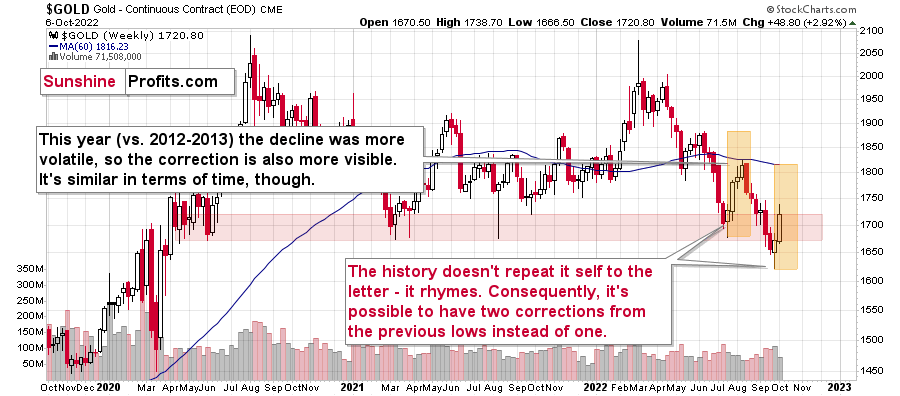
That’s what we saw recently as well. Of course, we haven’t seen the big plunge yet, but the other parts of the recent price patterns are very, very similar to what we saw in 2013.
Still, let’s keep in mind that history doesn’t necessarily repeat itself to the letter – it rhymes. Consequently, it’s quite possible to have two corrections from the previous lows instead of just one.
Especially if the temporary (!) effect of geopolitical events practically forces gold to move up due to safe-haven demand.
In other words, on a more-or-less basis, gold is doing exactly what it’s been doing in April 2013, right before the biggest part of the slide.
This means that right now is probably one of the worst moments to be exiting the short position in the precious metals sector, and perhaps one of the best ones to be entering the short position if one doesn’t already have it at their desired size.
Having said that, let’s zoom in to see gold’s short-term price moves.
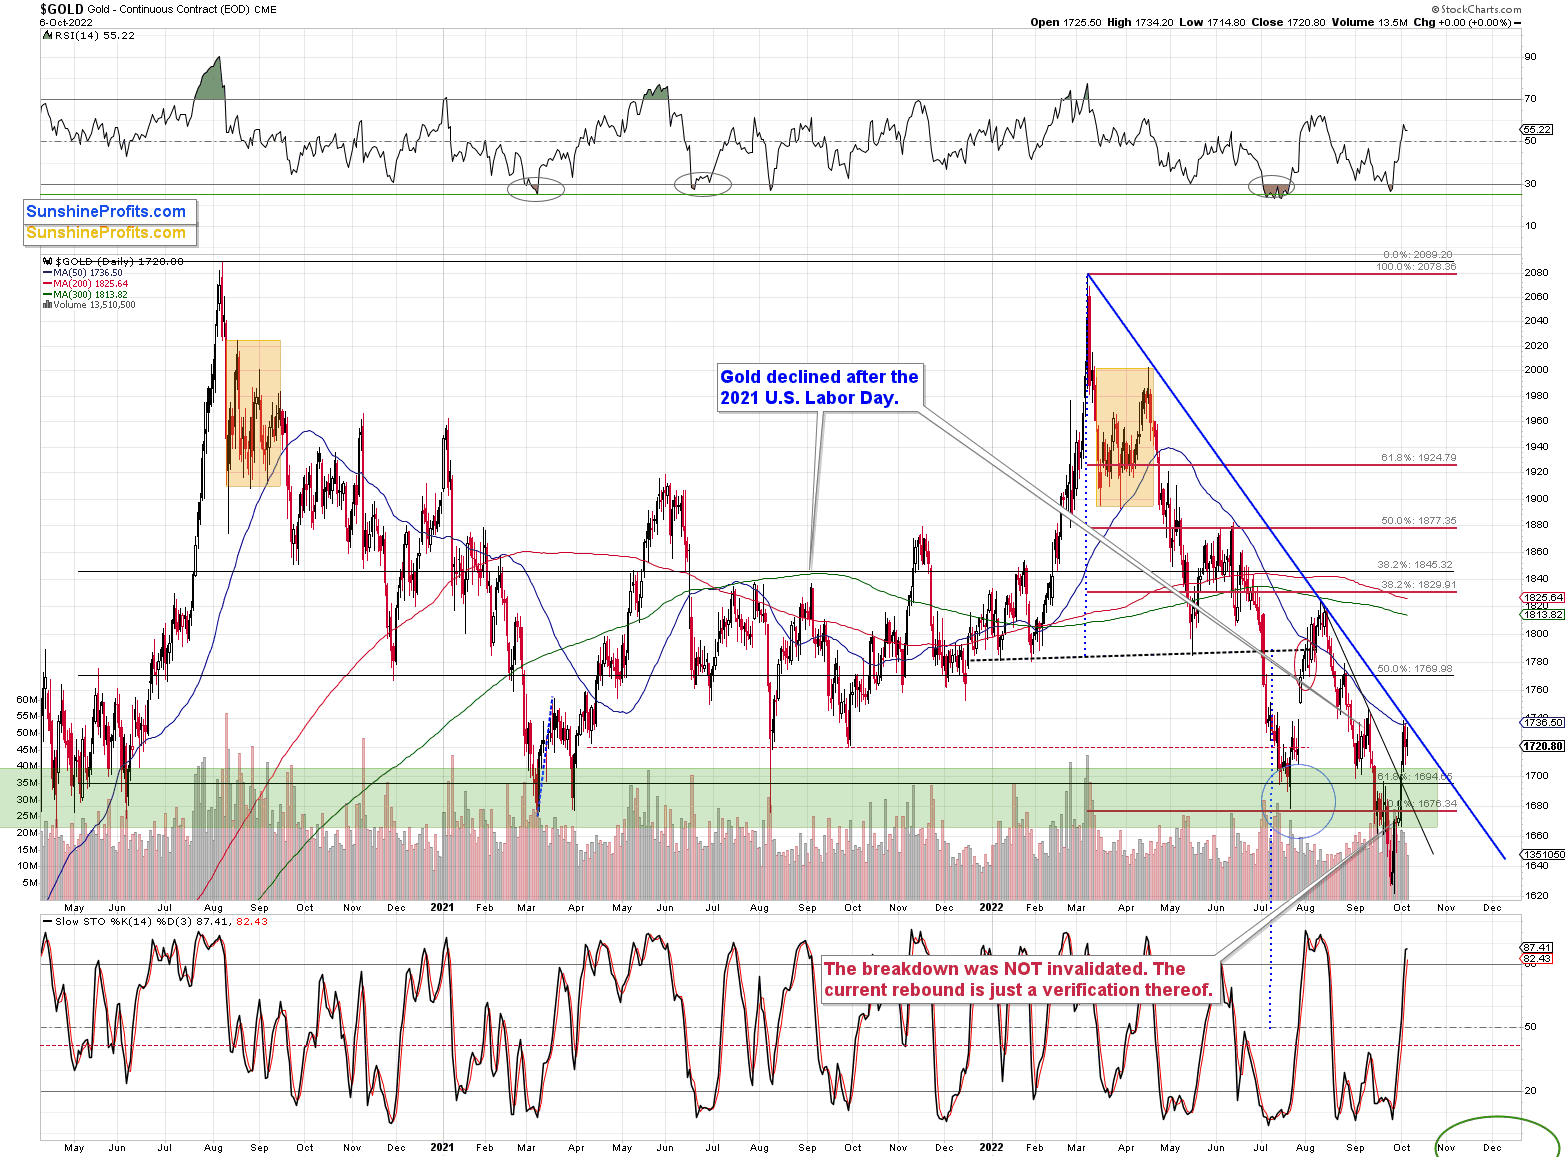
Gold moved sharply higher very recently, and… It didn’t change that much.
It managed to get back above the green support/resistance zone, but it only happened after the breakdown was already verified, and it happened based on quite a few geopolitical events that happened close to each other.
Gold was still stopped by its declining medium-term resistance line and its 50-day moving average.
So, gold got a boost from almost everywhere (I even received quite a few questions about how gold would move in the event of WW3, so the level of concern regarding geopolitical stability is high), and all it managed to do was to rally a bit above $1,720 – it’s not that much.
The reasons for which gold rallied are likely either unfounded (Fed’s supposed U-turn) or temporary and likely exaggerated (geopolitical events, WW3). Consequently, gold’s rally seems to be a temporary phenomenon, and as the dust settles and the “world doesn’t end”, the bigger trends are likely to be resumed.
This means lower gold, silver, and mining stock prices.
Having said that, let’s take a look at the silver market. In short, as silver closed a mere $0.12 higher yesterday, my previous comments on this market remain up-to-date.
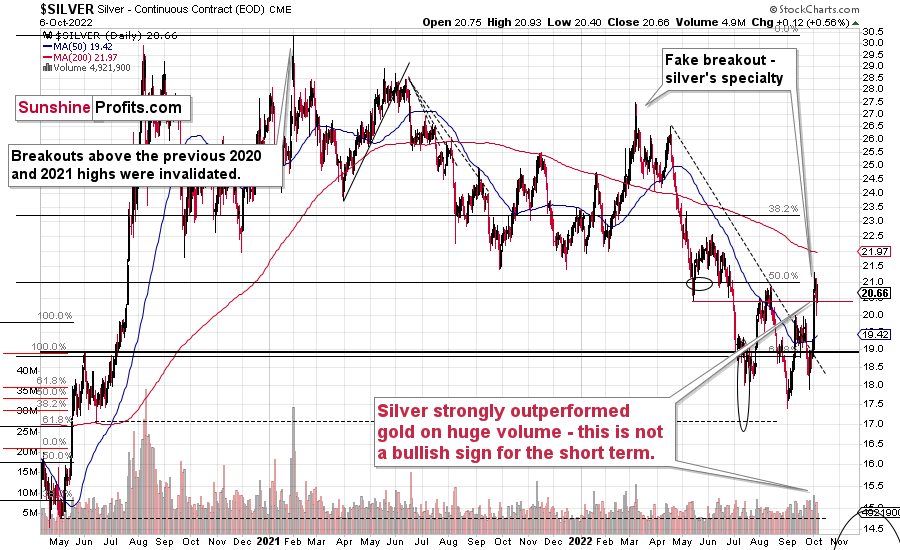
In Monday’s intraday Alert, I wrote the following about silver’s outperformance:
“The precious metals market moved higher today, and I just received the following question:
“What is happening with silver?”
The thing is that silver soared in a major way today, gaining about $1.5. It moved above its September 2022 high, and almost touched its August high.
The GDXJ did move above $30 (it has yet to close above it, though), and gold moved a bit above its late-September highs, and the downtrend in both markets remains visibly intact.
However, silver soared. What gives?
Those, who have been following my analyses for some time likely know what this means. It means that the current move up is likely fake. Silver tends to outperform gold in a major, yet brief way, right at the end of a given upswing, or close to it.
That’s exactly what we see today.
The S&P 500 futures are up today, but let’s not forget that they broke to new yearly lows in weekly terms. Therefore, it would take more than a daily rally to invalidate this bearish indication. Do you remember the Sep. 28 session, where stocks “invalidated” the breakdown to new lows? Well, it was followed by another slide. Since Friday’s breakdown was more important (weekly!), it seems that the bearish forces are likely to return shortly this time as well. And with them, lower gold, silver, and mining stock values.
All in all, the very bearish outlook for the following weeks/months remains intact.”
Now, we know that silver’s daily rally was accompanied by one of the biggest volume readings that we’ve seen so far this year. This makes the above even more up-to-date.
The session with the highest volume was the 2022 top, by the way.
So, where do we go from here?
If you’d like a price prediction for the next three days, then I don’t think it’s possible for anyone to provide it. The markets are volatile and are focusing on pretty much random things at the moment. I described what the reality is, and I described what people choose to focus on instead. Emotions, not logic, drive these price moves. Consequently, we could theoretically use – as always – technical tools. However, with this kind of volatility, it’s possible that we get an immediate turnaround, but it’s also possible that the rally remains sharp for several hours – days, and we get a massive reversal only then.
Fortunately, we’re not in the day-trading business, and I haven’t written about short positions in silver, either (the price levels for silver and gold are only provided as some subscribers request that). This means that we can simply continue to focus on what’s much more predictable by using tools that don’t just randomly stop being useful.
The link to 2013 remains intact, and so does the very bearish outlook. When in doubt, or when things appear too hectic, and you want to drop the towel, give up, and run for the hills, take several deep breaths, and return to the long-term charts. Has anything major happened to them. No. So, whatever you see is most likely just short-term price noise.
Investing and trading are simple but not easy. This year has been extremely profitable so far, but no market can move up or down without corrections, and no position can grow more and more profitable each day – there have to be some corrections. The key thing is how one approaches those days. Will one allow short-term emotions to cloud their vision, or will one stand firm and in tune with the original strategy?
I can’t make any guarantees with regard to gold’s price performance or profitability, but I do think that this counter-trend upswing is just a very temporary phenomenon, and that the big downtrend remains intact. In my opinion, the short position in junior mining stocks remains justified from the risk to reward point of view, and I’m keeping my position intact. Of course, whatever you decide to do with your money is completely up to you – it’s your capital, after all.
Silver just invalidated the breakout above its August highs in terms of the closing prices.
That’s one of the reasons to support the scenario in which the precious metals market has already topped.
Of course, I can’t guarantee that this has indeed happened, and – as I emphasized earlier – I’m not even attempting to day-trade the current situation, as I don’t think that’s where the best risk/reward opportunity lies. In my view, the optimal risk-to-reward opportunity is to gain thanks to the huge, medium-term decline that’s in tune with what happened in 2013 and 2008. That’s what provided huge profits so far this year, and while I can’t promise anything, in my opinion, those profits are going to increase substantially before the year is over.
Let’s keep in mind that while gold is repeating its 2013 performance, so is silver.
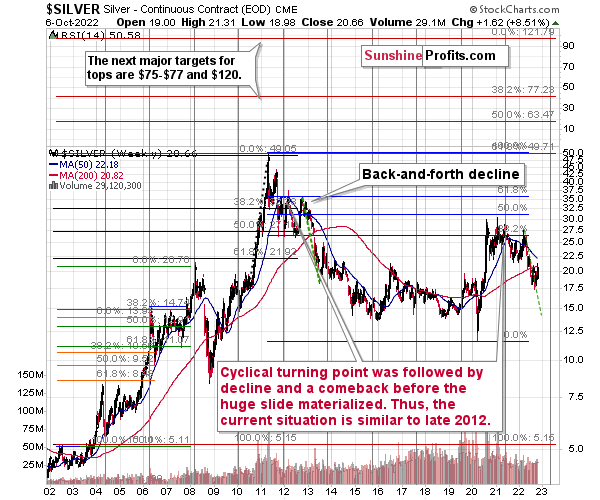
As you can see on the above chart, silver corrected about 50% of the previous downswing, and this correction ended at about $30, a long time ago. Ever since, silver has been declining, and even the outbreak of war in Europe didn’t make silver rally above that level.
On the above chart, you can see how silver first topped in 2011, then declined and formed another top at the cyclical turning point. Next, it declined once again – to the previous lows. After that, silver rallied (in 2012 and 2022), and it topped between its 50-week moving average (marked in blue) and the previous top. Now silver is declining in a back-and-forth manner (you can see it more clearly on the previous short-term silver chart).
Back in 2012, these were just the early days of a gargantuan decline, and the same appears likely to be the case this time. Interest rates are going up after all, and the Fed is determined to quench inflation.
Let’s not forget that rising interest rates are likely to negatively impact not just commodities, but practically all industries. This will likely cause silver’s price to decline profoundly, as silver’s industrial demand could be negatively impacted by lower economic growth (or a decline in economic activity).
Besides, please note that silver didn’t even manage to rally as much as copper (which tried to move to new highs recently) or most other commodities, thus being rather weak.
Consequently, it seems that silver will need to decline profoundly before it rallies (to new all-time highs) once again.
Having said that, let’s take a look at what happened in mining stocks.
History tends to repeat itself. Not to the letter, but in general. The reason is that while economic circumstances change and technology advances, the decisions to buy and sell are still mostly based on two key emotions: fear and greed. They don’t change, and once similar things happen, people’s emotions emerge in similar ways, thus making specific historical events repeat themselves to a certain extent.
For example, right now, gold stocks are declining similarly to how they did in 2008 and in 2012-2013.
As gold was practically forced to rally based on geo-political events (UK’s QE, tactical nuclear warfare scare, Iranian protests…), so were gold stocks.
Did it change anything technically?
It did, because gold stocks have now moved back above their declining medium-term support line. But did the implications change? Not really – the breakdown was already verified, and there were many non-technical reasons for gold (and thus gold stocks) to rally, so I’d still view this as a counter-trend bounce.
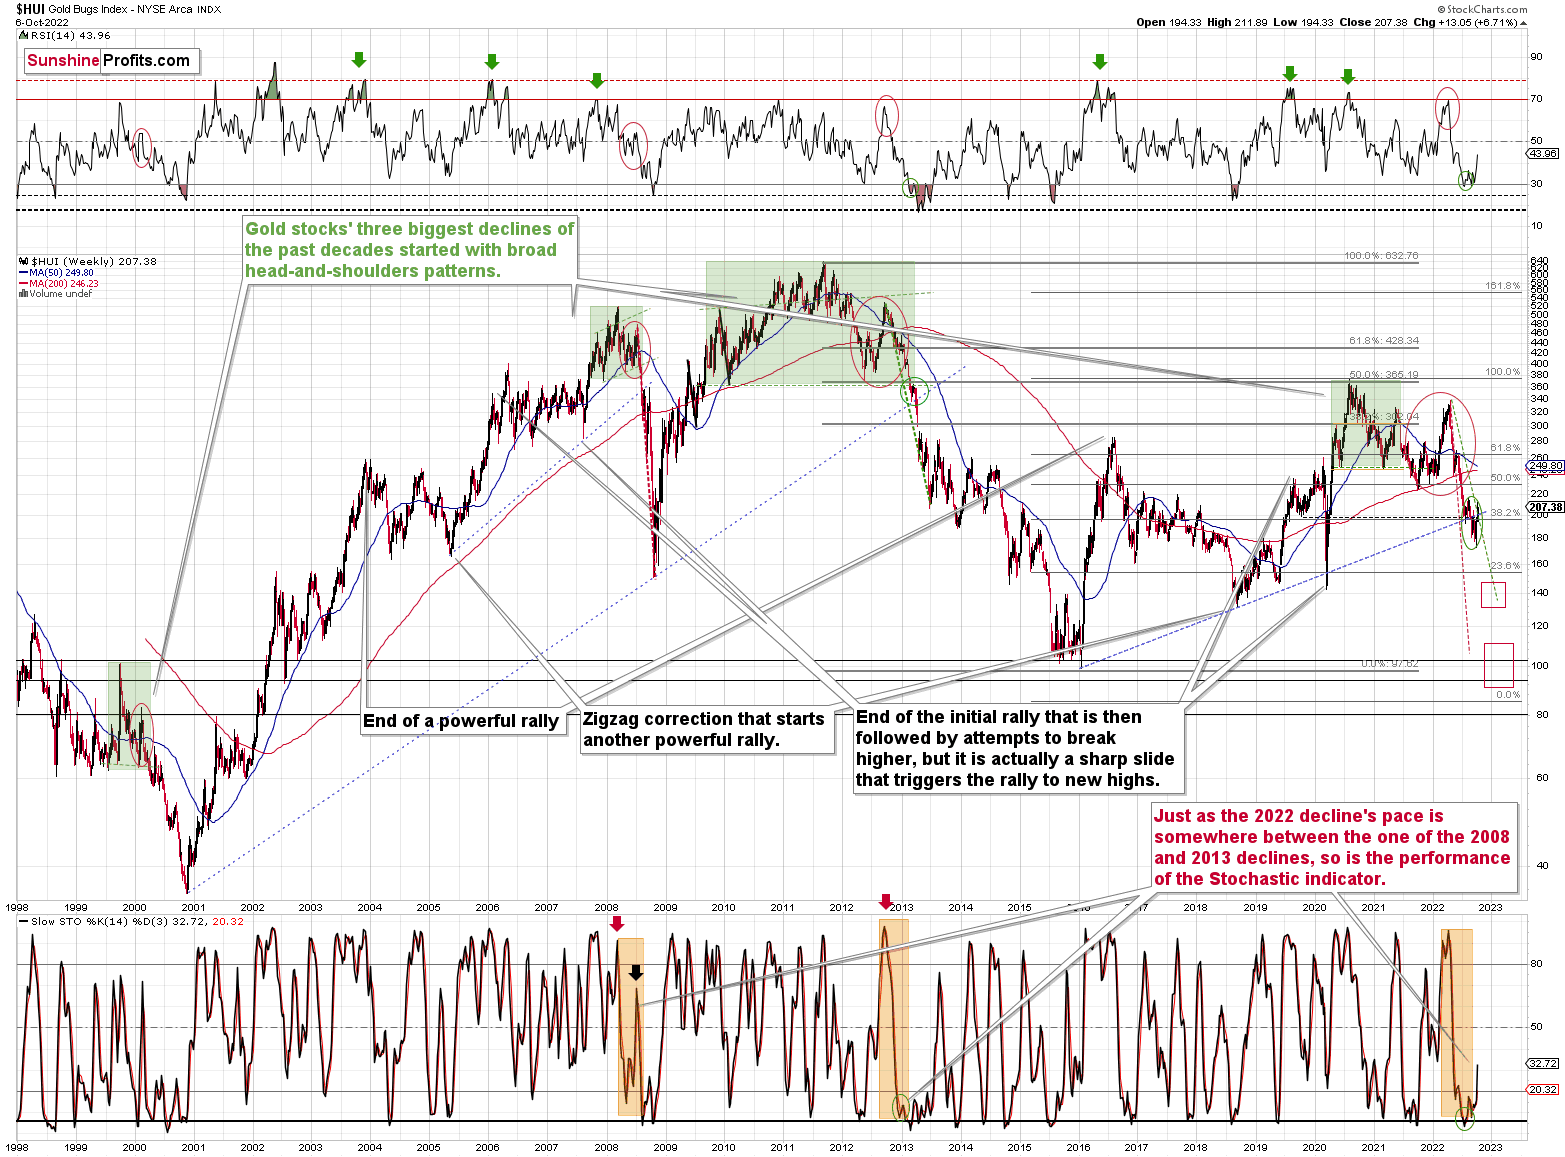
The analogies to 2013 and 2008 were not invalidated because of this upswing, and my yesterday’s comments on the above chart remain up-to-date:
The key analogies in the case of the HUI Index (I’m using this chart as it has the most long-term scope) are to 2008 and 2013.
In 2008, there was a move higher in the stochastic that accompanied a sharp – but temporary – upswing that was then followed by a much bigger decline.
In 2013, there was a series of tiny upswings that didn’t really change anything.
Right now, we see something in between the above.
On multiple occasions, I wrote that the situation right now is somewhat similar to what we saw in 2013 (mostly), but it also has a 2008 vibe to it.
Even so, the pace at which gold stocks are declining is between both declines: the 2008 and 2013 ones. I marked this with dashed lines.
Please note the green, dashed line that starts at the late-2012 top and the one that starts at the 2022 top. Those lines are identical. You can see that back in 2012 and 2013, the HUI Index traded above this line. This time, it’s trading below it – gold stocks are declining faster.
Faster declines imply sharper corrections – as emotions get hotter.
So, does Stochastic’s performance indicate an even bigger rally here? Not necessarily.
Was the current rally very likely based on stochastic? Possible – yes, but very likely – no. The link to 2013 is still more visible and more important.
How low can the HUI Index fall during the next big downswing?
As it’s the case with gold and silver, a move back to the 2020 lows is definitely in the cards. Please note that this level is also strengthened (as support) by other major lows: the 2019, 2014, and 2008 ones.
However, I wouldn’t rule out a move even lower on a temporary basis. If gold were to decline to about $1,450-1,500, it would mean that it would double its current 2022 decline. If the HUI Index does that, it will move below 150.
So, all in all, 120-150 is my current target area for the upcoming slide in the HUI Index.
All right, let’s zoom in and see how mining stocks declined in 2008.

Back then, the GDXJ ETF was not yet trading, so I’m using the GDX ETF as a short-term proxy here.
The decline took about 3 months, and it erased about 70% of the miners’ value. The biggest part of the decline happened in the final month, though.
However, the really interesting thing about that decline – that might also be very useful this time – is that there were five very short-term declines that took the GDX about 30% lower.
I marked those declines with red rectangles. After that, a corrective upswing started. During those corrective upswings, the GDX rallied by 14.8-41.6%. The biggest corrective upswing (where GDX rallied by 41.6%) was triggered by a huge rally in gold, and since I don’t expect to see anything similar this year, it could be the case that this correction size is an outlier. Not paying attention to the outlier, we get corrections of between 14.8% and 25.1%.
Fast forward to the current situation. Let’s take a look at the GDXJ ETF.
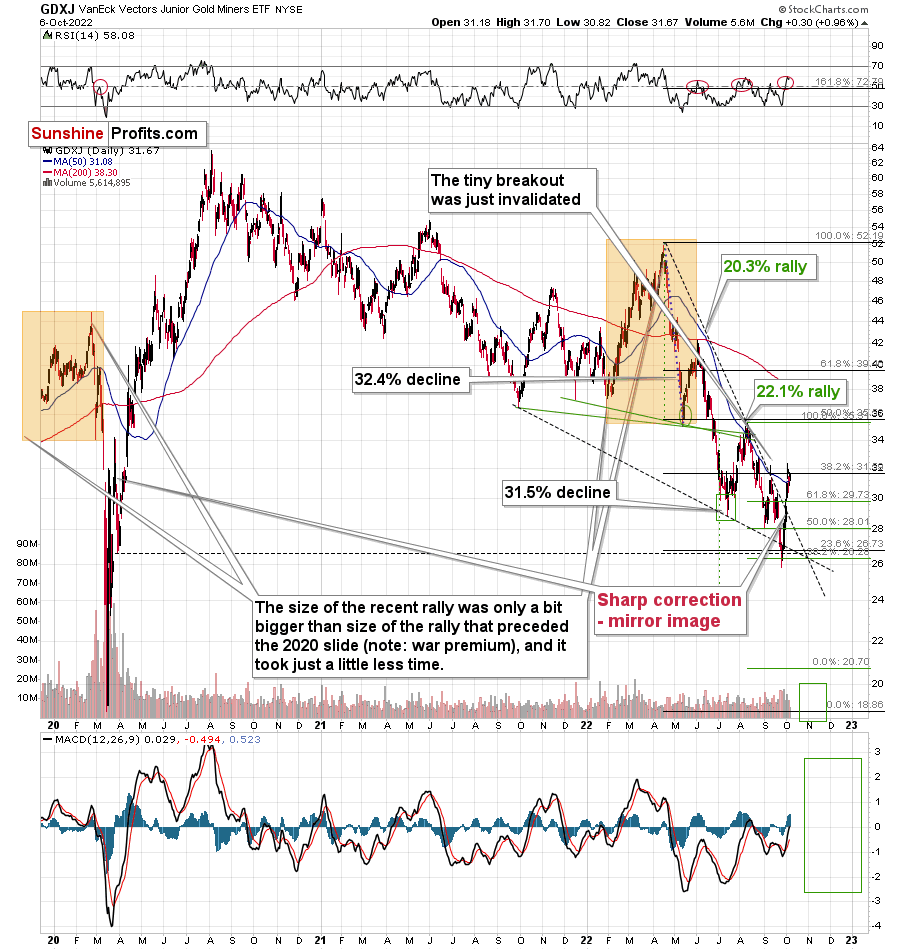
Just like the rest of the precious metals sector, the GDXJ ETF moved higher recently. And, just like it was the case with other charts today, my recent comments on the above chart remain up-to-date:
The GDXJ sold off a bit, and we saw a small move lower in the RSI indicator as well. This is rather normal behavior given that we just saw a local top.
Prices don’t have to slide profoundly on the very next day after the top, there could be some sideways trading beforehand. For example, that’s what happened in August 2022. The decline’s pace picked up shortly, though.
In other words, my Tuesday’s comments on the above chart remain up-to-date:
That’s the fourth attempt of the GDXJ to break above its 50-day moving average (marked in blue). All previous cases failed, and in all previous cases the rally taking prices to this MA were sharp.
Is this time different? That’s unlikely, as the fundamentals (as explained earlier today) haven’t changed.
Additionally, please note that the RSI just jumped above 50, and ever since the April 2022 top, these levels in the RSI meant that local tops were in. I marked that with red ellipses in the upper part of the chart.
There’s also one additional factor explaining why this counter-trend bounce might be so volatile – that’s because the mirror image of this decline – the 2020 rally – also features a sharp correction around those price levels.
This time, the correction doesn’t have to be as big as the move that led to it was not as sharp.
Now, as you may recall, I previously had a downside target of about $26, but I ended up resigning from it. I continue to think that this decision was justified from the risk to reward point of view (given the data that we had available at that time), as there were previously corrective upswings, and it was not a no-brainer that we’re going to see a rebound also one more time.
However, as geopolitics came into play this time, the counter-trend rally has indeed materialized. Since it doesn’t make much sense to try to predict those near-term geopolitical events – the world is too unpredictable, it’s better to focus on the part of the picture where we can actually gain an extra edge over other market participants. That is recognizing trends and tendencies. Once the very short-term dust settles, the markets are likely to get back to their previous trends and surprise those who assume that short-term geopolitical events have a lasting impact on the markets. They don’t. If that was the case, gold would be above $2,000 at this time, as that’ where it soared based on the Russian invasion. Well, the war didn’t end, and yet gold is at about $1,700.
Meanwhile, the relative performance of junior miners compared to senior miners continues to deteriorate in a medium-term trend.
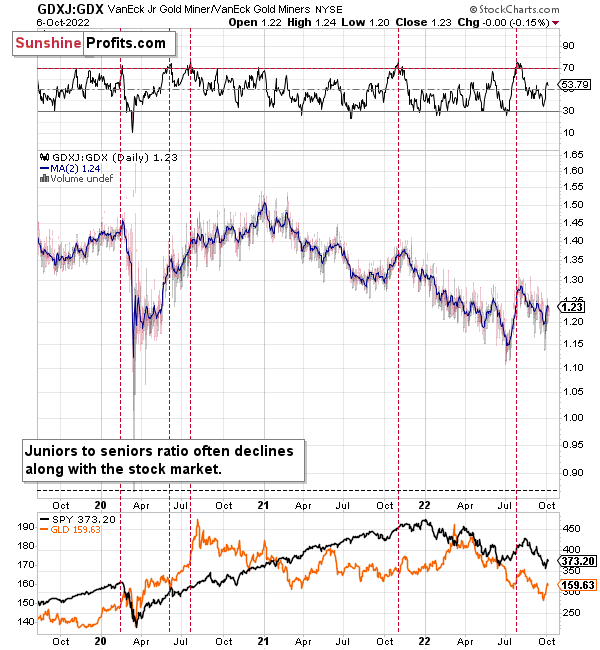
During this quick upswing, juniors rallied relative to seniors, but this is just a very short-term move that’s within a short-, and medium-term downtrends.
This implies bigger declines in the GDXJ in the future.
Also, let’s not forget about the forest while looking at individual trees. By that, I mean looking at how gold stocks perform relative to gold. That’s one of the major indications that the current situation is just like what we saw at the 2012 top.
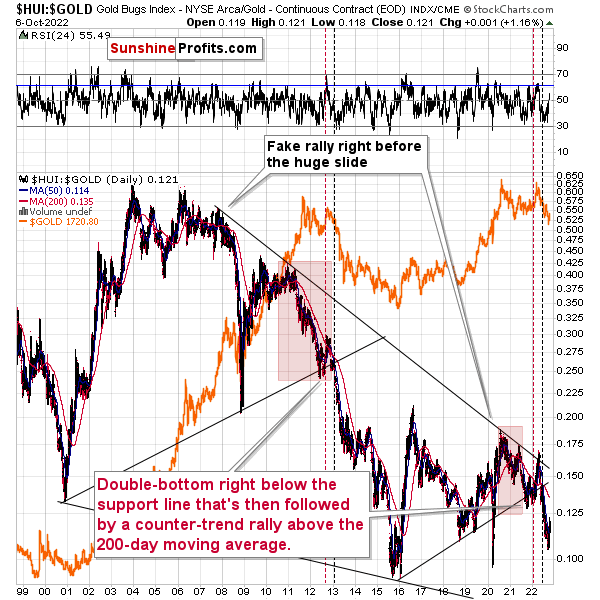
The situation in the gold stock to gold ratio is similar to what we saw in late 2012 and early 2013. The HUI to gold ratio invalidated its first attempt to break lower (marked with red, dashed lines), but after a corrective upswing, it then broke lower more decisively. That’s what I marked using black, dashed lines.
Recently, we saw a quick upswing in the ratio, but that’s not a game-changer – even the biggest declines had quick corrections in the past.
If history is to rhyme, we’re about to see a profound decline. In fact, we’re likely already past its beginning.
Also, please note that the pattern that we currently see, which started in early 2016, is somewhat similar to what happened between 2003 and 2008.
Back in 2008, the breakdown from the consolidation resulted in sharply lower ratio values and much lower prices of gold stocks.
So, if the situation is analogous to 2012-2013, we’re likely to see a big decline in the following weeks/months, and if it’s analogous to 2008, we’re likely to see an enormous decline in the following weeks/months.
Declining stock prices would only add fuel to the bearish fire (after all, gold stocks are… just stocks) and that’s exactly what’s likely to happen.
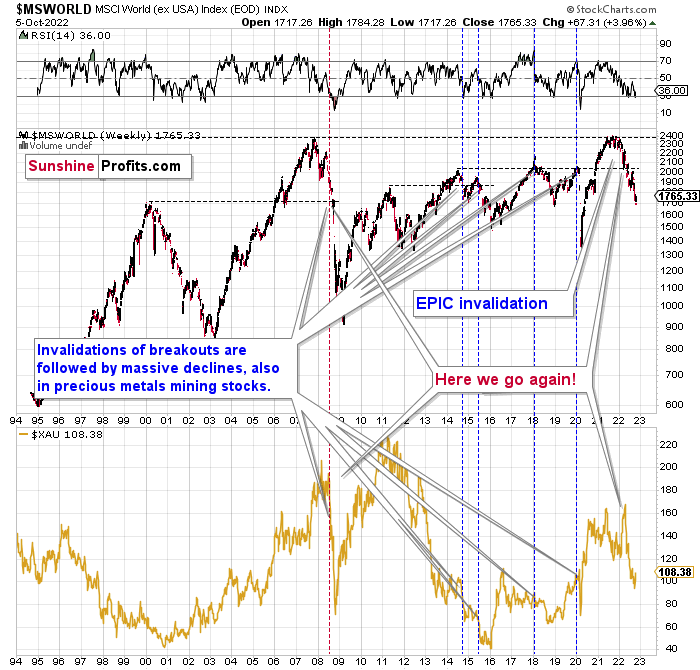
The technical picture in the case of world stocks remains extremely bearish, and my previous comments on it were just confirmed.
After a brief pause, the freefall continues, just like in 2008. This has profoundly bearish implications for the mining stocks that declined severely back then.
Here’s what I’ve been writing about the above chart for quite a few weeks now:
World stocks have already begun their decline, and based on the analogy to the previous invalidations, the decline is not likely to be small. In fact, it’s likely to be huge.
For context, I explained the ominous implications on Nov. 30. I wrote:
Something truly epic is happening in this chart. Namely, world stocks tried to soar above their 2007 high, they managed to do so, and… failed to hold the ground. Despite a few attempts, the breakout was invalidated. Given that there were a few attempts and that the previous high was the all-time high (so it doesn’t get more important than that), the invalidation is a truly critical development.
It's a strong sell signal for the medium - and quite possibly for the long term.
From our – precious metals investors’ and traders’ – point of view, this is also of critical importance. All previous important invalidations of breakouts in world stocks were followed by massive declines in mining stocks (represented by the XAU Index).
Two of the four similar cases are the 2008 and 2020 declines. In all cases, the declines were huge, and the only reason why they appear “moderate” in the lower part of the above chart is that it has a “linear” and not a “logarithmic” scale. You probably still remember how significant and painful (if you were long, that is) the decline at the beginning of 2020 was.
All those invalidations triggered big declines in the mining stocks, and we have “the mother of all stock market invalidations” at the moment, so the implications are not only bearish, but extremely bearish.
World stocks have declined below their recent highs, and when something similar happened in 2008, it meant that both stocks and gold and silver mining stocks (lower part of the chart) were about to slide much further.
The medium-term implications for mining stocks are extremely bearish.
However, let’s get back to the short- and medium-term points of view.
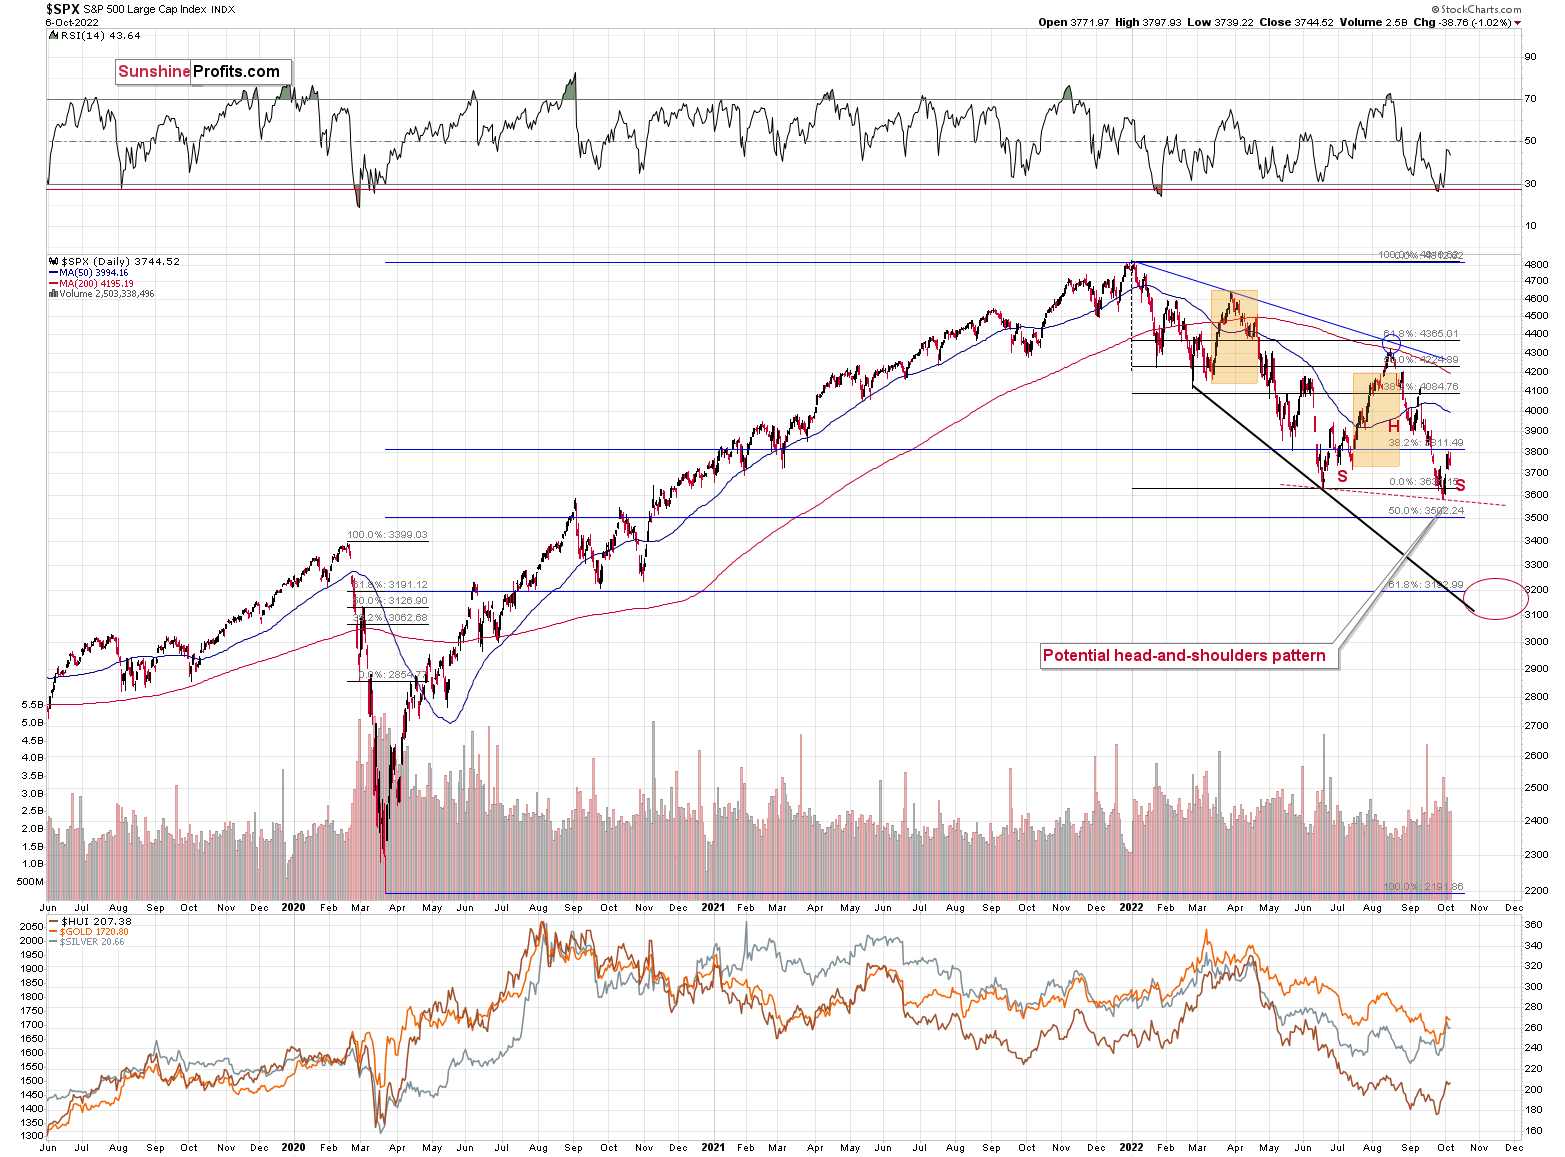
Stocks rallied on the unfounded expectations of the Fed’s dovish U-turn, but it could be the case that the rally has already run its course.
The upswing was rather small, and if it is followed by another decline (and that’s likely!), it might create a very bearish head-and-shoulders pattern. This pattern would leave the door wide open to declines to the mid-2020 lows at about 3,200.
Such a decline would likely have a devastating effect on the prices of precious metals, especially silver and mining stocks – and in particular, junior mining stocks.
As interest rates are likely to go up, the stock market is likely to go down – perhaps as low as 3,200 on a short-term basis – and then – after a correction – even lower.
Most interestingly, though, such a decline would likely have a devastating effect on the prices of mining stocks (especially junior mining stocks) and silver. There might be some impact on gold, too.
The above would also be in tune with an extra rally in the USD Index. After all, less competitive exports are not that favorable for the U.S. economy.
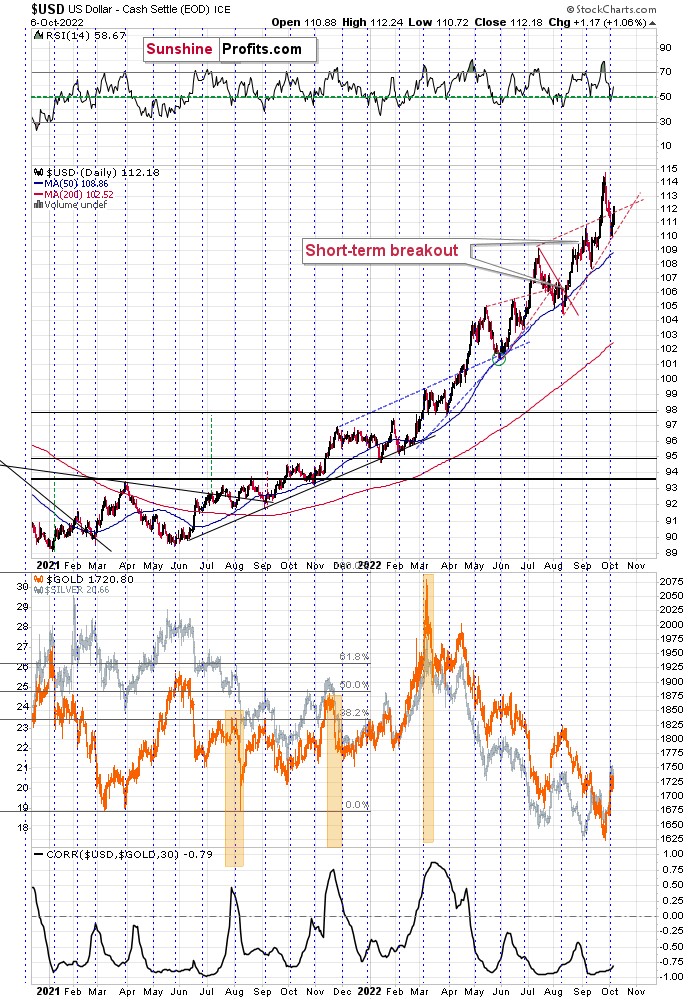
The rally in the USD Index simply continues from the short-term point of view, and we just saw a very-short-term pullback. And – especially in light of yesterday’s rally – my yesterday’s comments on the above chart remain up-to-date:
The USD Index moved below the upper border of its previous trading wedge, but it stopped at its lower border.
The RSI moved a bit below 50 and then it moved back above it.
Throughout 2022, the above – especially when it happened close to the turn of the month – corresponded to local lows. It was either right at those lows or close to them.
Given the strongly negative correlation between gold and the USD Index, it seems that both corrections, in the USDX and in gold, could already be over.
Still, there were times when the RSI based on the USDX moved even slightly lower before the bottom was in, so I wouldn’t rule out a move to 109 or so before the final bottom takes place.
In all cases, I don’t think that the USD Index would be likely to decline even more profoundly – for example, to 105 or lower.
The implications for the precious metals are very bearish for the medium and short term, and unclear with regard to the immediate term (next several hours – next few days).
It seems that history rhymed, and the USD Index bottomed close to the turn of the month once again.
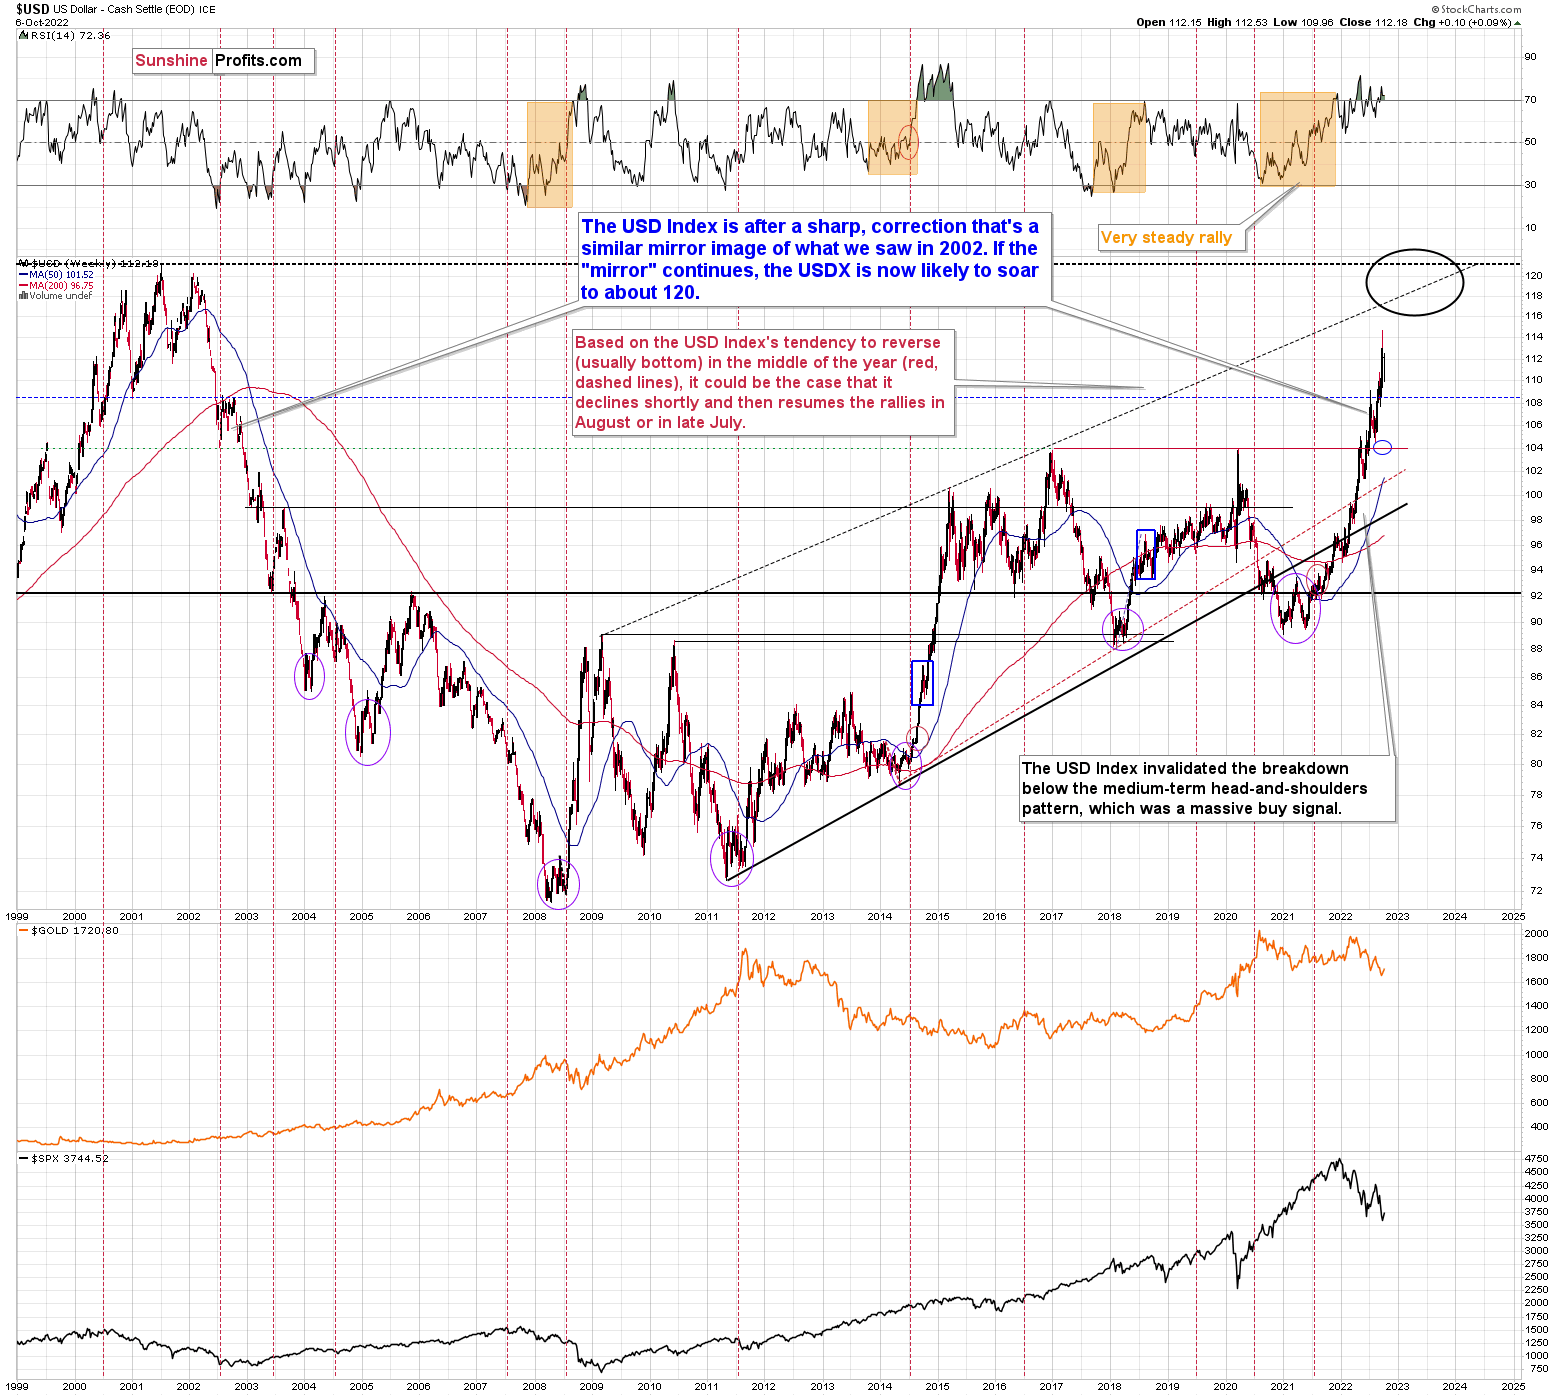
From the long-term point of view, the USD Index is currently rallying in approximately the mirror image of how it declined in 2002. Based on this, it seems that one shouldn’t be surprised by a rather quick move from the current levels to about 120 – USD Index’s long-term highs. Of course, the implications for the precious metals market are profoundly bearish.
This doesn’t rule out quick corrections along the way – those don’t interrupt the big, weekly/monthly moves at all, and they don’t break the analogy. This includes the recent downswing – it didn’t invalidate the bullish medium-term uptrend.
This is extremely bearish for gold and the rest of the precious metals sector.
Overview of the Upcoming Part of the Decline
- It seems to me that the corrective upswing is over or about to be over after an additional – very brief – rally, and that the next big move lower is already underway.
- If we see a situation where miners slide in a meaningful and volatile way while silver doesn’t (it just declines moderately), I plan to – once again – switch from short positions in miners to short positions in silver. At this time, it’s too early to say at what price levels this could take place and if we get this kind of opportunity at all – perhaps with gold prices close to $1,600.
- I plan to switch from the short positions in junior mining stocks or silver (whichever I’ll have at that moment) to long positions in junior mining stocks when gold / mining stocks move to their 2020 lows (approximately). While I’m probably not going to write about it at this stage yet, this is when some investors might consider getting back in with their long-term investing capital (or perhaps 1/3 or 1/2 thereof).
- I plan to return to short positions in junior mining stocks after a rebound – and the rebound could take gold from about $1,450 to about $1,550, and it could take the GDXJ from about $20 to about $24.
- I plan to exit all remaining short positions once gold shows substantial strength relative to the USD Index while the latter is still rallying. This may be the case with gold prices close to $1,400 and GDXJ close to $15 . This moment (when gold performs very strongly against the rallying USD and miners are strong relative to gold after its substantial decline) is likely to be the best entry point for long-term investments, in my view. This can also happen with gold close to $1,400, but at the moment it’s too early to say with certainty.
- The above is based on the information available today, and it might change in the following days/weeks.
You will find my general overview of the outlook for gold on the chart below:
Please note that the above timing details are relatively broad and “for general overview only” – so that you know more or less what I think and how volatile I think the moves are likely to be – on an approximate basis. These time targets are not binding nor clear enough for me to think that they should be used for purchasing options, warrants, or similar instruments.
Letters to the Editor
Q: Hi PR,
Many thanks for your analysis. I would appreciate your opinion as to how the precious metals will react to the upcoming World War 3 - that will develop from this Ukraine/Russ conflict. Some are saying that tactical (not strategic) nuclear weapons are being seriously considered by the Russian neo cons within the Duma - right now! They see Putin as too soft and that Russia's reputation on the battlefield is taking a beating. The neocons want to re-address the recent battlefield losses. Do you think the latest uptick in precious metals is reflecting this WW3/ Tactical nuclear concern? Putin himself has stated that if there is an existential threat to Russia, all options are on the table. Also – surely when (if) WW3 develops, then the Fed would have to relinquish quantitative tightening and flick back to quantitative easing. I would think that this would facilitate the rise of precious metals, along with the fact that in world wars (as opposed to regional conflicts, which is what this is at present but looks very close to spilling into Europe), people gravitate to precious metals.
I would appreciate your expert opinion on the above points.
A: IF there’s a World War 3, then gold would be likely to rally significantly (both through direct safe-haven buying, and based on rate cuts that would likely – globally – follow due to this). That’s why we’re keeping physical gold in the insurance part of our portfolio – That’s been the case for years now, and you can find details within the summary part of the analysis – just a little below this text.
Now, I don’t think that WW3 is likely here, which is why the “investment” (not “insurance”) part of the portfolio is not invested in the precious metals sector – I’m waiting for lower prices to get back in.
On a side note, in my view, if Ukraine lost the conflict, it would probably become more likely, but I don’t want to get into political speculation.
“Some” have been talking about the possibility of the use of nukes for months now. It’s been obvious that this was a possibility even before the Russian invasion started. Gold prices are now much lower than when the invasion started. So are silver and mining stocks.
Consequently, the question is – is there something new now that hasn’t been on the table before that the market is incorrectly estimating (like the Fed’s dovish U-turn, in my view).
I don’t think so. Gold might get a boost every time something major and unexpected happens geopolitically, but once the dust settles, the trends are likely to be resumed. And the key drivers of gold prices are the USD Index and real interest rates. Both are moving higher in the medium term, and that’s bearish for gold.
Q: The gold rally of the last several days has put my short positions massively underwater. On paper, I have given back all of the gains I made since joining and more. But I am sitting tight and staying calm. Water finds its level sooner or later, and the fundamentals do not support these irrational valuations. My faith in your analysis is unshaken. Gold will hit much greater lows sooner or later.
A: Thank you for trusting in my analysis and for your patience.
Yes, it’s much easier to stay calm when you’re sitting on huge profits from the previous trades (we’ve had only successful trades, both long and short) this year, but it’s also true that it’s possible for one to enter the position right before a correction, which then makes it “turn red” for some time. In my opinion, the days of this rally are numbered, so it seems that the patience will soon be very well rewarded.
Summary
Summing up, it seems that the biggest part of the 2013-like decline is taking place right now, and – while I can’t make any promises regarding performance - it seems likely to me that our big profits are about to become huge, and then ridiculously big in the relatively near future.
As far as this quick corrective upswing is concerned, it seems that it might already be over (or about to be over).
The current quick upswing most likely doesn’t change anything. Fundamentals and technicals continue to point to lower precious metals values in the coming weeks / months. The current geopolitical news-based rally is likely to serve as nothing more than just a verification of the breakdown below the previous lows in gold.
Things might happen very fast in the coming days, and if I plan to make any adjustments, I’ll keep you informed. Still, if the targets that I’m mentioning in the “Trading” part of the summary are reached, I think that profits should be taken off the table without an additional confirmation from me. I will probably get on the long side of the market at that time, but I’ll send a confirmation if I decide to do so.
After the final sell-off (that takes gold to about $1,350-$1,500), I expect the precious metals to rally significantly. The final part of the decline might take as little as 1-5 weeks, so it's important to stay alert to any changes.
As always, we'll keep you – our subscribers – informed.
To summarize:
Short-term outlook for the precious metals sector (our opinion on the next 1-6 weeks): Bearish
Medium-term outlook for the precious metals sector (our opinion for the period between 1.5 and 6 months): Bearish initially, then possibly Bullish
Long-term outlook for the precious metals sector (our opinion for the period between 6 and 24 months from now): Bullish
Very long-term outlook for the precious metals sector (our opinion for the period starting 2 years from now): Bullish
As a reminder, Gold Investment Updates are posted approximately once per week. We are usually posting them on Friday, but we can’t promise that it will be the case each week.
Our preferred ways to invest in and to trade gold along with the reasoning can be found in the how to buy gold section. Additionally, our preferred ETFs and ETNs can be found in our Gold & Silver ETF Ranking.
Moreover, Gold & Silver Trading Alerts are posted before or on each trading day (we usually post them before the opening bell, but we don’t promise doing that each day). If there’s anything urgent, we will send you an additional small alert before posting the main one.
Thank you.
Przemyslaw Radomski, CFA
Founder, Editor-in-chief

