
"The European Union is dying - not a dramatic or sudden death, but one so slow and steady that we may look across the Atlantic one day soon and realize that the project of European integration that we've taken for granted over the past half-century is no more."
With these dramatic words begins a eulogy of the European Union in a Washington Post article.
The problem is not just economic with countries like Greece sapping the Euro's strength. According to the author, Charles Kupchan, the more "serious malady" is a re-nationalization of political life with countries reclaiming the sovereignty they once willingly ceded for the collective eurozone ideal.
We recently witnessed growing European right-wing xenophobia, a fear of being swamped by immigrants. French President Nicolas Sarkozy in a much publicized move cracked down on Gypsy camps. Libyan leader Colonel Muammar al-Gaddafi just ended his visit to Italy by calling on the European Union to pay his country €5 billion a year to ensure its co-operation in preventing illegal immigration from Africa. But this rising nationalism is not only directed at minorities, but also at the loss of national autonomy that accompanies the European political union. Hungary's right wing Jobbik Party won 47 seats in elections this year -- up from none in 2006. Even in the liberal, tolerant Netherlands, the far-right Party for Freedom recently won more than 15 percent of the vote, giving it just seven fewer seats than the leading party.
A younger generation that doesn't remember the wars that tore Europe apart is more concerned with domestic issues and wonders if the benefits they are getting from the European Union are worth the trouble and the cost. A recent poll revealed that French citizens over 55 are almost twice as likely to see the E.U. as a guarantee of European peace as those under 36.
According to Kupchan:
"If these trends continue, they could compromise one of the most significant and unlikely accomplishments of the 20th century: an integrated Europe, at peace with itself, seeking to project power as a cohesive whole. The result would be individual nations consigned to geopolitical irrelevance -- and a United States bereft of a partner willing or able to shoulder global burdens."
We wrote extensively in previous Premium Updates on the problems of the Eurozone when what seemed to be a local worry about the debt burden of one of Europe's smallest economies had quickly glitched into a global mess. The crisis ricocheted from country to country in seconds, as traders dumped almost everything. The only thing that held steady and climbed up in those terrifying day was gold.
Recall that Berlin was very reluctant to rescue Greece and Chancellor Angela Merkel, stuttered, hemmed and hawed resisting the bailout for months, making the situation worse. Only after the Greek crisis threatened to swamp the Euro did Merkel override popular German opposition to the bailout and approve the loan. Her party was later punished in local elections.
"The E.U.'s rapid enlargement to the east and south has further sapped it of life. Absent the cozy feel the smaller union had before the Berlin Wall came down, its original members have turned inward. The newer members from Central Europe, who have enjoyed full sovereignty only since communism's collapse, are not keen to give it away."
Younger Europeans are opposed to participation in distant wars. Roughly two-thirds of the public in Germany opposes placing German troops in Afghanistan. Kupchan points out that giving Europe more geopolitical weight was one of the union's raisons d'être.
"Europe is hardly headed back to war; its nations have lost their taste for armed rivalries. Instead, less dramatically but no less definitively, European politics will become less European and more national, until the E.U. becomes a union in name only. This may seem no great loss to some, but in a world that sorely needs the E.U.'s aggregate will, wealth and muscle, a fragmented and introverted Europe would constitute a historical setback."
Economically, at least on the surface, things seem to be looking up for Europe. But keep in mind that economies can be like icebergs with lethal, unseen parts below the surface, like one common currency for very different economies. Euro zone economic sentiment hit a 28-month high in July with retail sales rising for the second consecutive month and at the fastest rate in two years, driving employment in that sector up for the first time since March 2008. And, as to be expected, Germany's exports are the locomotive pulling the train.
But below the surface we see plenty of problems and divergence among the European nations. While retail sales in France and Germany rose in the second quarter, sales in Italy fell. And while Germany heads towards fuller employment, the unemployment rate in the euro zone as a whole hovers around 10%. These divergences conceal a fundamental problem; dependence on the German export machine. That machine is now at risk of running out of steam as global markets shrink with reduced demand for goods.
We would like once again to refer to an essay titled A Greek Tragedy in the Making, published by the Ludwig Von Mises Institute (Austrian School of Economics.) which states that the Greek bailout sets the stage for far greater problems down the road than if the PIIGS were allowed to default and restructure their debt obligations.
The article states that the Eurozone will arrive at the same juncture again in about three years when they must pay interest on their current debt plus the one trillion in bailout dollars and repay the maturing debt.
Given that governments are reluctant to take their lumps now, what are the odds that they will do the right thing - outright default and debt restructuring - three years hence when the debt bubble is that much larger, the economy is in worse shape, and the pain of default and austerity is much higher than today's?
The Financial Times publishes a clever, interactive economic European weather map with symbols of either sun or black rain clouds to symbolize the various countries' economic health. Mouse over the country and you will see each county's data for GDP growth and unemployment projections.
For projections of what will happen in the near term in the precious metals market, let's turn to the technical portion of the Premium Update and begin with analysis of the Euro Index. We will start with the long-term chart (charts courtesy by http://stockcharts.com.)
Euro and USD Indices
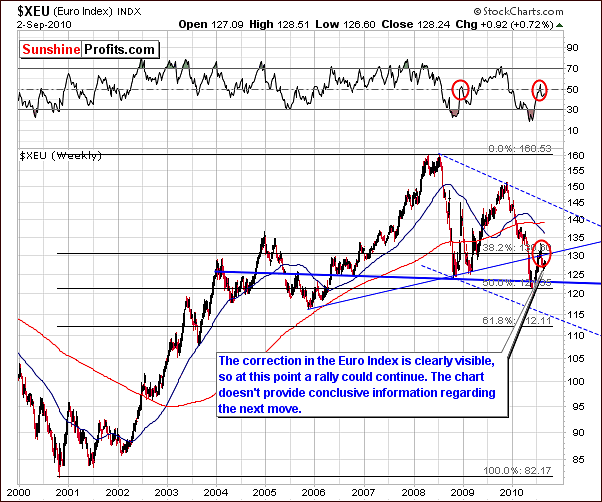
This week's long-term Euro Index chart reveals very little new information other than the clear appearance of a correction. Thursday's closing level for the Euro Index was .83% above last Thursday's close, rising 1.06 after falling in the previous five trading days by 1.01. In short, the index level is almost exactly where we saw it in our August 20 Premium Update.
The likelihood that the slight rally seen this week will continue is about 55% (in other words - slightly bigger than 50/50 situation that we've mentioned a week ago) based on our analysis of the pertinent information available at this writing. It is by no means a clear cut issue as we will further expound upon in our next section. There is still a fairly strong possibility that we may see the Euro Index decline from here.
The short-term Euro Index chart did not provide any further useful information this week and has therefore been omitted from this week's update. We will continue with the USD Index chart analysis.
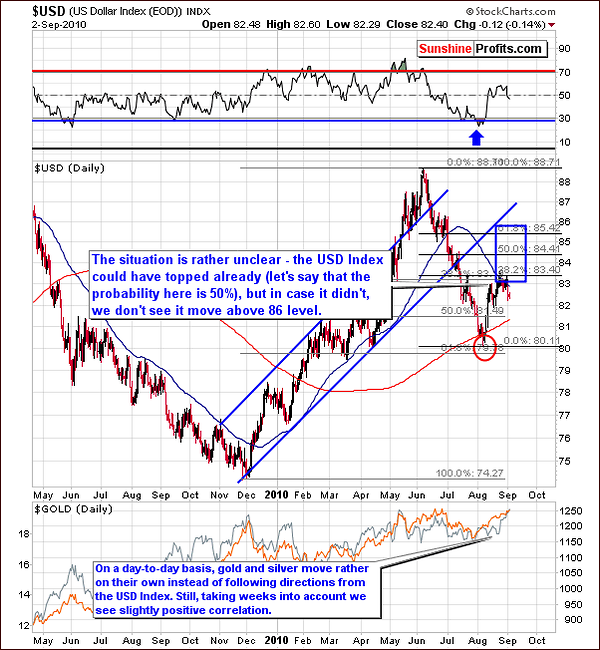
In this week's long-term USD Index chart, we see that the 38.2% Fibonacci retracement level which last week was called a possible resistance level does indeed appear to have stopped the rally at least for the moment.
The implication here is that we may be seeing the beginning of a correction although much depends on the direction of the Euro Index in the coming days. As we have stated on numerous occasions, these two currencies are very closely, albeit inversely related. Should the euro falter, an additional rally could very well be seen in the USD Index with a move back into the target area but likely rising no higher than the 86-level.
As far as the precious metals sector is concerned, the uncertainty in the currency markets could possibly have a somewhat bearish effect upon gold, as gold was recently mostly euro-weakness-driven meaning that it moved more or less in tune with the USD Index, but these moves did not take place exactly at the same time. Furthermore, as we mentioned last week, the 50-day moving average seems to have provided at least some resistance to further upswings in the USD Index. The effect upon gold, silver, and mining stocks, however, is far from clear as will be further seen in the Correlations section of this update.
Summing up, the outlook for gold, silver, and mining stocks is somewhat bearish for the near-term with regard to the uncertainty in the major currency markets.
General Stock Market
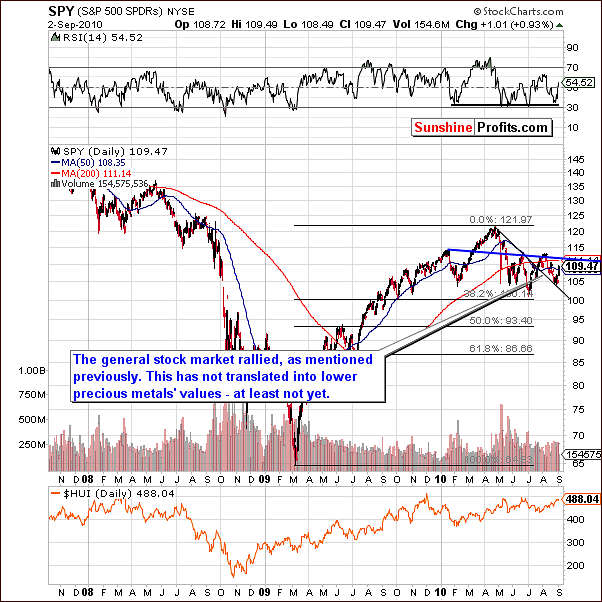
The long-term general stock market chart shows an upward direction for the first time since early to mid-August. The 4% rise which was seen in the past week was somewhat expected given previous weeks' trends. Recall that in our last Premium Update, we stated that "stocks have recently declined and have reached expected target levels on the downside. RSI, price levels and volume indicate a possible turnaround within a few days and higher prices forthcoming." This is exactly what happened although the expected lower prices for gold, silver, and mining stocks have not yet materialized. This will be discussed in detail later in the precious metals sections themselves.
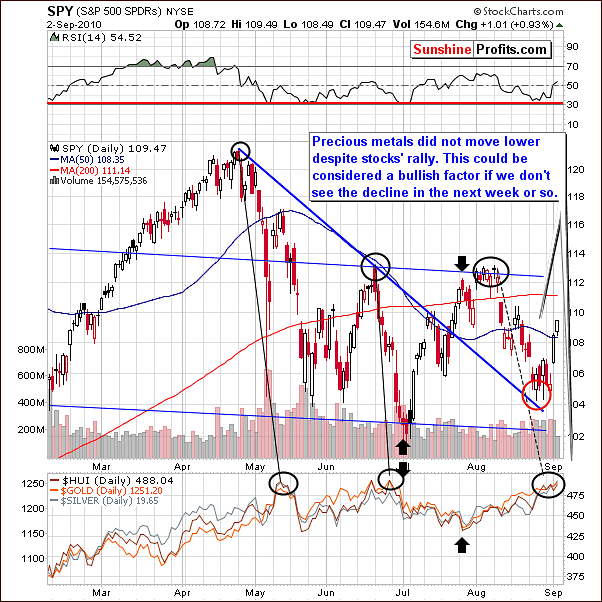
From this week's short-term chart, we see some implications for gold, silver and mining stocks. As we stated previously, price declines were not seen this week in spite of the large rally in stock prices. This could be a sign of strength and a bullish factor if no decline is seen in gold, silver, and mining stocks prices in the week ahead.
One point to remember here is that although correlations have been seen between precious metals and the general stock market, the timing of local tops and bottoms have not generally coincided. For example, when stocks topped out in July-August, the bottom in precious metals was seen two weeks later. The point to be made here is that the correlation between stocks and precious metals is not on a day-to-day basis.
If no other signals were indicating otherwise, what we have stated thus far would be reason to support a bullish sentiment for gold, silver and mining stocks. This is however, not the case and caution is still advised for the near-term.
Summing up, the implications of the general stock market's recent upswing are mixed with regard to the precious metals. It is a slightly bullish indication in case that declines have not been seen recently. This is not overly significant, for as we stated above, there is not a direct day-to-day relationship between the two markets.
Correlation Matrix
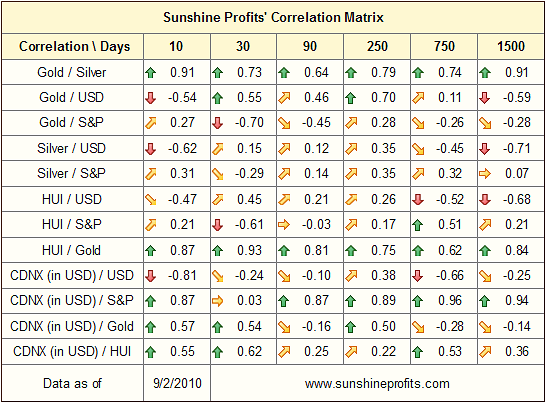
In the Correlation Matrix this week, note the negative coefficient between gold and the general stock market. This is also the case for gold stocks and HUI Index, which is traditionally positively correlated with stocks. This has not been the case for the past 30 days and is especially true with respect to gold. In the 30-day column, the correlation coefficient continues to indicate likely decreasing gold prices soon to be seen given the short-term strength in the main stock indices.
Gold
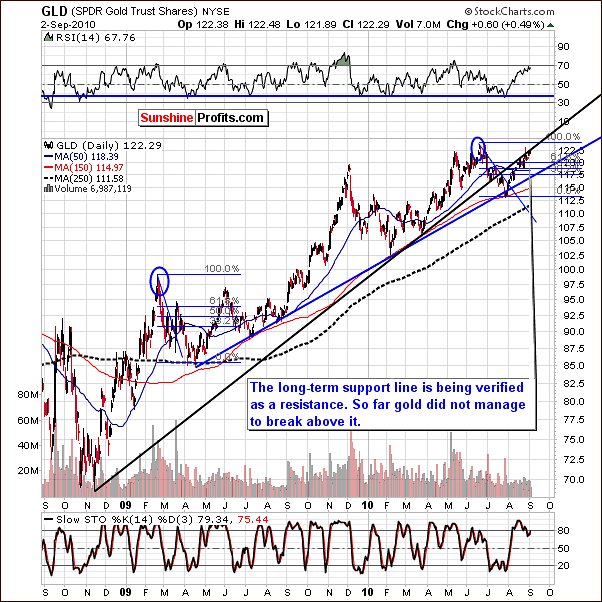
The long-term rising resistance line appears to continue to be holding gold‘s rally in check. The current trend is very similar to what was seen in June, 2009. The subsequent decline at that time was close to 5%. Additionally, the current RSI level of 70 has coincided with local tops at many times in the past, most recently May 2010, as well as in December, October, September, June and February, 2009.
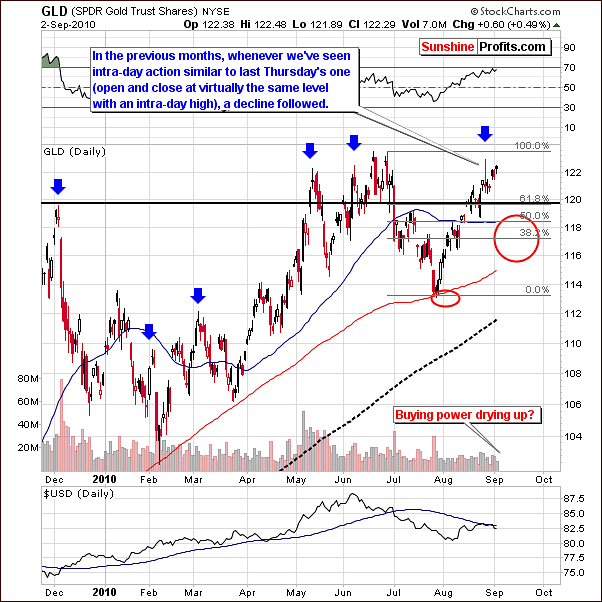
In the short-term chart this week, we have revised our downside target area as a result of the strength shown by precious metals recently. The red ellipse in the chart coincides with an area between 116 and 119.
While this is not a technical indication by itself, please note how straight the rally has been - without any serious correction. Taking this alone into account should make you consider the correction as likely, even before analyzing anything else. Could the buying power be drying up right now? The analysis of volume supports this view.
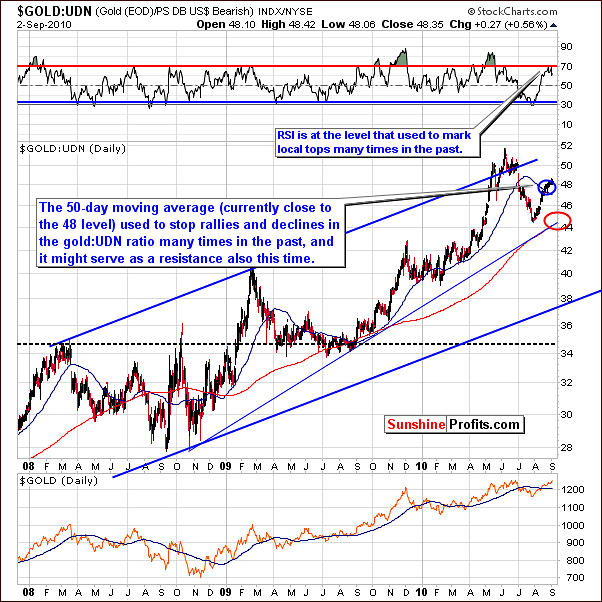
From a non-USD perspective, this week saw a very small increase of less than 1/10 of 1% in the GLD UDN Index level. As stated last week, the 50-day moving average is presently near the 48 level and has stopped rallies in the past. This may very well be seen again. Apparently, this could indeed the case here, as the ratio hovers around the 48 level.
Summing up, a correction still appears inevitable based on analysis using our normal charts and tools as well as incorporating new methods mentioned last week. Volume levels, RSI level and a study of similar previous trends all point towards a correction in the very near-term. Aside from these dependable indicators, the size of the current rally alone should make you cautious regarding any further gains.
September Rally
September has notoriously been the strongest calendar month for gold. Rather than accept this blindly, we have decided to delve into this in detail to see what factors could be used to explain this phenomenon. After all, statistics can sometimes be misleading (for instance if someone has a dog, then they both have 3 legs on average) and do have their drawbacks.
The following four charts show a ten-year history of gold prices. The months of August and September have been outlined as the focal points within each year.
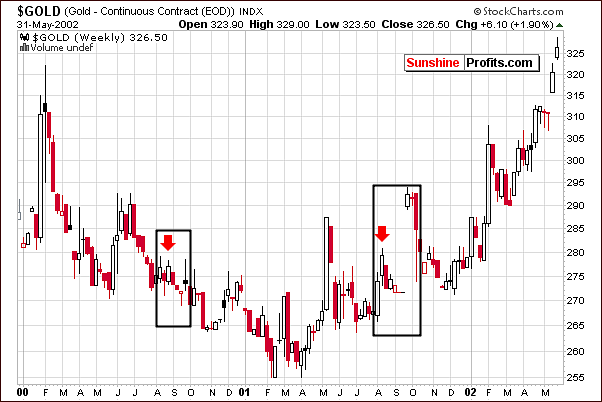
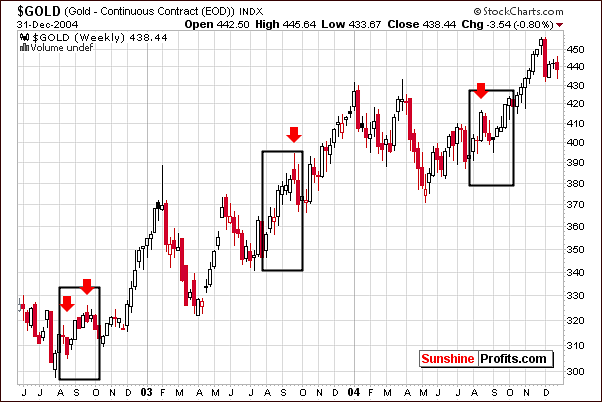
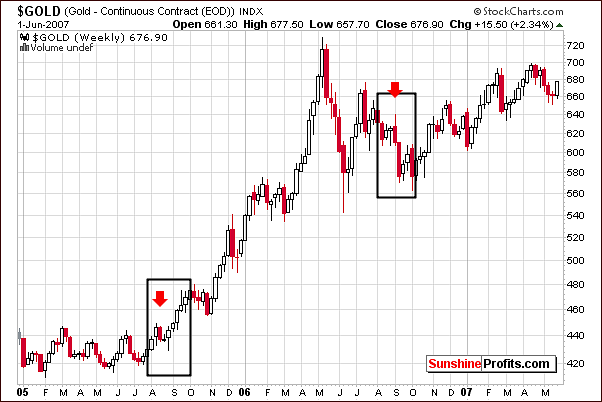
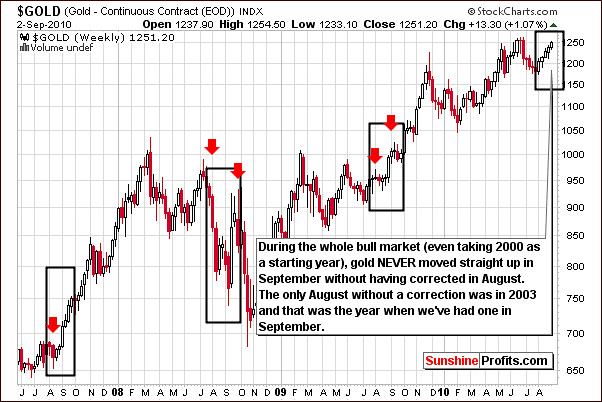
The most obvious pattern seen through the decade is the presence of August corrections in nearly every one of the ten years. So is the September rally nothing more than a reversal of August downturn? Not necessarily, as there are also fundamental patterns involved, but the move is generally amplified by the fact that gold was correcting in August, and that it is ready to rally. If so then the September effect could not play out in the way many investors expect it to (immediate surge in prices).
Let's take a look at 2003. There was clearly no August correction in that year, and there was no clear rally in September. In fact, the August rally resulted in a September correction. Does this seem at all similar to 2010? Have we not seen gold rally for the entire month of August? This is a clear sign that a correction in gold prices could very well be seen in the weeks ahead. Yes, it could actually be within the month of September.
Now, let's examine another possibility. Perhaps investors have been waiting to see a September rally based on historical trends. In other words - if there is going to be a huge September rally then why would I sell just before it. It is quite possible that if higher prices are not seen very soon, these investors will reluctantly liquidate their positions and this could be the impetus for a bigger correction in gold's price. The outlook for gold appears to be more bearish than bullish when all these factors are considered.
There is another fact that simply cannot be omitted. On average, the rally starts in the middle of the month, as you can see this clearly on the chart below.
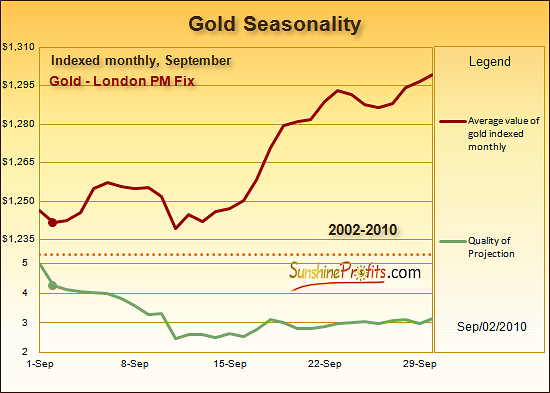
Please note that even if we agree that gold is to rally in September and the rally will be strong - the odds still favor that taking place in the second half of the month.
Silver
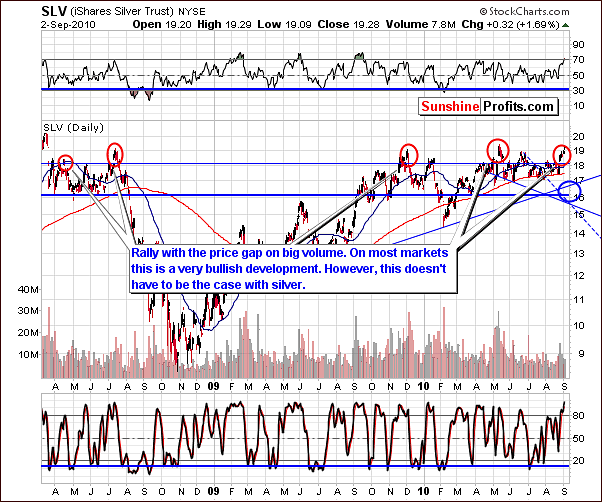
This week's long-term silver chart shows that in the past, rallies of this magnitude are frequently followed by sharp declines. This was seen in early 2009, again in June, December 2009, and once again in May 2010.
Silver's price is but ½ of 1% higher than in mid-May, nearly four months ago. This sideways price movement seems likely to be simply delaying the obvious needed price correction to atone for the rally seen last spring in which silver's price rose nearly 33%.
As mentioned in several previous updates, "silver analysis is quite tricky and frequently, the typical market signs do not apply. General speaking, a separate interpretation is needed when concerning the white metal. Volatility is commonly seen as well when analyzing silver's charts."
Consequently, analyzing the gold market and corresponding equities should prove useful even if one is interested in silver only.
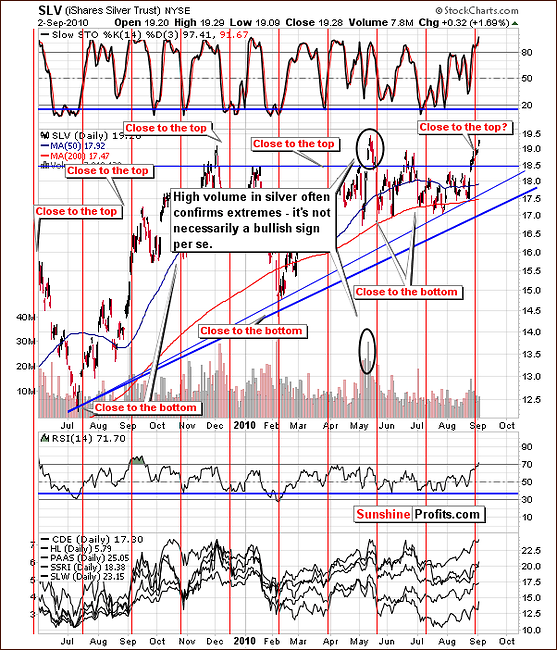
The short-term chart this week shows little of significance other than the proximity to a local top which does seem to be very likely. As is usually the case, the vertical red line is normally close to a turning point for the white metal and thus we expect a downturn or local top to be seen very soon.
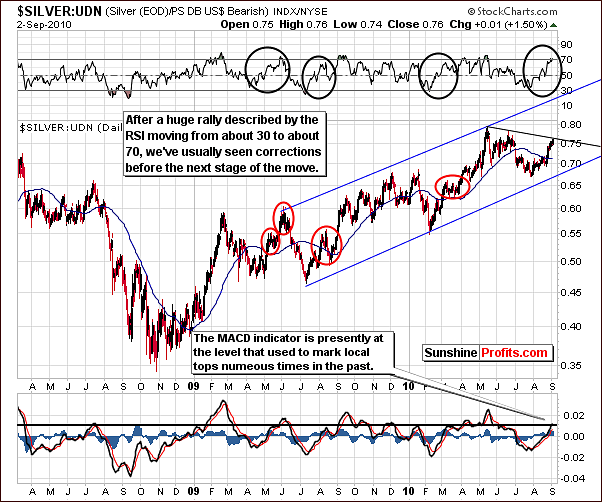
A relatively new chart (we did featured it previously, but it was the case months ago), which we have brought in this week looks at silver's price action from a non-USD perspective. Several points of interest are notable here. First, the resistance level created by a line connecting the May and July local tops is very close to today's closing level for the silver:UDN ratio. Secondly, the RSI is nearly right at the 70-level, having risen from about 30 in just over a month. Please note that in the past this meant at least a weekly correction.
Finally, the MACD in the lower level of the chart is near the horizontal black line around .01. All of these factors have coincided or indicated local tops on many past occasions. This is further, consistent indication that a strong possibility of a local top exists for the very near-term.
We need to take a closer look at gold for timing details because at volatile times in silver actually anything can happen, so we need to use guidance provided by other markets than the price of white metal itself.
Summing up, silver's performance has been outstanding recently, but it is not uncommon for the white metal to have extreme volatility both ways in its price moves. An imminent correction is indicated by numerous factors and there is simply no denying that this possibility is out there and investors should proceed with caution at this time until such a correction has been seen.
Precious Metals Stocks
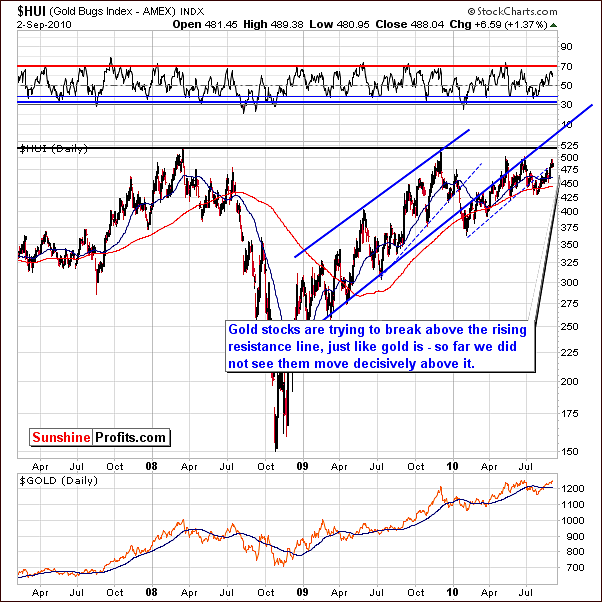
Once again this week, in the HUI Gold Bugs Index chart we see gold stocks again failed to move above the rising resistance line. This is quite similar to the scenario for gold itself in recent days. No decisive move higher has been accomplished either. The prices of precious metals stocks did move higher in the past days, but they did not break above significant resistance levels yet. We will now move to the short-term chart for more details.
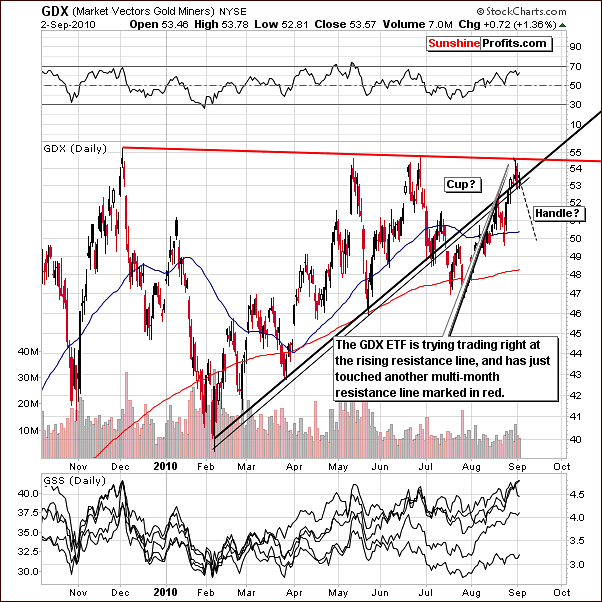
In this week's short-term GDX chart we see that mining stocks are right at the multi-month resistance level, which is indicated by a red line on this week's chart. In addition, the rising resistance line was also not broken. The indication here, therefore, is that lower prices are likely before any additional rally can materialize. Furthermore, lower volume levels may be an indication that buying power is drying up which would further support a likely decline in prices.
There seems to be some indication at this time that points to the possibility of a huge rally following the likely correction which we have been discussing. One factor, which supports this hypothesis, is the possible formation of a cup-and-handle pattern in our chart. The cup portion of this pattern would actually be where we are today and the handle would be formed by a correction, which we see as a real possibility very soon. The likely bottom would then follow in mid-September with a subsequent rally in the weeks to follow.
Although this is quite speculative as of now, we are looking at all possibilities and feel that this is worth mentioning due to the positive risk-reward ratio, which it would present. Short positions could be closed and long position opened with great profit potential for those who are prepared if such an opportunity materializes as previously described.
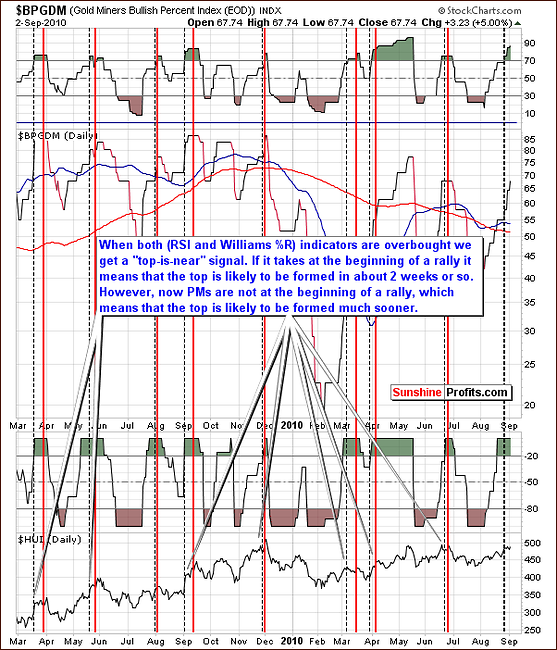
A frequent part of our weekly updates is the Gold Miners Bullish Percent Index. Although we do not include this chart every week (as it does not provide us with signals very often), it is a reliable way to analyze current trends. The Williams' %R and RSI together provide additional insight.
This week we see that we are in the overbought territory as measured by both abovementioned indicators. It seems that we are nearing a local top as these indicators point to a less than two week window before the top is seen. However, this two-week delay is seen generally when the index becomes overbought at the beginning of a rally. We are definitely not close to the beginning of the upswing, which suggests that the top could, in fact, be just days away. As we have stated on several past occasions, "this indicator has proven to be very accurate in the past."
Summing up, signals coming from the mining stocks indicate that a correction is very possible and may be seen very soon. This will quite possibly provide excellent opportunities for investors to enter the market with favorable risk-reward ratios and tremendous profit potential. We will continue to watch for these developments daily and inform our Subscribers accordingly when the situation warrants.
Juniors
As stated in the Key Principles section, the list of top juniors will be updated approximately every 4 weeks, so this is the Update that should contain the revised version of the list. However, before providing you with details, we would like to comment on this sector's performance in general.
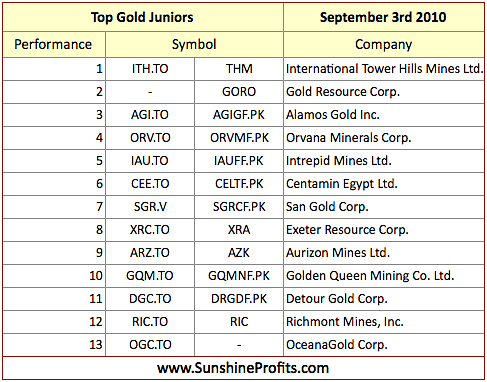
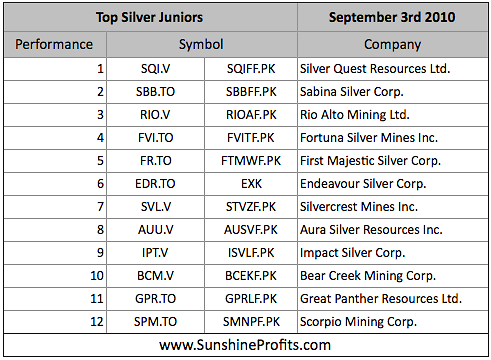
Once again, there are virtually no changes since the last month, meaning that the stocks that were strong (on a comparative basis) last month are still holding relatively well (especially when taking into account Gold Resource Corp., SQI.V and RIO.V which are highly ranked on our Gold and Silver Juniors lists). Therefore, if you've been taking our rankings into account when selecting junior stocks to your portfolio, it seems that you will not need to make significant adjustments this month. The fundamentals didn't change in a way that would make significant adjustments necessary.
On a general note, juniors have been outperforming senior gold stocks in the past few weeks, which confirms our previous observation (also visible in the correlations matrix above) - namely, that the junior/senior ratio is highly correlated with the general stock market. This means that the question if one should favor juniors over senior mining stocks (for instance AEM, GOLD, GG) depends on what one believes is going to happen next on the general stock market.
As mentioned earlier the main stock indices are currently at the crossroads, which means we will need to wait and see how the situation plays out. For now, the short-term trend is up, but let's not forget the long-term bearish signals from the Hindenburg Omen that we've described previously. Please note that our SP Junior Long-Term Indicator has been suggesting holding juniors since June. In previous Premium Update containing our list of top juniors (the one from August 6th 2010) we were seeing this particular indicator below dashed line and starting to rise. Now it clearly continues its upswing further confirming buy signal.
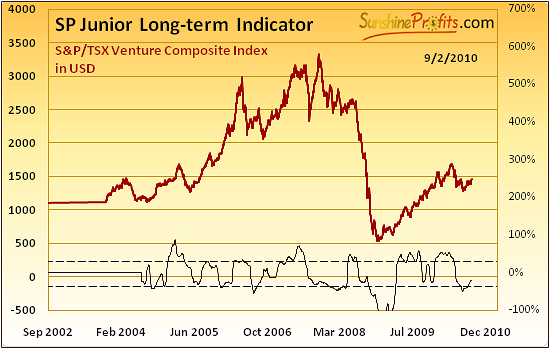
As a quick reminder - the buy signal (for juniors; switch from senior stocks) is given, when indicator is below lower dashed line and starts to rise (the indicator has been falling for 3 consecutive days and rises on the following day). The sell signal (for juniors; switch to senior stocks) is given, when indicator is above higher dashed line and starts to fall (the indicator has been rising for 3 consecutive days and falls on the following day).
Other information
This week's developments encouraged our Subscribers to ask us several important questions, to which we've partially replied earlier in this update. However, we've decided to answer to some of them separately.
First question from one of our Subscribers was about what the next step should be if someone has already sold his whole position in the PM stocks and is now wondering if he should get back in, just in case the market is going take off instantly. Well, the answer is that, yes we believe that one should get back in with at least half of one's capital on the long-side of the market. While we still believe that the correction is likely to take place, this does not mean that we've stopped believing that diversification is a good way to go, and - most of all - that one should use only a fraction of one's holdings for trading. And then - out of the speculative part of one's holdings use only a part for each trade. Please refer to our Key Principles section (that's why we called them key principles), especially taking into account diversification.
In the abovementioned case, getting back on the long side of the market with most of one's capital means re-investing one's long-term holdings - the risk here is being out of the market. Once again - most investors would be better off diversifying between both speculation and investment.
Another Subscriber asks us if it would be good idea to take some short-term profits from gold stocks (meaning long positions here) and buy back after the coming dip. In this case the odds favor simply sitting tight. If one has already a small speculative short position in the mining stocks and/or metals, we don't think that one should increase it, especially by moving one's long-term holdings. If you don't have speculative short position in mining stocks you can sell some of your long-term holdings, however, please bear in mind that this means moving some of your long-term capital into the speculative category. Make sure that it will be a small amount (definitely not more than 1/3 of holdings would be appropriate to most investors).
Earlier this week we've received question about our charts and if their compression could affect our point of view. Not really, as we are always using logarithmic scale, which is more appropriate when analyzing very long-term trend, because it emphasizes percentage gains instead of nominal gains. For instance, when analyzing the beginning of bull market, 10% move could be translated into $20 up- or downswing, which now could be just two-day move and considered as meaningless noise. Today 10% is translating into somewhat bigger up- or downswing amounting to approximately $120 - that would surely be a significant move. Additionally, if please remember that the technical analysis is always analyst-dependent and very subjective, so at times you it might be the case that two analysts analyzing the same chart could see two different patterns.
Another question was about Kitco and if its website traffic is good way to estimate detailed turning for short-term trade in gold and silver market. Generally, Kitco's traffic numbers are useful when measuring long-term trends, but that is not really the case in the short-run. That is the case, because short-term data might be influenced by recently launched marketing campaign or some link from another website to Kitco driving number of visitors much higher. This could give us a spike in website's traffic not necessarily related to precious metals market itself. This particular phenomenon could provide us with additional data when analyzing long-term patterns and point us to favorable long-term entry points. In fact we focused on that in our very first essay that we posted about three years ago on SunshineProfits.com -Kitco's web traffic and how can you profit on it.
Naturally, we've also received questions about the silver market and its ability to spike very high (caused by COMEX squeeze, default of the large institutions shorting silver etc., which would cause silver to soar perhaps above $30 within several days) and not correct this movement in the short run. The question was if we are sure that we will be able to tell when this could occur. The answer is that of course we are not confident that we will be able to tell you when exactly it would happen, as nobody can be sure about their ability to predict future. Not only do we realize that fact, but we've also taken steps to make sure that you are not really affected by this obvious imperfection. Namely, by encouraging our Subscribers to use part of their holdings to buy real gold and silver bullion products, and then to use the rest to diversify between long-term investments and speculation. This way you are still exposed to silver's sudden appreciation while leaving only small part for speculation on the short-term price swings. In a way, this could be viewed as us encouraging you to hedge yourself against us not being able to spot this big move. Might sound a bit twisted, but this is what we believe is a right (and most likely - profitable) thing to do.
How about usefulness of TA - technical analysis (most of what you read on this updates is based on the technical analysis, to which we add our own specific tools) at this particular moment? Could the fundamentals be changing around the world (given quantitative easing, Europe's problems, China's rapid growth, and so on)? Is the reliability of this analysis affected and consequently should one be hesitating to use it?
Well, the most important fundamental that does not change over time is human psychology and emotionality of individual investors. This is something by far more stable that one, two, or even three quantitative easings are not able to change. Will China's growth cause people to stop being greedy when they see higher prices and fearful when they see them decline? Will Europe's problems cause people to act by means of cold logic only? Definitely not. Moreover, even if TA will someday cease to be useful it is highly improbable that it will happen quickly. Certainly, it is not a matter of weeks, months or years because TA's foundations are based on real mechanisms, which are inherent part of each human being.
Finally, we've received feedback from one of our Subscribers, telling us that he is starting to doubt his short position. He noticed that this could be sign that the rally is about to end. Before commenting, we would like to congratulate the ability to take a rather objective perspective on one's emotions here. This type of approach comes, with experience - having been in this situation many times in the past. Many of us already know that when one is getting discouraged with their position, the market is finally close to move in desired direction. Please recall what happens just after one is closing this kind of position. Such turning points are closely related to high emotions of investors, which are present exactly around turning points. That is how the bull market works and how corrections take place. By the way, this is why we are using technical analysis - it allows one to look at the above-mentioned emotionality from a bigger perspective and profit on it instead of being driven by it.
Summary
While the general stock market has rallied significantly this week, gold, silver, and mining stocks have avoided any significant declines. However, numerous signals still indicate a correction is a real possibility soon.
There is a chance that the period following an eventual correction will present investors with a tremendous opportunity with respect to risk-reward ratios and profit potential. Sunshine Profits will stand ready with our Market Alert capabilities should important developments occur before next week's update.
This completes this week's Premium Update.
Thank you for using the Premium Service. Have a great weekend and profitable week!
Sincerely,
Przemyslaw Radomski

