
The best thing we read this week is the opening paragraph in an Op-Ed piece by veteran New York Times correspondent Thomas L. Friedman who wrote the following:
Over the past few weeks I've had a chance to speak with senior economic policy makers in America and Germany and I think I've figured out where we are. It's like this: things are getting better, except where they aren't. The bailouts are working, except where they're not. Things will slowly get better, unless they slowly get worse. We should know soon, unless we don't.
China Passes Japan as Second-Largest Economy
But one thing we know for sure. It's official. After three decades of spectacular growth, China has just passed Japan in the second quarter to become the world's second-largest economy behind the United States. It's hard to believe that just five years ago, China's gross domestic product was about half of Japan's. The news came as no surprise to anyone. This is the most striking evidence yet of China's ascendance in the global economy. China is already a major driver of global growth and the rest of the world has to contend with this rising economic superpower and its voracious appetite for natural resources.
Let's not forget that China's population is culturally conditioned to value gold and that the Chinese government would like nothing better than to exchange some of the country's tall mountain of dollar reserves for yellow metal. China is buying their gold from local production, the largest in the world. The government recently took steps to liberalize the gold trading and buying system in a move to encourage the rapidly growing newly-enriched middle classes to purchase gold.
There are those that forecast that China will pass the United States as the world's biggest economy as early as 2030. (Goldman Sachs says by 2027, PricewaterhouseCoopers says by 2020).
Although its economy is still only one-third the size of the American economy, China passed the United States last year to become the world's largest market for passenger vehicles. China also passed Germany last year to become the world's biggest exporter. It is ironic to think that in the 1980s there were predictions that Japan's economy would someday overtake that of the United States. Japan's economy, the world's second largest for the past four decades, has been pushed into the No. 3 slot. Japan has held the No. 2 spot, after the United States, since 1968, when it overtook West Germany. After World War II, the country rose to become a global manufacturing and financial powerhouse. But its "economic miracle" turned into a huge real estate bubble in the 1980s before imploding in 1991. What followed next a decade of stagnant growth and economic malaise, from which the country never managed to recover. The story this week about China's ascendancy into the number two spot is as much about Japan's gloom as it is China's boom.
The new milestone came early Monday when Tokyo announced that Japan's economy was valued at about $1.28 trillion in the second quarter, slightly below China's $1.33 trillion. In recent years China raced ahead of Germany, France and Great Britain and its economy is forecast to expand about 10 percent - continuing a remarkable three-decade streak of double-digit growth.
Chinese Workers Among the Poorest in the World
Here are several things to keep in mind. China is in the process of urbanization, has a much lower standard of living and has a lot of room to grow. China's per capita income of about $3,600 puts the typical Chinese worker behind workers in 126 other countries. The Chinese worker's income is more on a par with those of impoverished nations like Algeria, El Salvador and Albania than that of the United States, where the per capital income is about $46,000, or Japan, where the typical Japanese worker earns about $39,000. The wealth gap between the elite, who profited most from three decades of reform in China, and its poor majority is so extreme that China has dozens of billionaires while average income for the rest of its 1.3 billion people is among the world's lowest. Despite the impressive numbers, China uses over four times as many citizens as America to produce less than half America's output.
Eswar Prasad, professor at Cornell University, was quoted in an article this week in The Economist:
There are virtually no historical parallels for a country that is so large and dominant in absolute terms and yet that lags far behind many other countries in terms of per capita income and other indicators of development. There is still a yawning gap in per capita income levels between China and the advanced economies and, even at present growth trajectories, it will take a generation for China to achieve the level of development of advanced economies.
The Chinese Need to Start Consuming
The gap could spell trouble for the future. Economists say that China's economy is too heavily dependent on exports and investment and that it needs to encourage greater domestic consumption. But the vast majority of Chinese workers can't afford the cell phones and new cars. The vast majority are still extremely poor. And even with the rash of suicides among desperate Chinese workers and the agitation for higher wages, it will be a long time before China will be able to consume a larger portion of the stuff that it keeps producing. If the wages and purchasing power of Chinese households continue to drag behind the country's ability to produce goods, this could spell global trouble.
Robert Reich, America's 22nd Secretary of Labor and a professor at the University of California at Berkeley, explained this point in an essay posted on Nouriel Roubini's website.
Think of China as a giant production machine that's growing 10 percent a year (this year, somewhat less). The machine sucks in more and more raw materials and components from rest of world - it's now the world's #1 buyer of iron ore and copper and close to the #1 importer of crude oil - and spews out a growing mountain of stuff, along with huge environmental problems.
But because the Chinese consume a smaller and smaller proportion of this stuff,it has to beexported to consumers elsewhere (Europe, North America, Japan) to keep the Chinese working. Much of the money China earns by selling it around the world is reinvested in factories, roads, trains, and power plants that enlarge China's capacity to produce far more. Another big portion is lent to or invested in the rest of the world (helping to finance America's budget deficit at very low cost).
But this can't go on. China's workers won't allow it. Workers in other nations who are losing their jobs won't allow it, either.
The answer is not simply more labor agitation in China or an upward revaluation of China's currency relative to the dollar. The problem is bigger. All over the world, we're witnessing a growing gap between production and consumption, while the environment continues to degrade. The Chinese machine is fast heading for a breakdown only because it's growing fastest.
This week we sent out two Market Alerts saying that the odds for a local top in the gold price have increased to 70%. Since you are all probably anxious to know if anything has changed and what the immediate future holds for the price of gold, we will turn to the technical portion of the Premium Update and begin with analysis of the Euro Index. We will start with the long-term chart (charts courtesy by http://stockcharts.com.)
Euro and USD Indices
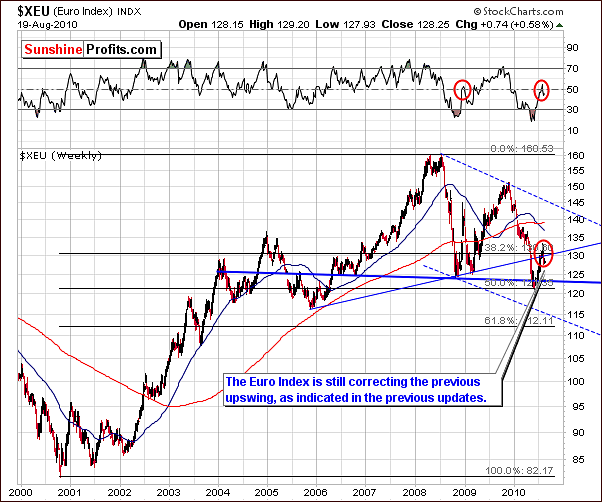
The long-term Euro Index chart this week reveals very little new information. Things have pretty much remained status quo since our last update.
In each of the past two Premium Updates, caution was suggested and a period of consolidation was termed likely. "For the short-term we remain skeptical towards a continuation of the rally in the Euro Index until we see confirmation for a breakout or consolidation. The latter still appears more probable."
The situation is unchanged and this statement therefore holds true once again this week. The correction is still in progress and it is not uncommon for periods of this type to continue for several weeks. Details regarding previous correction periods can better be seen in the short-term chart which follows. We also have some developments worthy of discussion in the following paragraphs.
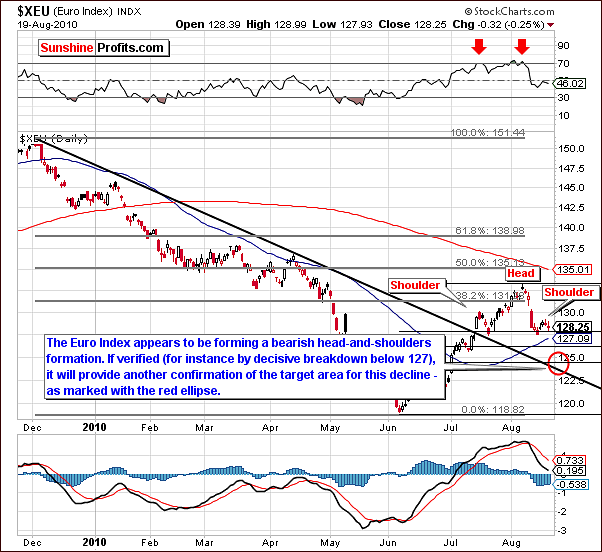
The short-term Euro Index chart this week indicates a possible head-and-shoulders formation and thus allows a target level to be projected utilizing technical analysis of this bearish development. The head-and-shoulders pattern, which we have discussed on many past occasions, seems to be well in progress, having begun to form sometime around mid-July. By projecting (taking the height of the "head" and applying it below the "neck" level) likely short-term direction, a target level can be estimated in the 123-124 range.
The next few days will confirm or refute the validity of this hypothesis and thus the accuracy of our stated possible target level. The odds of that happening are further increased because of the presence of the black declining resistance line and also the 61.8% Fibonacci retracement level in the area marked with red ellipse.
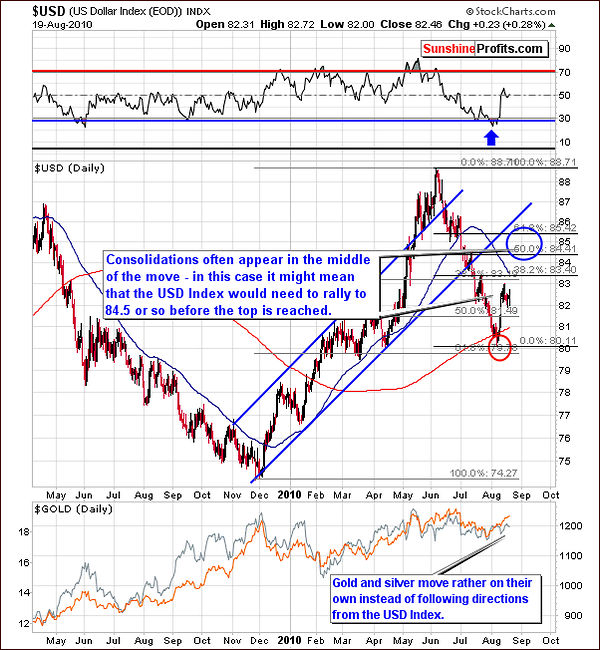
In this week's long-term USD Index chart, we see some consolidation after last week's small rally (reflection of the current consolidation in the Euro Index). Since these consolidations often take place in the middle of the move, we might expect the recent rally to take the dollar higher to 84.5 or so. Similar examples can be seen - in a bigger way - in the recent December to June prolonged rally.
The rally itself lasted for nearly seven months and it included one big consolidation - from Feb to April 2010, which was right in the middle of the move.
Again, it is likely that the USD Index will move higher very soon. The probable downtrend for the euro, which we discussed previously, is an important contributing factor to the dollar's likely near-term direction. By comparing the current rally with that seen earlier in 2010, a target for the top of this USD Index rally seems to fall in the 84-85 range. The main determining factor here is the assumption that this current consolidation period is somewhat near the mid-point of the rally. It is important to note that the term mid-point refers to index levels which may or may not correspond to mid-points in time.
Precious metals have, for the most part, been moving on their own lately. It is possible, however, that their turning points could coincide with those of the USD Index.
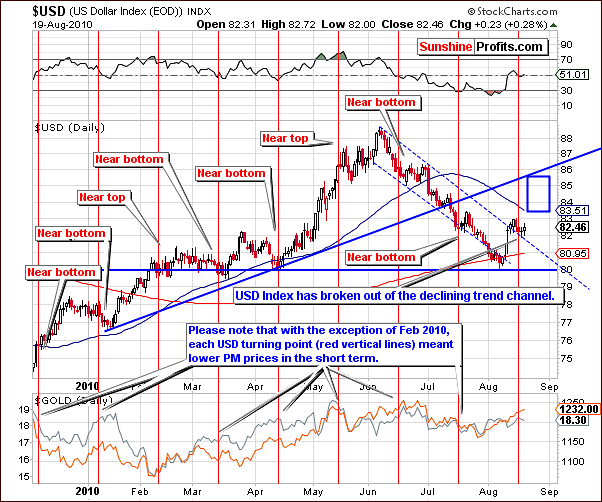
In this week's short term chart, there are two developments worthy of note. First, the break above the declining trend channel has been verified this week. We have seen several consecutives closings above this level, which was surpassed last week. It is likely that the dollar will rally from here.
The second observation clearly seen in this chart is the vertical red line which indicates a likely turning point to the upside for the USD Index. A close inspection of recent turning points reveals that in seven out of the last eight, precious metals declined either immediately thereafter or in the next few days. Since we are in this position today, it is something which cannot be overlooked in our precious metals analysis and a decline in gold, silver and mining stocks therefore appears quite likely for the near-term.
Summing up, the likely trend for the Euro Index appears to be down. As is normally the case, this is bullish news for the USD Index and a rally may very well be seen here soon. Gold, silver, and mining stocks will likely see lower prices in the near- term. More specific information concerning precious metals markets will be provided in later sections of this update.
General Stock Market
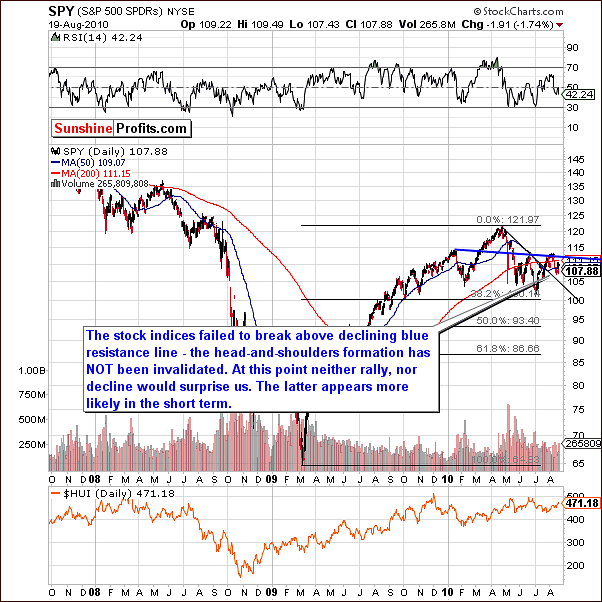
This week's general stock market long-term chart provides us with just a few noteworthy points. It is clear that the stock indices failed to move above the declining resistance line and the head-and-shoulders pattern has therefore not been invalidated.
To a great extent, last week's observations of the general stock market's long-term chart are still valid. We stated, in part, that "It is possible the SPY ETF will decline to the 90 level. We are, however, not overly bearish. Declines have been small, except on a very short term basis, and in reality, the declining black line has not yet been touched in the above, long-term chart. Although high volume levels have been seen confirming the downward move, it is uncertain at this time whether a bigger decline is likely. The next few weeks should clarify this.
At this point we are slightly more bearish on the general stock market than was the case a week ago.
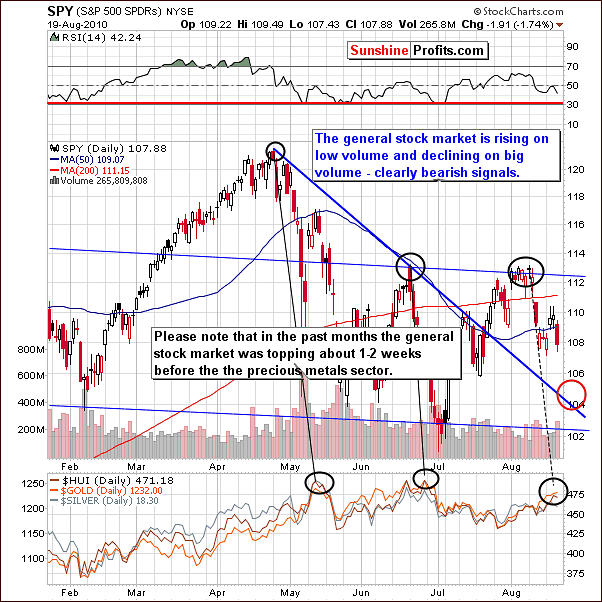
In this week's short term chart, there is much to discuss. First, a clearly bearish signal concerning volume must be addressed. Volume levels have consistently been low when stock prices rise and declining prices have been accompanied by high volume levels. As we have frequently pointed out in the past, this is a significant bearish indicator.
The declining support line created by several recent tops is also an important factor this week. Since it has formed over a three-month period and takes into account two well-spaced local tops, it is a valid technical support tool. The bearish volume indicators discussed in the previous paragraph along with the expected strength of the declining support line point towards a bottom target of 3-4% below Thursday's closing SPY level of 107.88 to around 104. This target level is noted on the short-term chart by a red ellipse.
Turning to precious metals, a most important pattern has been identified relating to market tops. It appears that the general stock market is actually leading gold, silver and mining stocks by 1-2 weeks with its local tops. That is to say, the local tops for precious metals have recently been seen shortly after the general stock market tops out. Local bottoms in these markets have more or less coincided with each other, but this does not hold true for local tops.
Extrapolating the recent local top for stocks seen in early August brings us to the realization that a local top for precious metals is very possible right now. This confirms points made in our Market Alert and messages published earlier this week. It seems likely that gold, silver and mining stocks will see a correction in the short term to levels close to or even below the July lows. The top may well be in already.
Summing up, the outlook is bearish overall for the general stock market as the majority of indicators point to probable declines in the near-term. At this point, there is little evidence suggesting a major decline, however, analysis of numerous indicators gives more weight to a likely downturn for the short-term.
Precious metals have likely seen a local top very recently and there is evidence supporting a downturn here as well in the near-term. The relationship between gold, silver, and mining stocks and the general stock market recently supports our bearish sentiment for precious metals in general for the near-term.
A side note: Much of the discussion in this week's update thus far has centered on the relationships between individual currencies and/or markets. We often cite the inverse relationship between the Euro Index and the USD Index as well as comment on the reaction of precious metals to the general stock market. Although we do not quantify the relationships per se, it is in actuality discussion of their correlations with each other.
Normally, each Weekly Update has a separate section with a table of correlation values. This section has been omitted this week as there is insufficient additional information provided by the actual correlation coefficients themselves which we have not already presented in discussion form.
Gold
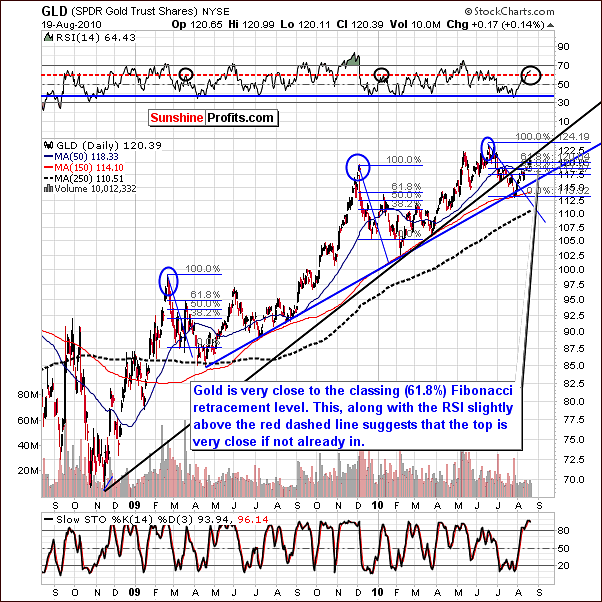
The long-term chart for gold this week provides some evidence in support of an imminent local top. The RSI has risen to levels which marked previous local tops. The GLD SPDR level is presently only slightly above the 61.8% Fibonacci retracement level, and the long-term resistance line (rising thick black line) is being touched right now.
Taking all factors into account, gold prices are likely to decline soon. It is possible that the local top is already in and this will become clearer in the coming days.
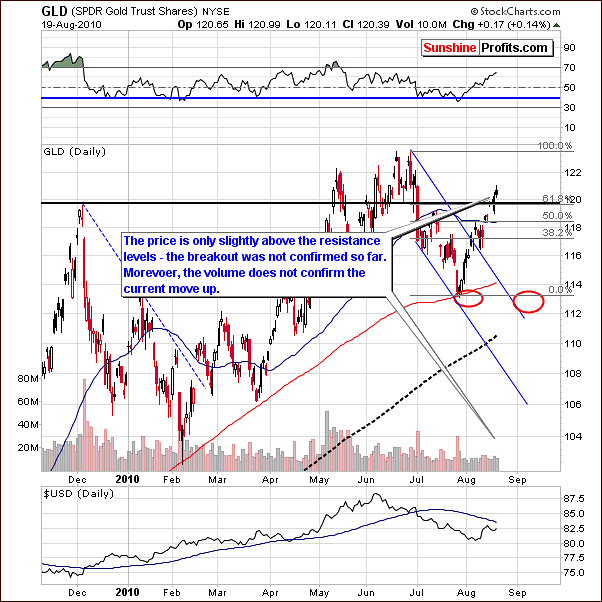
In the short-term chart this week, we see that the December, 2009 high was surpassed slightly, but the breakout was not significant, and by no means confirmed by the action in volume.
As noted earlier, it is common to see a consolidation or pause near the mid-point of a rally. Close inspection of the current rally reveals such a period about half way between Thursday's closing level and the previous local bottom.
We've received questions this week about the existence of a reverse head-and-shoulders formation that could be created based on early July low (left shoulder), late July low (head), and early August low (right shoulder). In our view, one should not apply this pattern here, as both "shoulders" are not really symmetrical and the "head" - July bottom was a quick spike, not a slow U-shaped bottom. Moreover, the existence of this formation is not confirmed by the volume.
A noteworthy change this week is seen in regards to a revision of the next downtrend target. We had previously based our estimate on a 250-day moving average, which was touched during the summer months during most years of this bull market. Additional lower support levels would then come into play.
The recent uptrend makes it rather unlikely that the correction will move as low as originally thought. We currently expect an early September bottom close to the 113 -114 are for GLD ETF (around $1,160 for spot gold).
As further details become available, we will advise our Subscribers in a timely manner. Before further committing to future market moves, it is imperative that we first see the decline begin. Once this takes place and we have confirmation that the top is past, the near-term and medium-term outlook will be significantly clearer.
From the non-USD perspective there are virtually no changes this week, so we will quote the following paragraphs from the previous update:
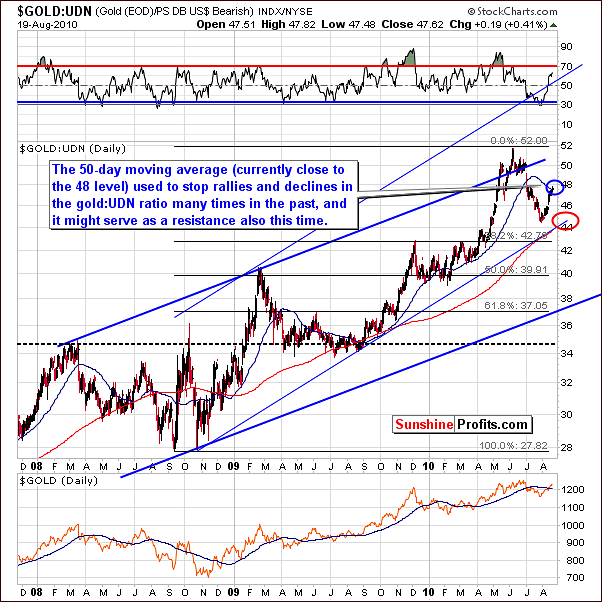
From a non-USD perspective (valuable for instance to Investors/Traders watching gold priced in the euro, sterling, or rupee), it also seems that gold is approaching a local top as is gold in USD. The 50-day moving average seems to be a resistance level. This average has provided strong support or resistance on many past occasions, so we shouldn't ignore it here.
Keep in mind that gold in non-USD currencies will likely trend similar to USD gold markets, that is local tops may very well coincide. Regardless of currency, gold Investors and Traders will be impacted in a similar fashion and Market Alerts will be issued when warranted to advise Subscribers of important developments in any and all world markets.
Summing up, it is likely that the local top for gold is in or very close to being in. Bearish indicators are in place for the near-term and if the expected downturn does not begin immediately, we expect it will be seen very soon. Much of the doubt present today will be erased once the downturn is confirmed. Additional confirmations of the points made above come from the analysis of other charts - for instance the one featuring silver.
Silver
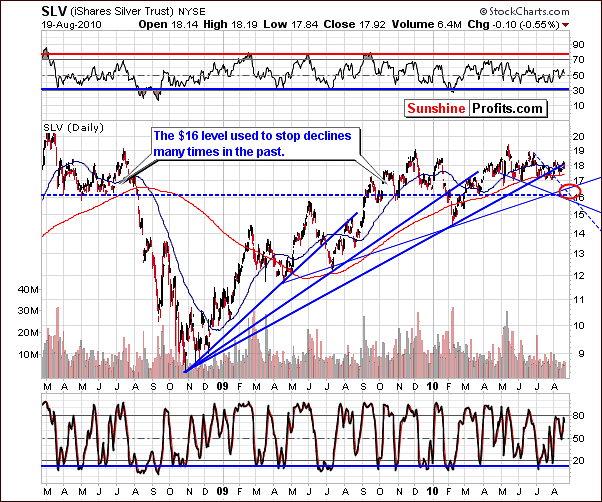
This week's long-term silver chart shows that the resistance level created between the August 2009 and March 2010 bottoms has been crossed and the move below is now even more likely. This is another indication that lower prices are to follow not only for silver, but to gold, and mining stocks as well. The target level may not be as low as $16; we will keep a close watch on gold prices to better formulate expectations for silver's next bottom. Last week's comment on this topic still holds: "We'll have to see how silver performs relative to gold...in order to mark the final bottom for this summer."
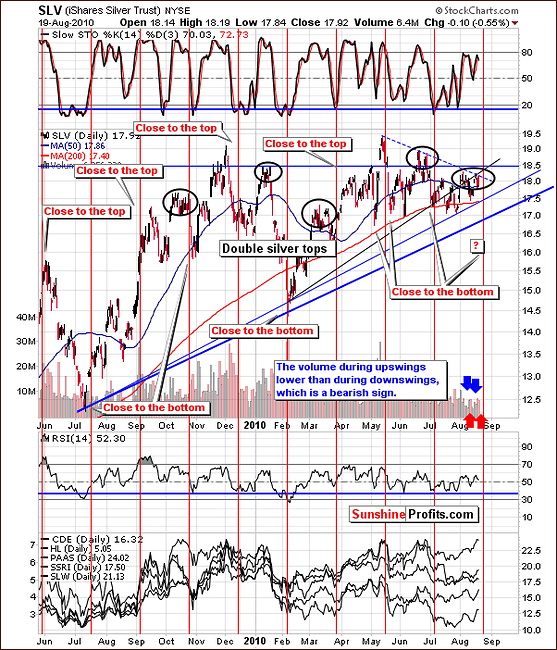
The short-term chart reminds us that silver is known for its double-top patterns. This has been mentioned several times in previous updates. The double-top and resistance levels' impact have now been seen. It is likely that lower prices will follow very soon across the precious metals sector.
Although not yet a certainty, it is likely that the top is already in for silver. Positive moves have been accompanied by low volume and price declines have shown high volume. A bearish sentiment is warranted for the near-term.
Summing up, silver has likely topped or will reach a local top very soon. Recent moves and volume levels support a decline and the bottom target level could be above the prior estimated $16 level.
Precious Metals Stocks
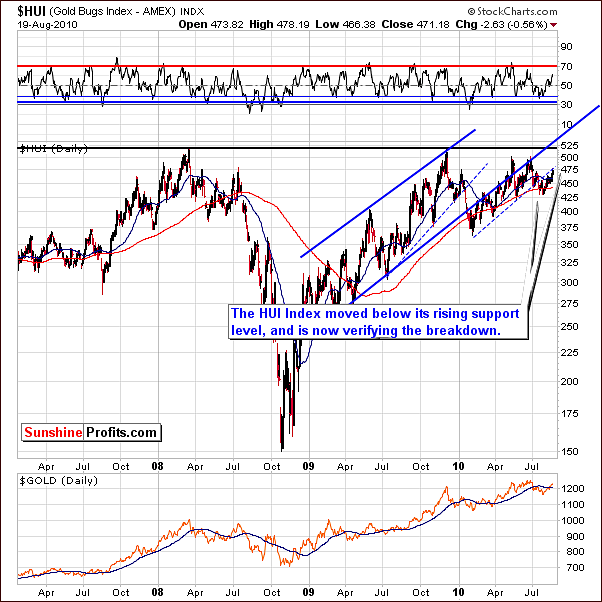
The HUI Gold Bugs Index has changed little from last week. The move below the rising trend channel has been verified and the outlook is bearish for the near-term. Much lower prices are possible. As was the case last week, we will see more details in the GDX SPY section to follow.
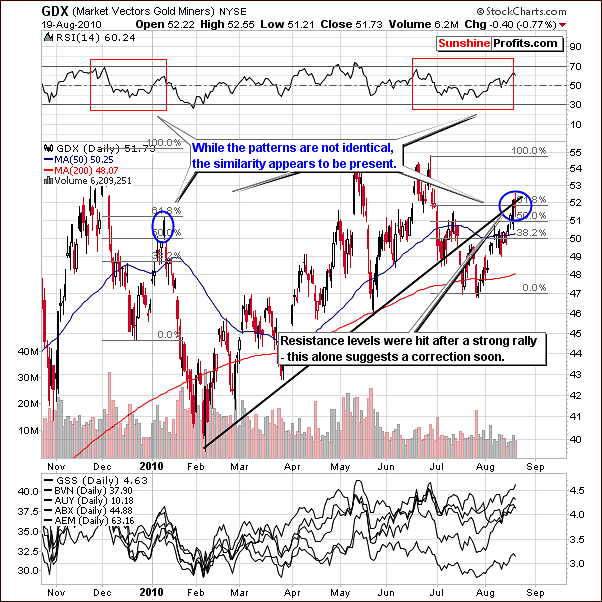
This week's short-term chart confirms that the top is likely in. The 61.8% Fibonacci retracement level has been reached and so was the multi-month black support/resistance line - they were touched, though not surpassed. If the top is not in, it seems to be very close to being in.
The Market Alert issued earlier this week is still very up-to-date. Throughout this week's update, we have repeatedly seen evidence in support of local tops being reached throughout the precious metals sector.
Other Charts
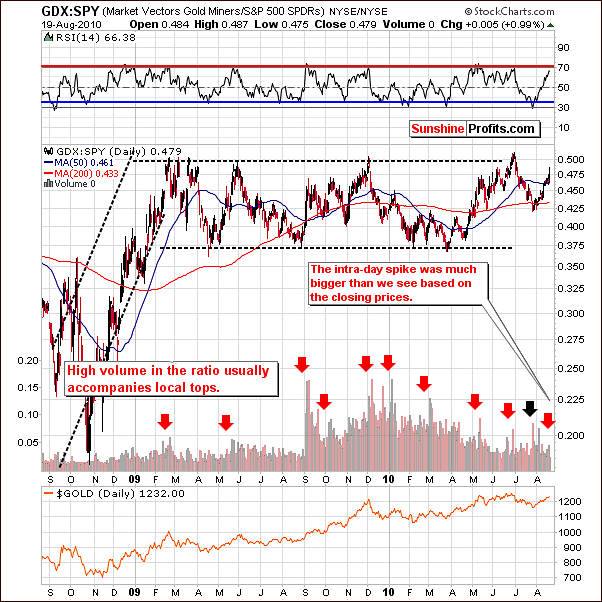
The GDX to SPY ratio quantifies the performance of big, senior PM stocks relative to all other stocks included in the S&P 500 Index. A strong rally has been seen of late, and the RSI has risen close to 70. This has corresponded to local tops in the past and furthermore, a resistance level is being approached. It is very likely that the local top has been reached, and the single spike seen recently in volume further supports this theory.
This week's Market Alert discussed "going short" based on volume levels and the intra-day details further support this call. High volume generally correlates with local tops, although it is not required. Please note that the spike in the volume of the ratio is not visible on the above chart, as it is based on the daily closing prices, not intra-day extremes. This doesn't change the implications for Precious Metals Traders, which are short-term bearish.
The last, but definitely not the least chart in today's Premium Update is something new in our analysis. While trying to examine the market from as many angles as possible, we've checked how juniors are performing relative to the general stock market, and once we spent some time pondering on the following chart, it occurred that it is actually a very good indicator of market's sentiment.
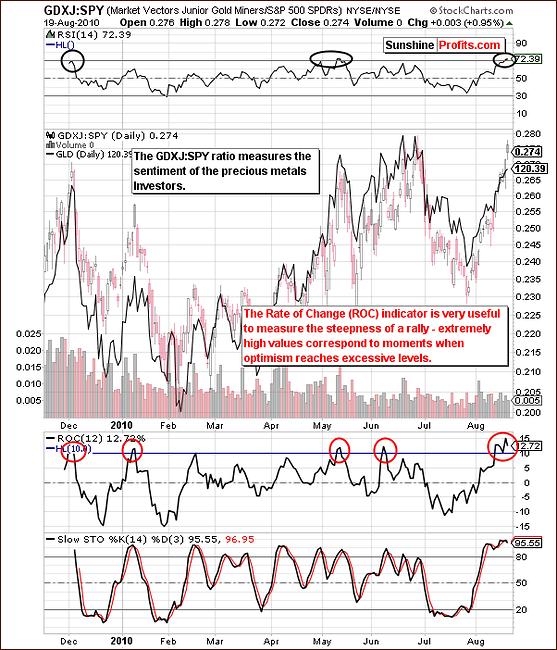
The GDXJ ETF is the junior counterpart of the well-known GDX ETF, and its performance relative to other stocks quantifies the part of the performance of junior sector (small-cap, small-volume, early-stage companies) that can be attributed to individual investors' perception of the market.
Most institutional investors are not involved in this market due to company size, monetary constraints, and other regulations. The buying pressures, therefore, lie mostly on individual investors who are naturally more emotional most of the time (!). It is likely that this ratio is very much an emotional barometer of individual gold and silver investors.
Since the general stock market drives the prices of these small cap companies, the ratio is calculated by dividing by the SPY. This isolates the influences of other stocks. If the ratio rises, the indication is that investor's sentiment is high. This, in turn, allows us to analyze moments when the optimism is excessive in order to take the opposite position as it means that the current move will soon end. In this case, it means that everyone, who wanted to enter the market, is already in it and there is nobody left to support further rallies - new capital needs to enter the market if the price was to rise.
Yes, the GDXJ:SPY ratio take the individual investors into account only, and the gold market is driven by many other entities, but - once you take into account the fact that the public enters the market mostly at the end of a given move - it occurs that it doesn't really matter.
Having figured the above we've been striving to find a way to measure this phenomenon and we believe we found two ways to do it.
First is taking a look at the values of size of a rally in the ratio and comparing it to the size of the rally in gold. If it's bigger it means that the public is very excited about this rally, which suggests that a correction will be seen quite soon. We've seen that in early January, May, and June 2010.
If the rally is smaller than that of gold, it means that people are still waiting on the sidelines and are ready to jump back into the market once they get more convinced about the rally. When would that take place? When price rises. Consequently, when the prices rise, people will buy more and the prices will rise even further. Yes - it is against the buy low, sell high rule, but this is how things play out most of the time. We've seen that since February to early April 2010 - and the rally continued afterwards.
The second way to use analyze the ratio is to apply indicators, and two of them appear particularly useful. The less useful of these two is the well-known RSI indicator - please take a look at the areas marked with black ellipses. The signal is visible only for most important tops (it is visible today though...).
The most useful indicator here appears to be the Rate of Change indicator. As it name suggests, it measures the rate of change., which is another way of calling the "steepness of the rally" or its "rapidness". High values here indicate optimism. As visible on the chart above, excessive emotions result in an ROC greater than 10, which likely results in a top forming soon thereafter. The ROC indicator was just at the 15 level - actually an all-time high for this indicator when applied to this particular ratio, which serves as a strong indication that the local top is in or is very close to being in.
Other Information
Before summarizing, we would like to reply several questions (thank you for your feedback, we really appreciate it) that we've received in the previous days.
One of them was from our Subscriber, who purchased CDE shares in order to profit from a speculative trade that was supposed to take only a few days (this was a bet on good earnings report). The company didn't do well, and the Subscriber finally end up with about 1/3 portfolio allocated in CDE shares. The question is what to do given the current market environment. Our reply is that if it was our money on the table, we would close the position right away, not only because of the high probability that we are at the local top. We would do that mainly because the factor that made us open this position in the first place is no longer valid and because we would not open such a position if we didn't own any shares - at least it would not be this big.
If - at any point - you are not sure if you should hold on to a position that you currently have (and there are low transaction costs), all you need to do is ask yourself a different question - would you open this position at current market price in the amount that it currently equals to in your portfolio. If the answer is no, then you have just told yourself to close the position.
Another question issue from our mailbox - former US, UN envoy Bolton says Israel has only a few days [ending this weekend] to attack Iran before their nuclear reactor is operational. After that the radiation fallout would be disastrous. The question is what effect would such a strike have on PM prices?
Generally this would mean precious metals moving much higher, but at this point we don't believe that will be the case.
Another question from our inbox was about gold and silver stocks - is it a good idea to hedge them. Generally, it depends on your risk preferences (the risk is to be out of the market here, so risk averse investors don't need to do anything in our view), and of course your strategy. If you are holding your long-term positions intact at all times and by hedging your positions you mean temporarily betting on lower prices in order to offset the losses on your long-term positions then this is a speculative capital that we are talking about and in this case it could be a good idea to proceed with "hedging" your positions.
The end effect will be similar to selling all/part of your stocks. In this case, we suggest hedging only a part of your portfolio, just like we normally suggest using only a part of one's capital for speculation.
Another question that we've received this week (actually, it was from Jacob, who i.a. helps you if you contact us regarding technical problems) was about silver and whether it provides us with a better shorting opportunity because of its correlation with stocks. The answer is that, it might go lower then gold percentage-wise - especially that the situation on the general stock market looks bleak. Then again, please keep in mind that silver might also move up much quicker, as it is known for its volatility, so we still suggest diversifying between both metals (and mining stocks).
Summary
Market alerts issued earlier this week are up-to-date as precious metals have likely reached local tops late this week or will soon do so. The Euro Index is about ½ way through its decline and the USD Index is likewise about half way through its rally.
The general stock market will likely see somewhat of a downtrend in the near-term as many indicators show underlying weakness to the market in general. Gold, silver and mining stocks have likely topped recently or are about to do so. The sentiment, therefore, for precious metals is bearish in the near term.
At this point we think that the coming decline should not bother long-term Gold-, Silver-, and Mining Stocks Investors, as it seems that it will be only temporary.
As always, Sunshine Profits will continue to closely monitor all developments and notify our Subscribers immediately when the situation warrants.
This completes this week's Premium Update.
Thank you for using the Premium Service. Have a great weekend and profitable week!
Sincerely,
Przemyslaw Radomski

