

Briefly: In our opinion, full (100% of the regular size of the position) speculative short positions in gold, silver and mining stocks are justified from the risk/reward perspective at the moment of publishing this alert.
The general stock market stole the spotlight just a few days ago and the consequences of the big decline and the subsequent upswing have not yet fully played out. The S&P 500 is in a very tense situation, which is particularly important for us – precious metals investors – because the way in which stocks will move is likely to determine the way in which mining stocks will move. How to tell what’s going to happen and how to position oneself to profit on this situation? One of the key clues comes from the place where one might not expect it. From the Japanese yen.
What does the Japanese currency tell us in light of the very tense situation in the main stock indices?
It tells us that the rally in gold is weak and based on yesterday’s session, we have additional signs pointing to a bearish outlook. Let’s start with gold (chart courtesy of http://stockcharts.com).
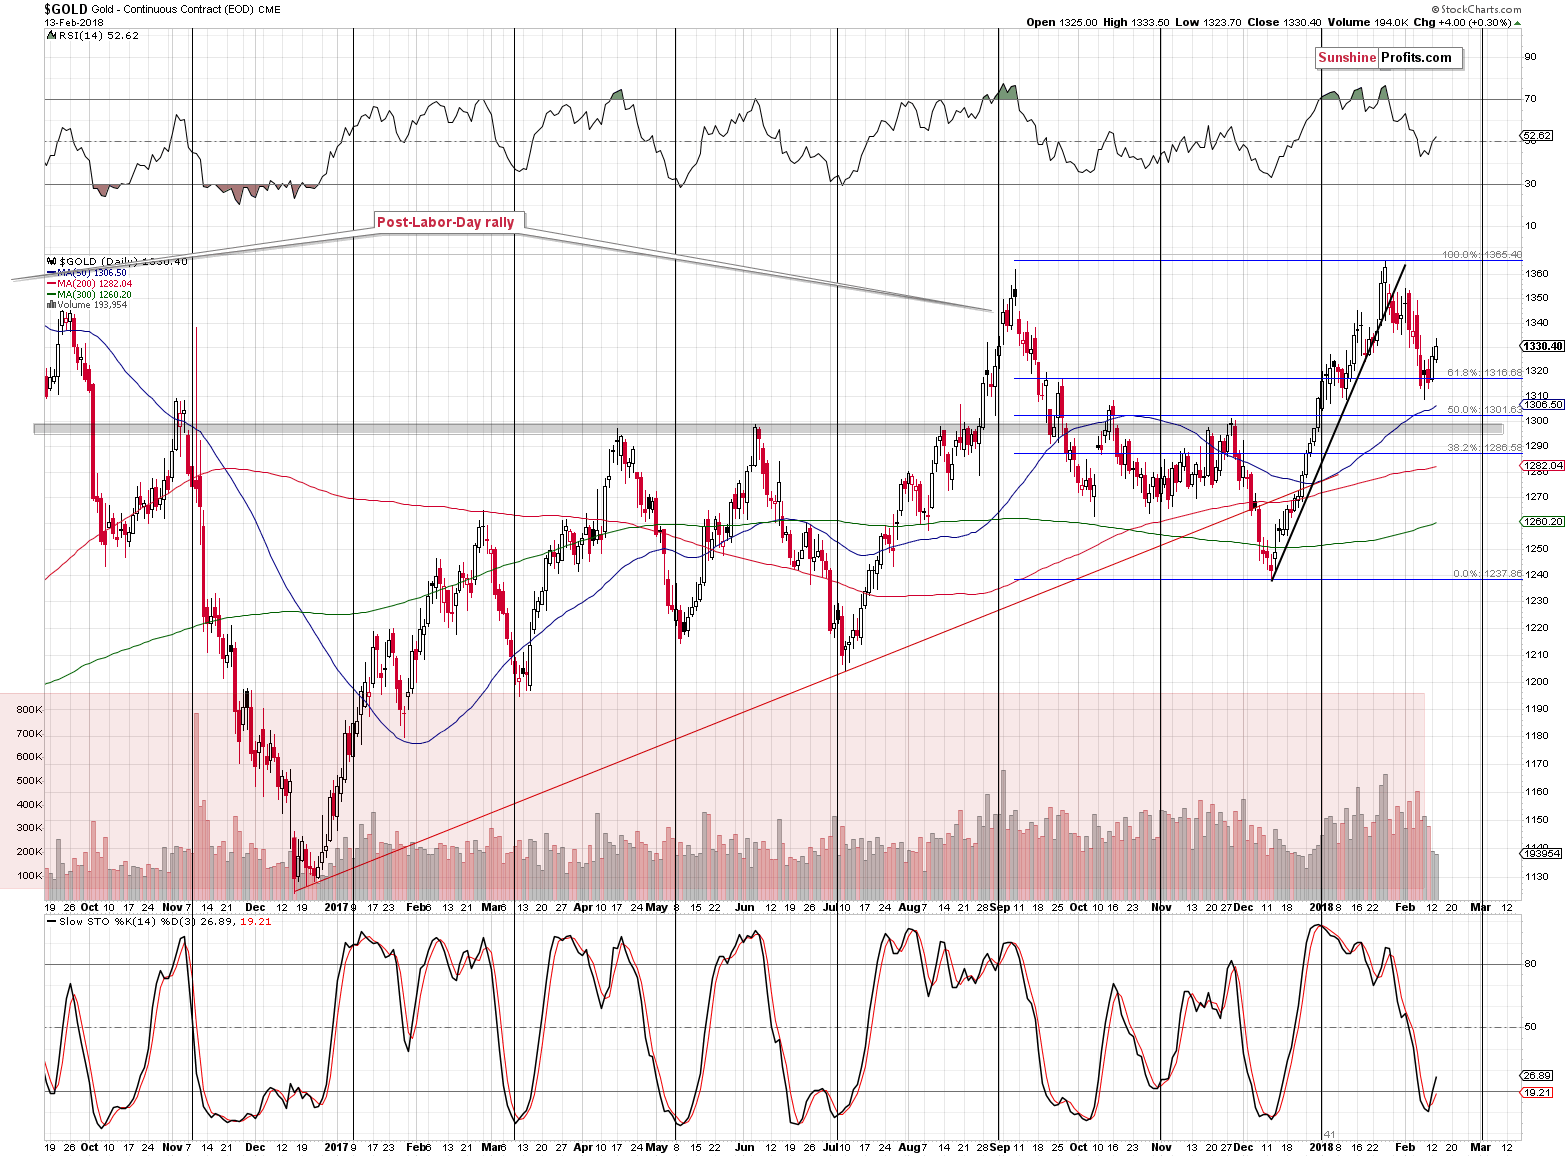
Gold moved higher – how is that supposed to be bearish?
Gold has indeed moved higher as it had little choice – the USD Index declined quite visibly yesterday (to 89.59). The thing that makes this rally bearish is the volume – it was once again very low, especially when we compare it to the levels of volume that we’ve seen this year. In fact, yesterday’s volume was the lowest that we’ve seen in 2018. The second place goes to Monday’s upswing.
This shows that people were not really eager to buy gold. There were smaller amounts of both buyers and sellers and the former were stronger as they had a declining USD on their side. However, in order for gold to push substantially higher or to start a bigger rally, real buying power is necessary. Without it, there will soon be nobody left to buy and the price will tumble. That’s what low volume during a rally suggests and we just saw this signal twice and both of the cases were clear.
In the previous alerts, we wrote that the upside targets for gold were $1,327 and $1,345. The former was more likely assuming that the USD would not break below the 90 level. However, since it did break below it, we might see a move to the $1,340 - $1,345 range before gold reverses. The lower border of the range is based on the way gold reacted to the USD’s movement today and the way it reacted to the whole correction that we saw in the past several days.
Gold is $4.4 higher today (trading at $1,333.70), while the USD is 0.18 lower (trading at 89.53).
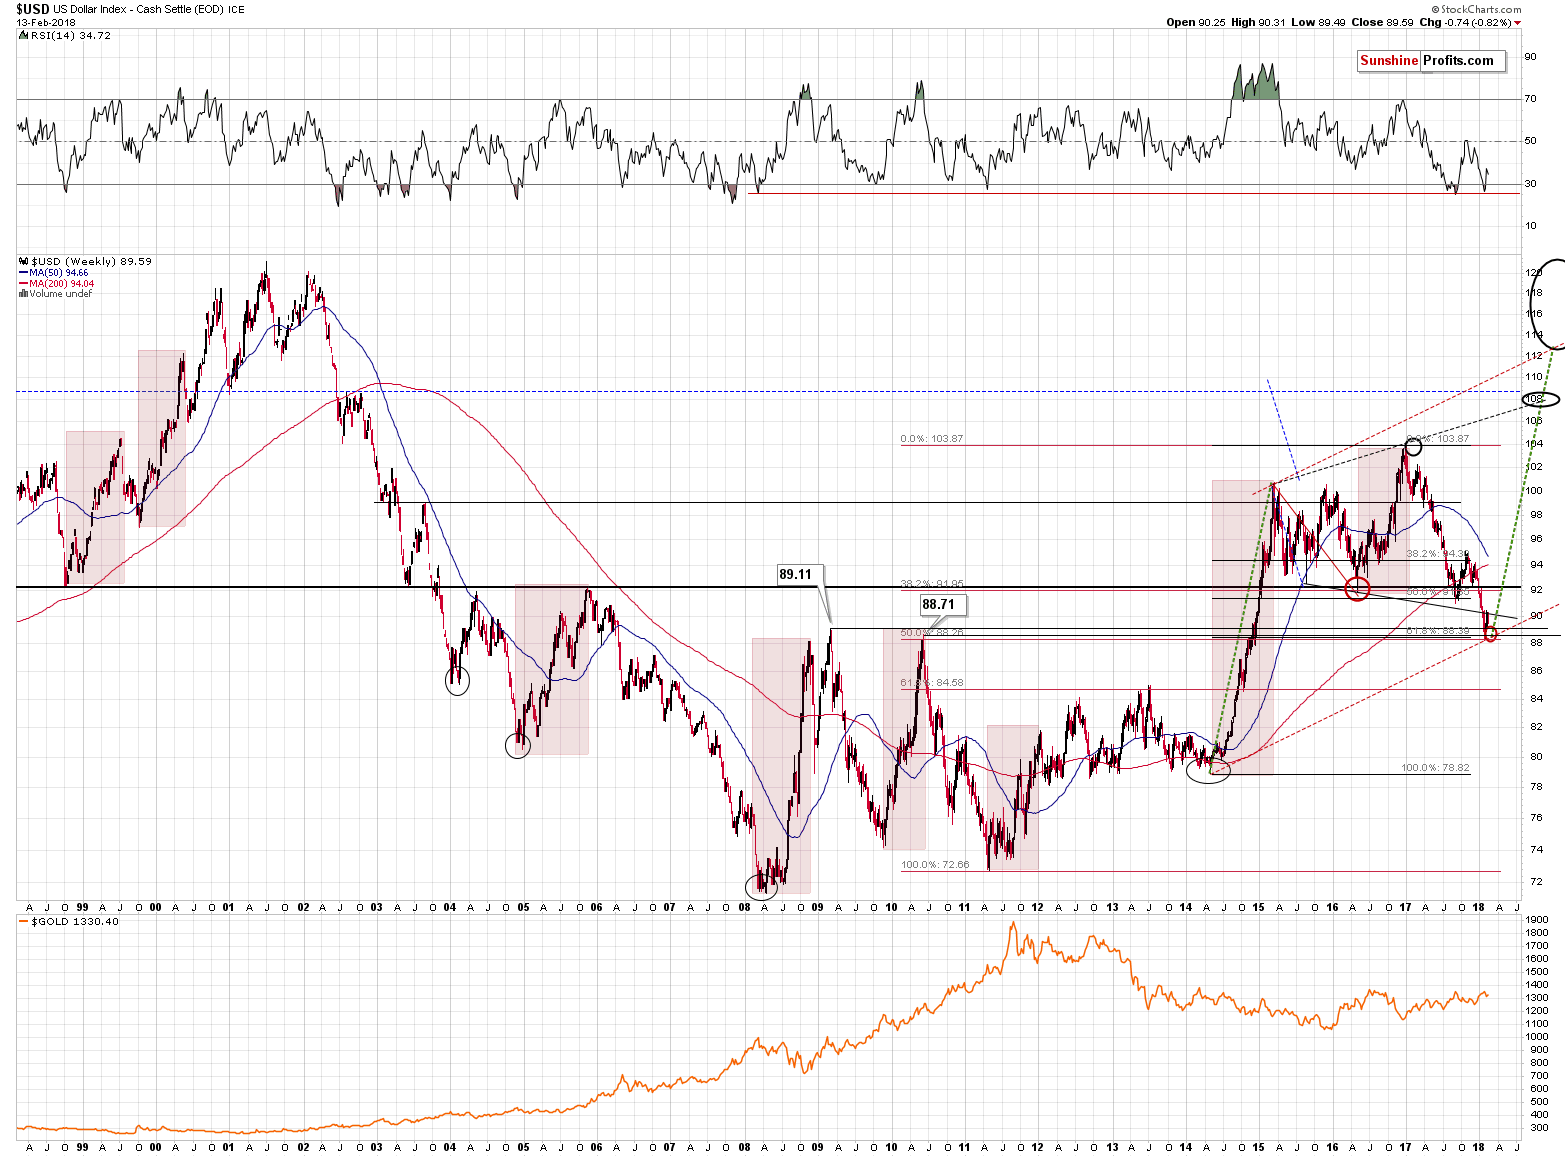
The closest of very strong support levels for the USD Index is at 89.11, so we’ll assume that it’s the current downside target for the USD. That’s 0.42 lower than the current price and the USD would need to decline 2.33 times more today for this level to be reached. If the rally in gold is to be proportional, then we might see an additional $4.4 * 2.33 = $10.26 rally.
Adding this to the price from the moment when the calculations were made provides us with $1,333.70 + $10.26 = $1,343.96 as the upside target. This fits the previous $1,345 target quite well. Still, it seems more likely that gold would not rally by as much (at least not in terms of the closing prices).
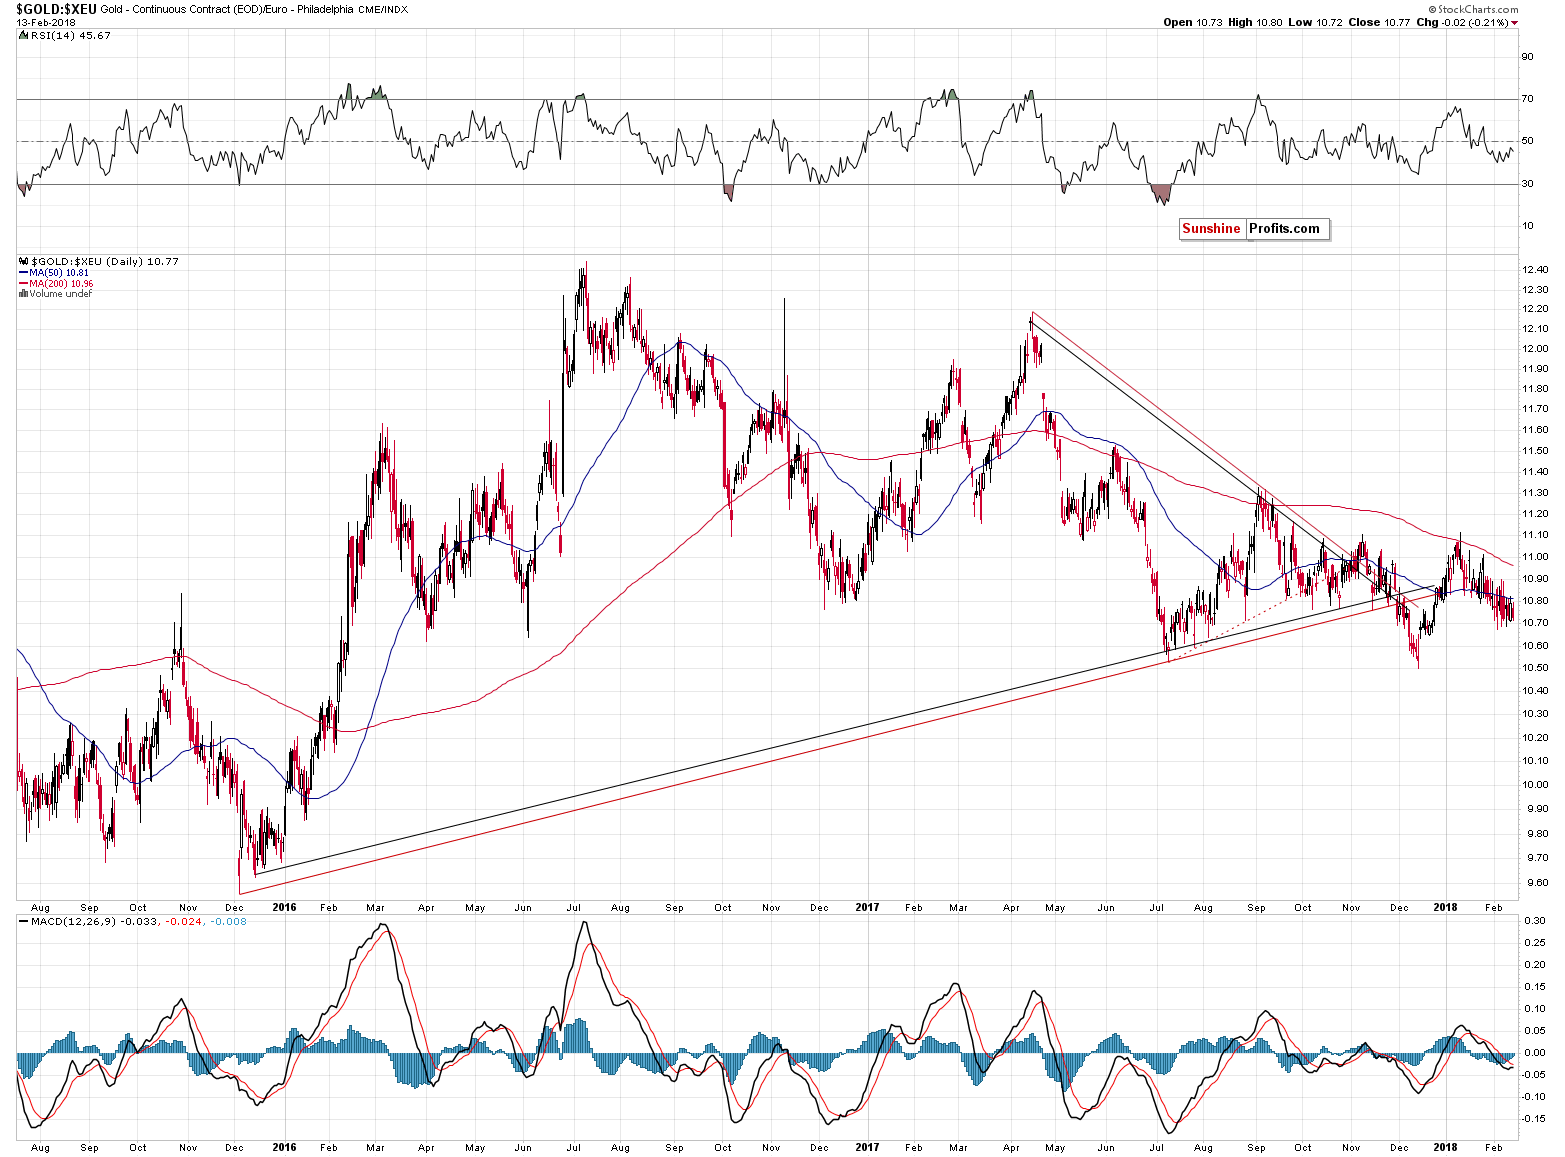
Gold is declining in terms of the euro (including yesterday’s session), which means that gold is not fully reacting to the USD’s movement and the downtrend in which gold currently is suggests that the underperformance should continue. So, the surprise here is likely to be bearish. In other words, gold would be more likely to underperform the above estimation than to outperform it.
Speaking of underperformance, gold’s inability to soar despite a big daily upswing in the Japanese yen is another factor pointing to lower gold prices in the upcoming weeks.
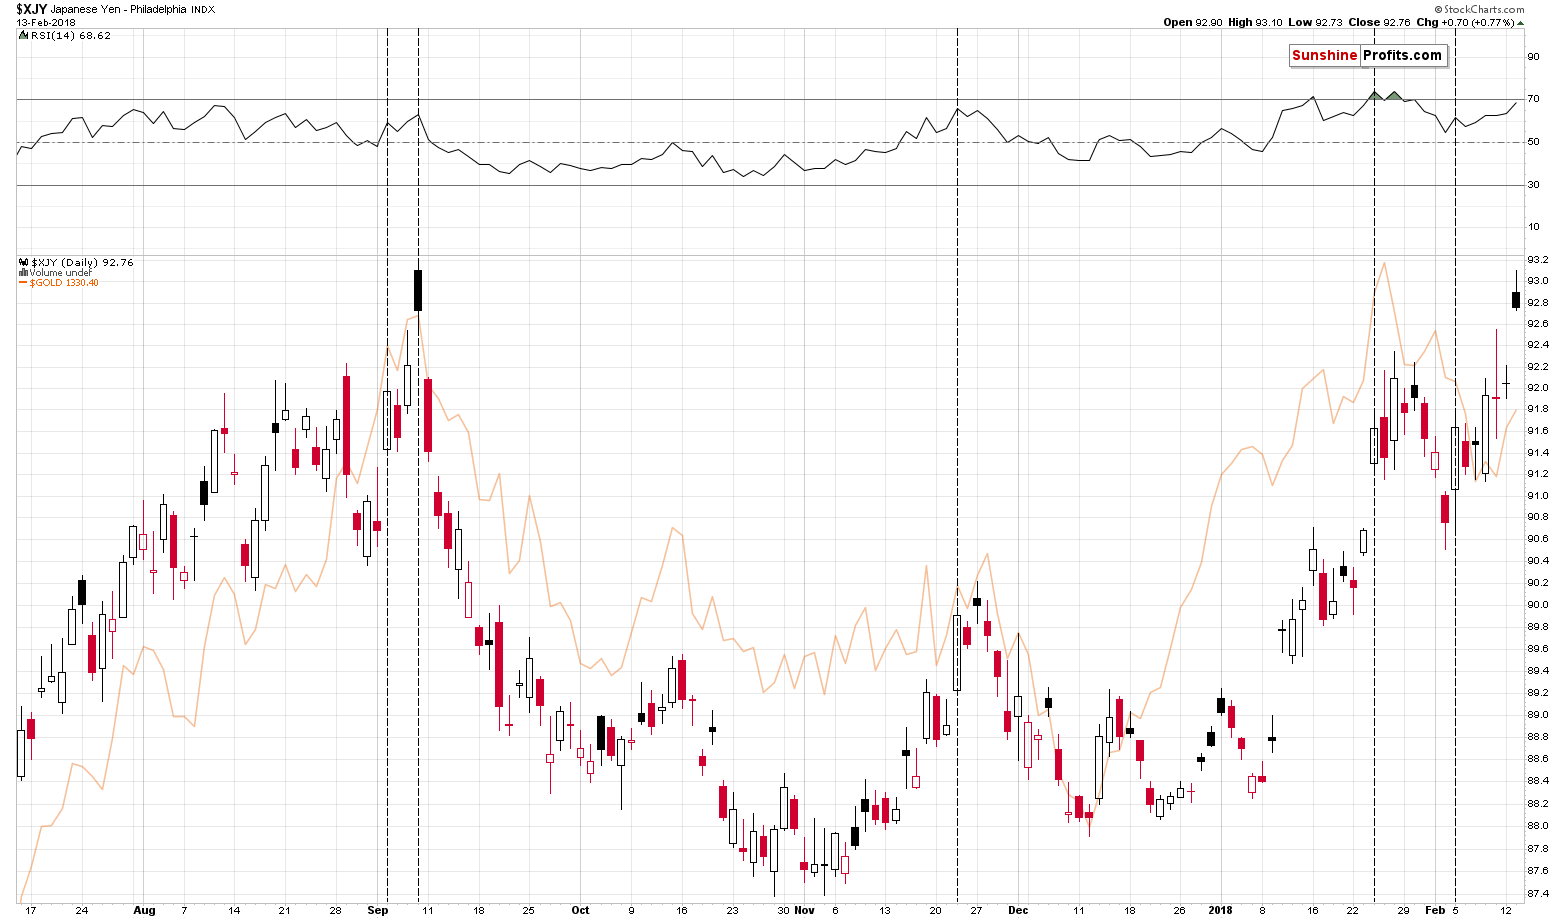
One might say that we’re double-counting the same factor as we have already discussed gold’s performance compared with the USD Index, but that’s not entirely the case. The Japanese yen is not the biggest part of the USD Index (the euro is), so it’s not the same thing. Moreover, gold’s often particularly vulnerable to the yen movement, so yesterday’s small upswing in gold is disappointing since the yen broke above its previous 2018 high and moved to the September 2018 top. Gold’s reaction should have been much more bullish. It wasn’t, and the implications are bearish.
What about silver?
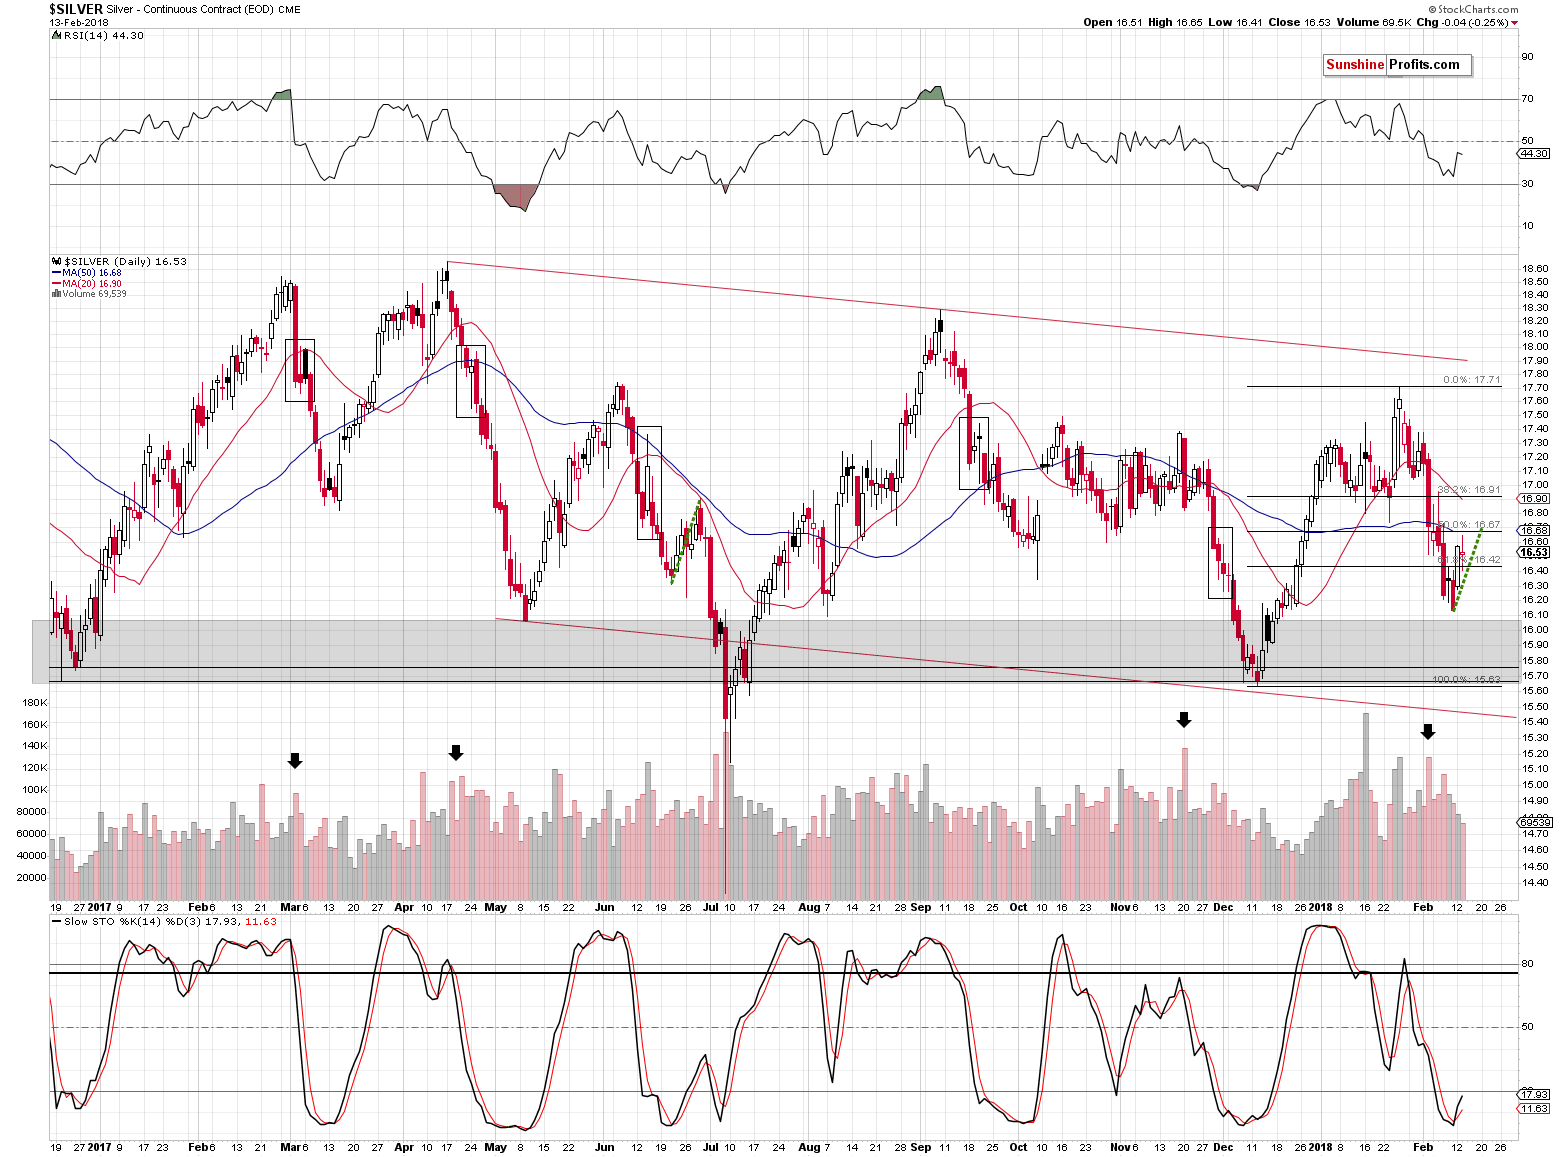
In short, our Monday’s comments on the white metal remain up-to-date:
(…) or that we’ll see additional gains.
In the case of the latter scenario, it seems that the $16.70 level (approximately) has a good chance of stopping the upswing. That’s where we have the 50% Fibonacci retracement, the 50-day moving average and that’s how far silver moved higher during a correction after a similar decline. Back in June 2017, silver started its decline from similar levels (from about $17.70) and the same was the case in January 2018. Back in June, the correction starter from about $0.5 higher from the exact bottom, before the decline resumed. Once the decline resumed, it took only a few days to erase all gains and move below the previous low.
Silver moved close to the mentioned $16.70 level, but it’s just about 12 cents below it at the moment of writing these words – the upside seems very limited.
Monday’s session is still particularly interesting, because its implications remain in place. Silver outperformed gold on a very short-term basis, which could be a top-is-near sign.
We saw a buy signal from the Stochastic indicator, which could appear bullish, but please note that we saw the same thing in mid-June. We already took the similarity to this correction into account and marked it with the green, dashed line on the above chart. If the situation is alike, then the upside is very limited, which is far from being a bullish piece of information.
The top in silver might have already formed yesterday, but if the USD declines more and gold rallies several dollars, we can’t rule out a situation in which silver moves to $16.70 once again, or even breaks this level very briefly. This could – if other signals align as well – serve as a signal that the decline can resume and that we can add to our short positions.
The above may be perplexing to those who are new to our analyses (quite a lot new subscribers joined us recently). The thing is that silver tends to outperform gold on a very short-term basis right before tops. It also tends to break out just before tops. All in all, technical signals from the silver market can be applied to the letter only sometimes. If they are not confirmed by analogous signals from other parts of the precious metals market, it’s usually imperative to pay attention to what action in silver preceded similar cases instead of trusting the general technical analysis guidelines. We’ve been in this market for more than a decade and we’ve seen fake silver breakouts and fake silver outperformances so many times that we automatically view them as something bearish unless something proves them different. Applying the above to the current situation – if silver breaks above $16.70, it will not automatically be anything bullish. It might be actually a strong short-term sell signal, especially if we see bearish signs from other markets. Naturally, we’ll keep you – our subscribers – informed.
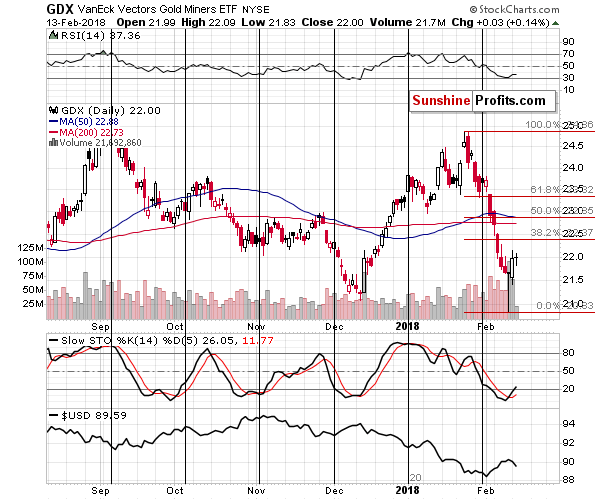
The volume that we saw in mining stocks yesterday was shockingly low. Shouldn’t miners rally after such a profound breakout, given gold’s rally and amid increasing (just a little, but still) main stock indices? You bet – they should. But they didn’t. That’s profoundly bearish and a sign that what we saw in the past few days is not a start of a new substantial rally, but a pause within a bigger decline.
However, we should still pay attention to the situation in the general stock market, as it was its decline that triggered the big slide in the mining stocks in the recent days and contributed to our profits.
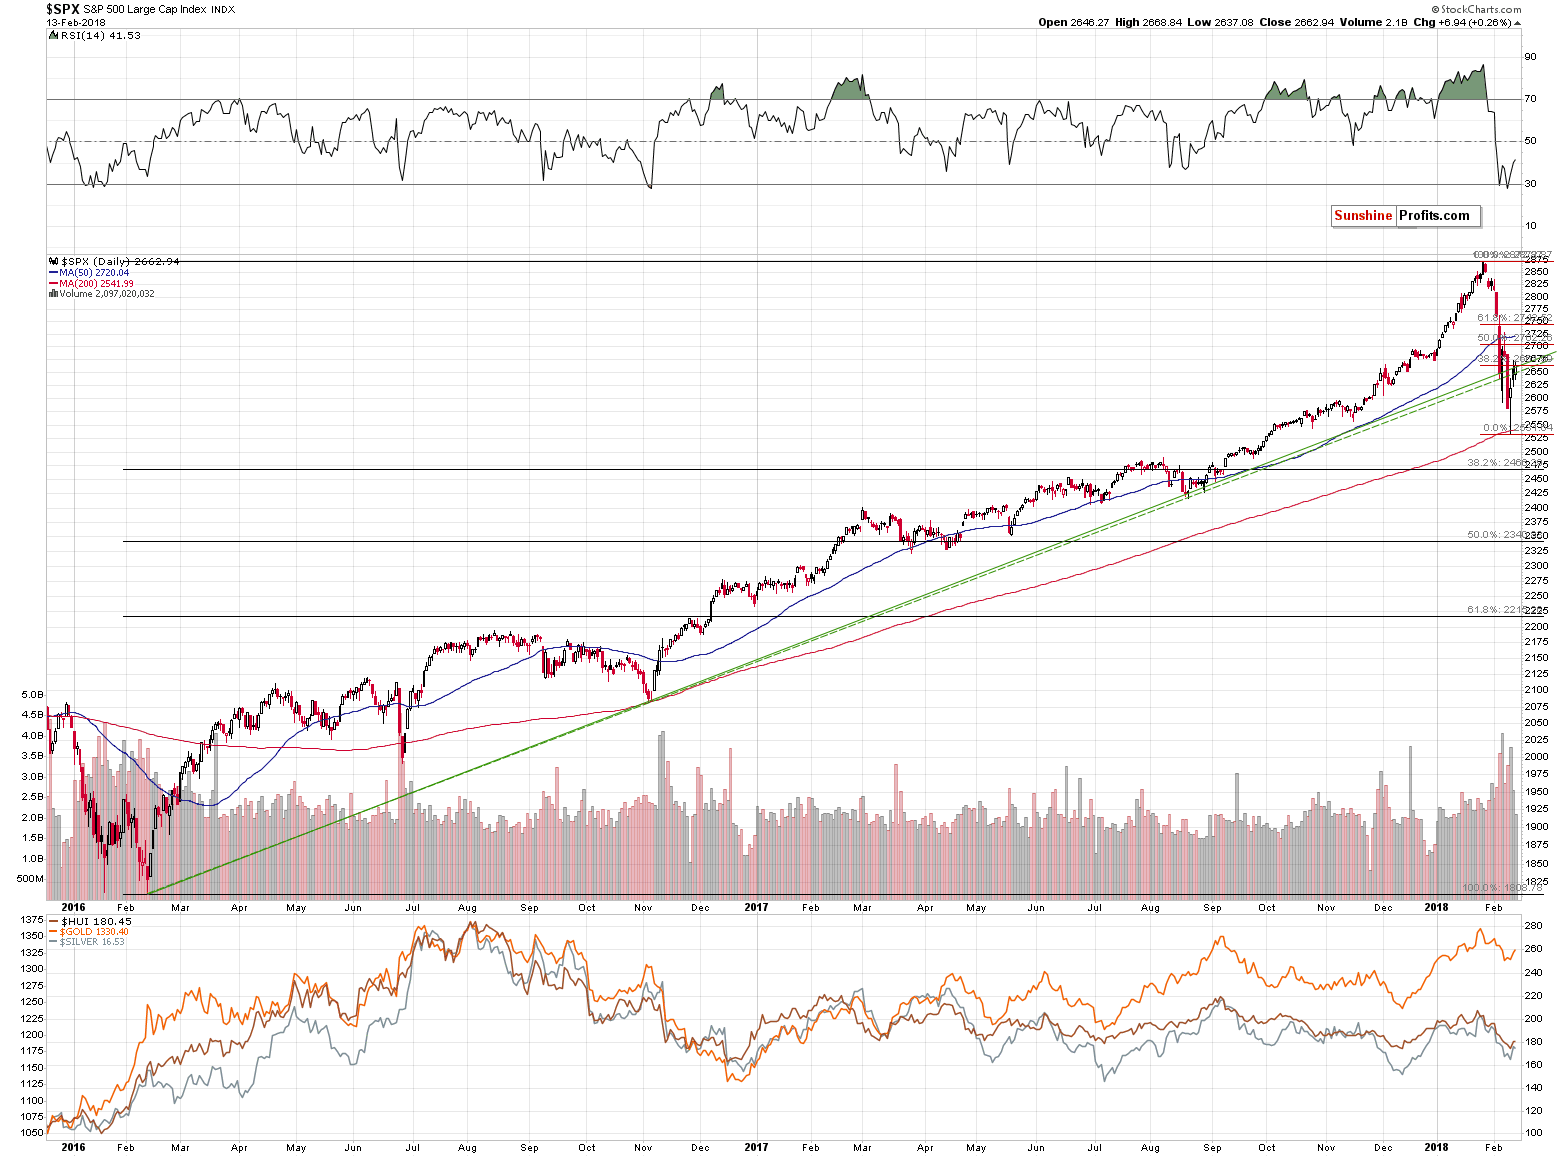
In the previous alerts, we discussed that the S&P 500 Index was either on the verge of invalidating its recent breakdown below the rising support / resistance line, or verifying it. The implications for these 2 scenarios were contradictory, so the situation was tense. Unfortunately, it still is, as the S&P moved higher by only as much as – approximately – the rising support / resistance line. Consequently, the jury is still out – stocks could rally, but they could also fall and, in both cases, they could take mining stocks with them. The potential size for a rally in mining stocks is limited, though.
Summing up, in Monday's alert (we strongly encourage you to read it, if you haven’t had the chance to do so previously) we thoroughly described the situation in the precious metals sector and our reasoning for decreasing (but not exiting) the speculative short position and partially taking profits off the table, and based on yesterday’s and today’s pre-market price developments, these comments remain up-to-date. In light of multiple bearish signs for the medium term, no meaningful short-term signs for the precious metals and somewhat bullish short-term signs for mining stocks, we think that short position in gold, silver and mining stocks are still justified from the risk to reward point of view, but we don’t think that an extra-large position size is appropriate.
On a side note, on this page (its second half) you can see a small simulation of how much the overall rate of return changes with position size and how dangerous too big positions could be.
As always, we will keep you – our subscribers – informed.
To summarize:
Trading capital (supplementary part of the portfolio; our opinion): Full short positions (100% of the full position) in gold, silver and mining stocks are justified from the risk/reward perspective with the following stop-loss orders and initial target price levels:
- Gold: initial target price: $1,218; stop-loss: $1,382; initial target price for the DGLD ETN: $53.98; stop-loss for the DGLD ETN $37.68
- Silver: initial target price: $14.63; stop-loss: $17.82; initial target price for the DSLV ETN: $33.88; stop-loss for the DSLV ETN $20.88
- Mining stocks (price levels for the GDX ETF): initial target price: $19.22; stop-loss: $26.14; initial target price for the DUST ETF: $39.88; stop-loss for the DUST ETF $15.78
In case one wants to bet on junior mining stocks' prices (we do not suggest doing so – we think senior mining stocks are more predictable in the case of short-term trades – if one wants to do it anyway, we provide the details), here are the stop-loss details and initial target prices:
- GDXJ ETF: initial target price: $27.82; stop-loss: $38.22
- JDST ETF: initial target price: $94.88 stop-loss: $37.78
Long-term capital (core part of the portfolio; our opinion): No positions (in other words: cash)
Insurance capital (core part of the portfolio; our opinion): Full position
Important Details for New Subscribers
Whether you already subscribed or not, we encourage you to find out how to make the most of our alerts and read our replies to the most common alert-and-gold-trading-related-questions.
Please note that the in the trading section we describe the situation for the day that the alert is posted. In other words, it we are writing about a speculative position, it means that it is up-to-date on the day it was posted. We are also featuring the initial target prices, so that you can decide whether keeping a position on a given day is something that is in tune with your approach (some moves are too small for medium-term traders and some might appear too big for day-traders).
Plus, you might want to read why our stop-loss orders are usually relatively far from the current price.
Please note that a full position doesn’t mean using all of the capital for a given trade. You will find details on our thoughts on gold portfolio structuring in the Key Insights section on our website.
As a reminder – “initial target price” means exactly that – an “initial” one, it’s not a price level at which we suggest closing positions. If this becomes the case (like it did in the previous trade) we will refer to these levels as levels of exit orders (exactly as we’ve done previously). Stop-loss levels, however, are naturally not “initial”, but something that, in our opinion, might be entered as an order.
Since it is impossible to synchronize target prices and stop-loss levels for all the ETFs and ETNs with the main markets that we provide these levels for (gold, silver and mining stocks – the GDX ETF), the stop-loss levels and target prices for other ETNs and ETF (among other: UGLD, DGLD, USLV, DSLV, NUGT, DUST, JNUG, JDST) are provided as supplementary, and not as “final”. This means that if a stop-loss or a target level is reached for any of the “additional instruments” (DGLD for instance), but not for the “main instrument” (gold in this case), we will view positions in both gold and DGLD as still open and the stop-loss for DGLD would have to be moved lower. On the other hand, if gold moves to a stop-loss level but DGLD doesn’t, then we will view both positions (in gold and DGLD) as closed. In other words, since it’s not possible to be 100% certain that each related instrument moves to a given level when the underlying instrument does, we can’t provide levels that would be binding. The levels that we do provide are our best estimate of the levels that will correspond to the levels in the underlying assets, but it will be the underlying assets that one will need to focus on regarding the signs pointing to closing a given position or keeping it open. We might adjust the levels in the “additional instruments” without adjusting the levels in the “main instruments”, which will simply mean that we have improved our estimation of these levels, not that we changed our outlook on the markets. We are already working on a tool that would update these levels on a daily basis for the most popular ETFs, ETNs and individual mining stocks.
Our preferred ways to invest in and to trade gold along with the reasoning can be found in the how to buy gold section. Additionally, our preferred ETFs and ETNs can be found in our Gold & Silver ETF Ranking.
As a reminder, Gold & Silver Trading Alerts are posted before or on each trading day (we usually post them before the opening bell, but we don't promise doing that each day). If there's anything urgent, we will send you an additional small alert before posting the main one.
=====
Hand-picked precious-metals-related links:
PRECIOUS-Gold firms as dollar wilts ahead of U.S. inflation data
Gold Shines as Traders Count Down to ‘Critical’ CPI, Dalio Buys
UPDATE 1-Gold Fields profit falls on lower South Africa output
Authorities crack down on 'Goldfinger' tax evasion
=====
In other news:
Futures point way higher before inflation
U.S. inflation test looms large, dollar pressured
Lloyd Blankfein: Odds of a 'bad outcome' for economy have gone up
Five Charts That Explain How European Banks Are Dealing With Their Bad-Loan Problem
Physical oil market sends warning to OPEC: Rout might not be over
JPMORGAN: Bitcoin miners are in a 'hash rate arms race'
Africa's first bitcoin exchange targets 1 billion users
=====
Thank you.
Sincerely,
Przemyslaw Radomski, CFA
Founder, Editor-in-chief, Gold & Silver Fund Manager
Gold & Silver Trading Alerts
Forex Trading Alerts
Oil Investment Updates
Oil Trading Alerts

