

Briefly: In our opinion, full (100% of the regular size of the position) speculative short positions in gold, silver and mining stocks are justified from the risk/reward perspective at the moment of publishing this alert. In other words, we are decreasing the size of the speculative positions from 200% to 100% and taking half of the profits off the table.
The huge decline in mining stocks along with the general stock market was the key event of Friday’s session. The only thing that was more interesting, was the subsequent rebound. Main stock indices ended the session higher, the GDX reversed the entire decline, and the HUI and XAU indices corrected only half of the previous decline. Gold and silver were mostly unmoved. What should one make of all this?
There are multiple factors that are in play right now, so today’s alert will be quite long as we don’t want to present you anything less than the most complete analysis.
Even though the spotlight was on mining stocks, we start the analysis with metals and other markets as it will be easier to analyze the entire picture in this way. Let’s start with gold (chart courtesy of http://stockcharts.com).
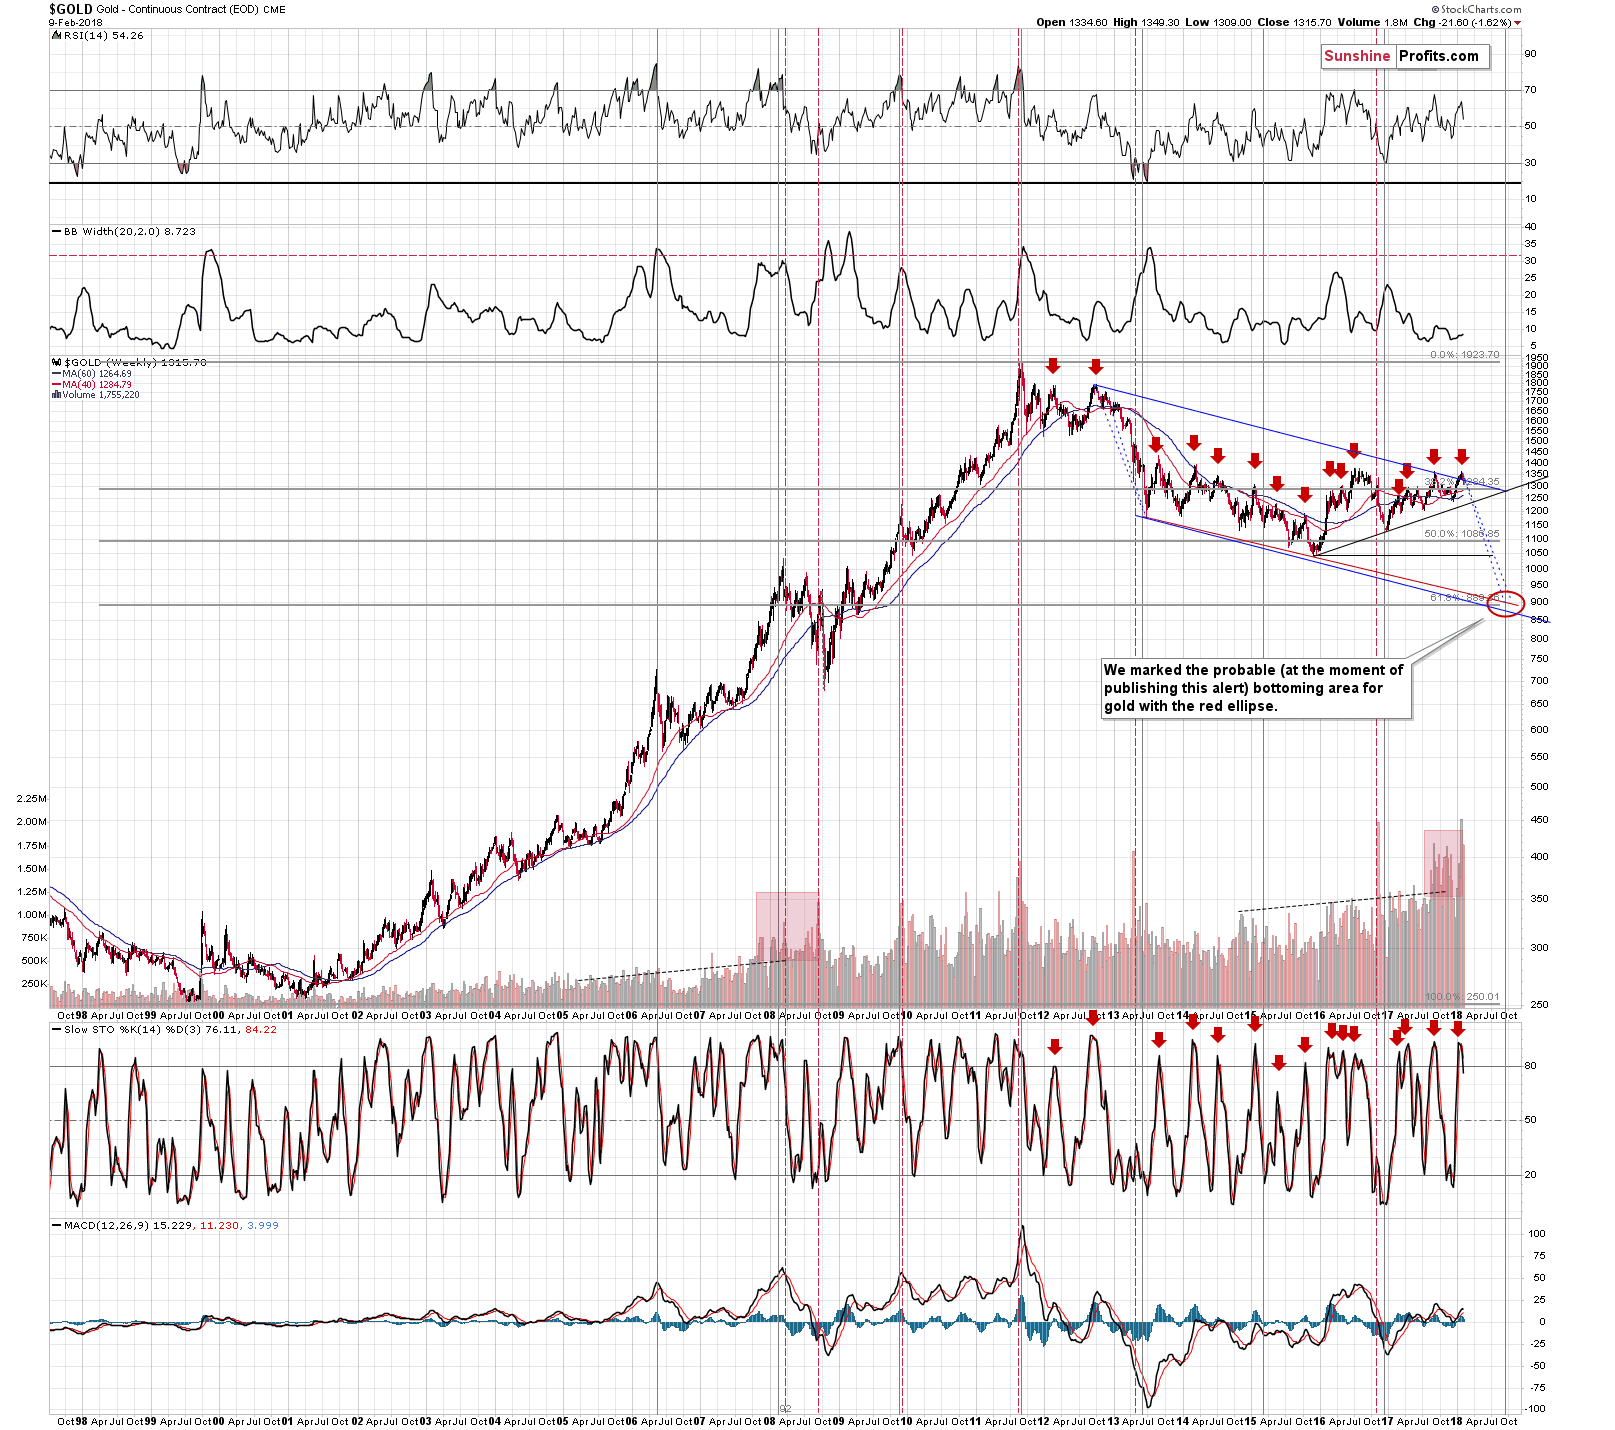
From the long-term point of view, we see that gold invalidated the breakout above the long-term declining resistance line. The implications are very bearish for the following weeks and months. The same goes for the sell signal from the Stochastic indicator – it remains in play, having bearish implications.
The MACD and PMO sell signals also remain in place and so do their bearish implications.
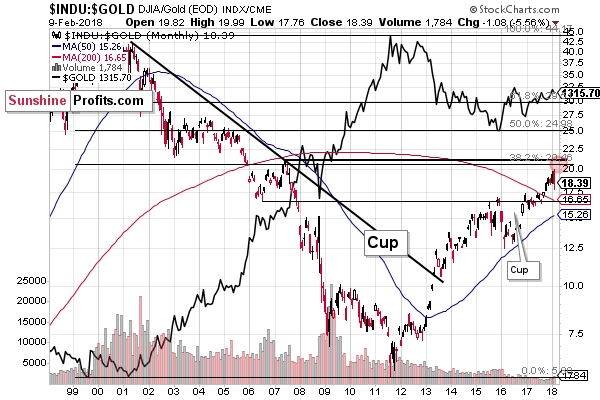
The Dow to gold ratio moved to 19.99 before declining, so the lower border of our target area was just reached. But, does this imply that the rally in gold is at hand? Not really – the move higher in the ratio was based on the stock market’s powerful rally in the past months – not on gold’s weakness. Consequently, the resistance worked just as it should and triggered a decline, but since it was the general stock market that mostly contributed to the rally, the correction in the ratio translated into a decline in the stock market, not into a rally in gold. The implications here are not clear, but they are generally not bullish for gold – they are most likely bearish for the general stock market, but it could also be the case that the decline that was likely to happen has already happened.
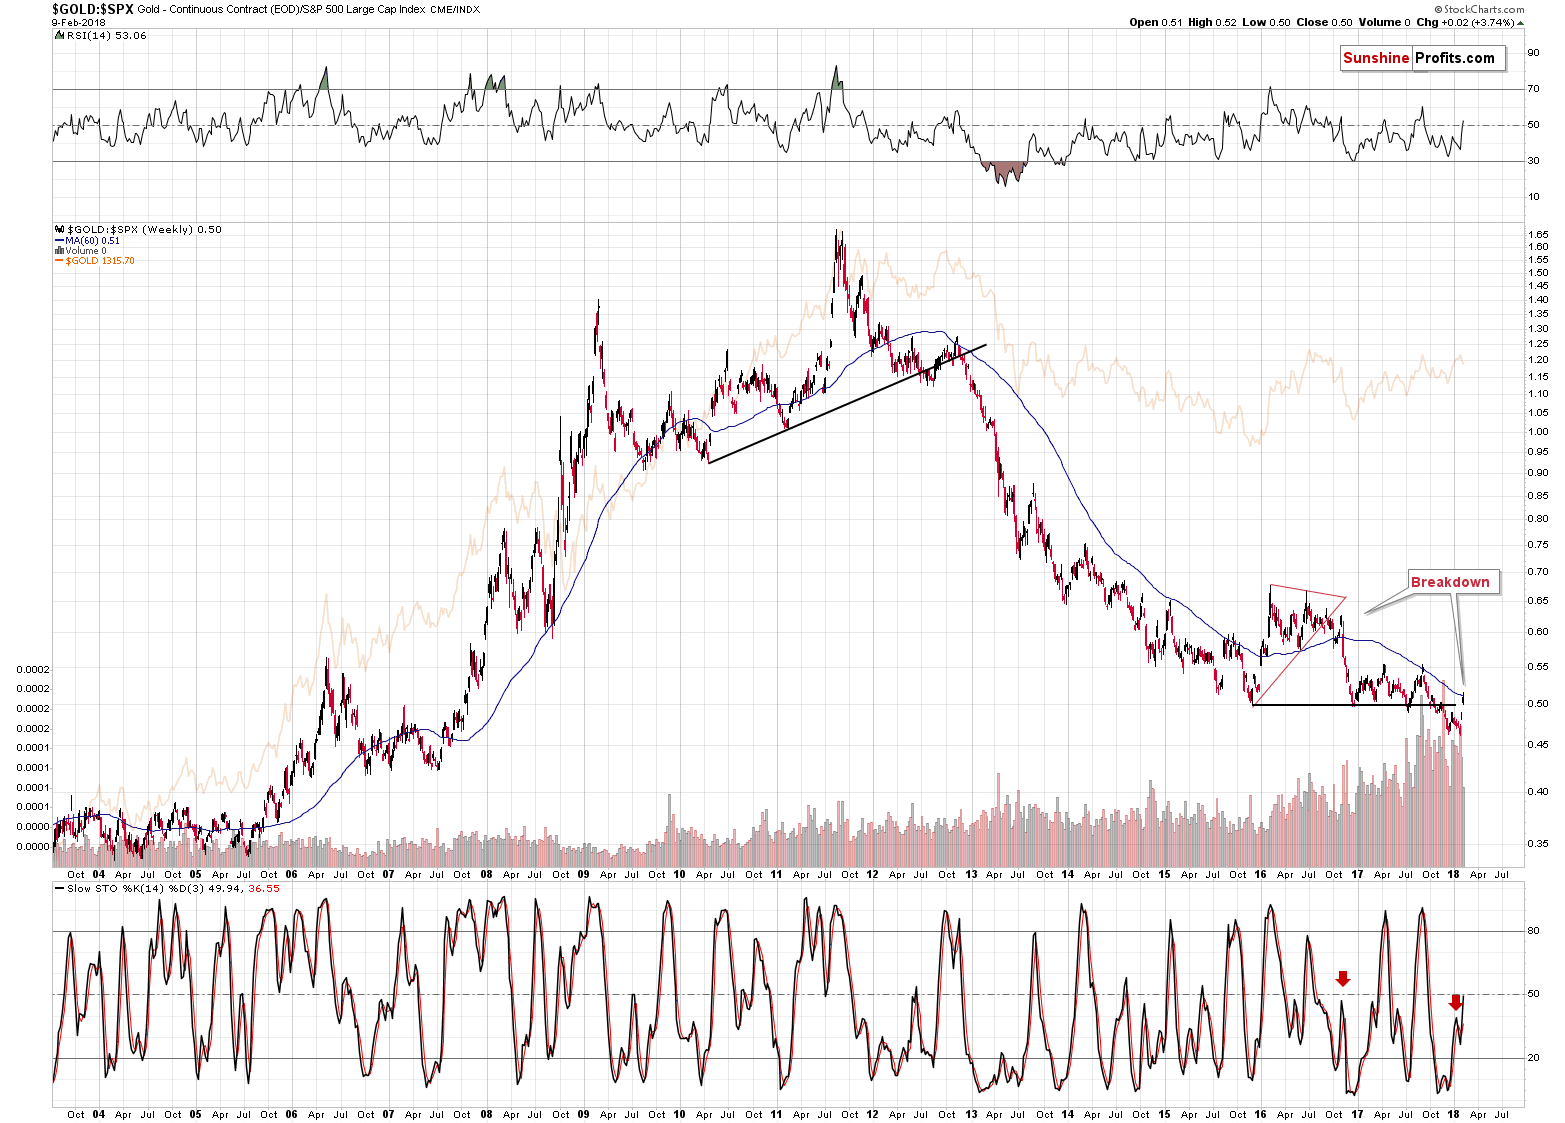
We can say something similar about the ratio between gold and the S&P 500. The breakdown was invalidated based on last week’s closing prices. However, it seems to have short-term implications for the stock market, not for gold. Besides, the ratio already reached its 60-week moving average, which served as support and resistance quite a few times (including during the previous top), so the rally might be over anyway.
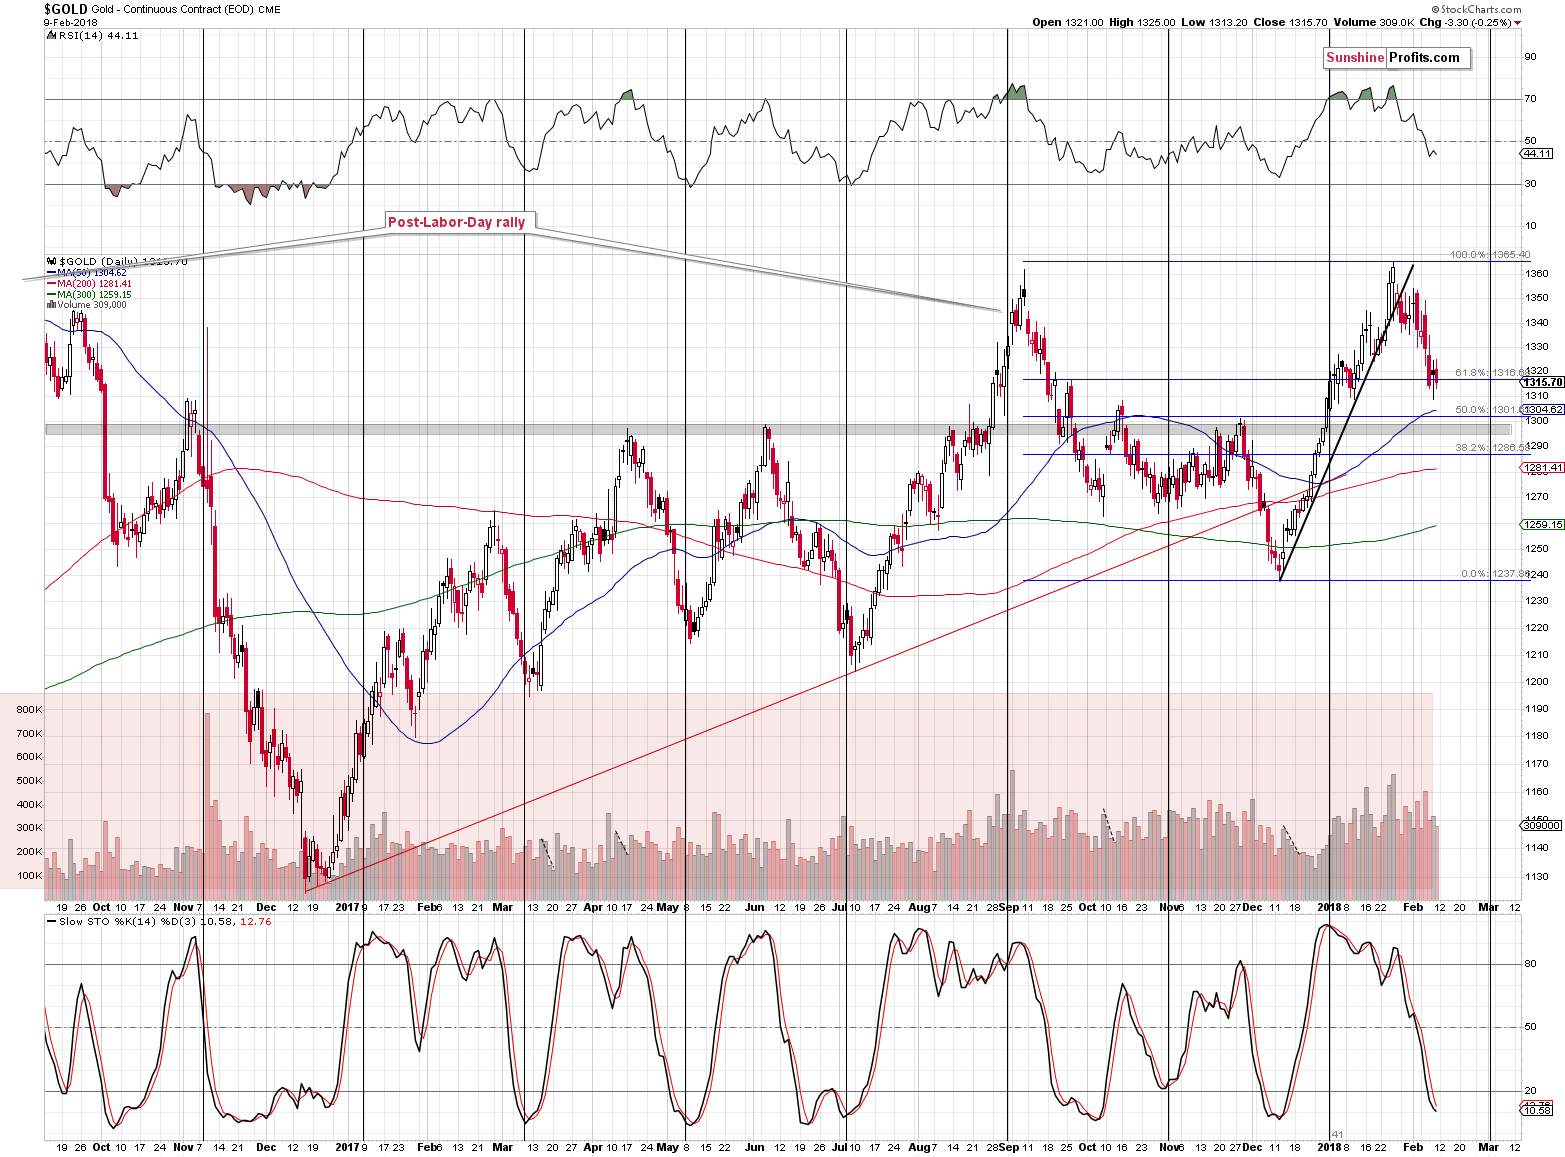
From the short-term point of view, nothing really changed on Friday. Gold moved $3 lower and that’s pretty much it. There was no sell or buy signal, and the volume was rather inconsequential.
If gold was to “rally” from here, then the upside would be at about $1,327 (a bit less than $10 higher). The maximum potential that we view as at least somewhat likely is $1,345. The above levels are based on the previous highs. Again, that’s a big “if”. Gold reached the previous local low (not a very important one, though) and the first Fibonacci retracement (38.2%), but without a visible buy sign, it doesn’t seem to be enough to invalidate the bearish implications of the long-term gold picture (invalidation + sell signal from the weekly Stochastic).
Today’s pre-market high is a bit above $1,325, so the local top might already be in.
What about silver?
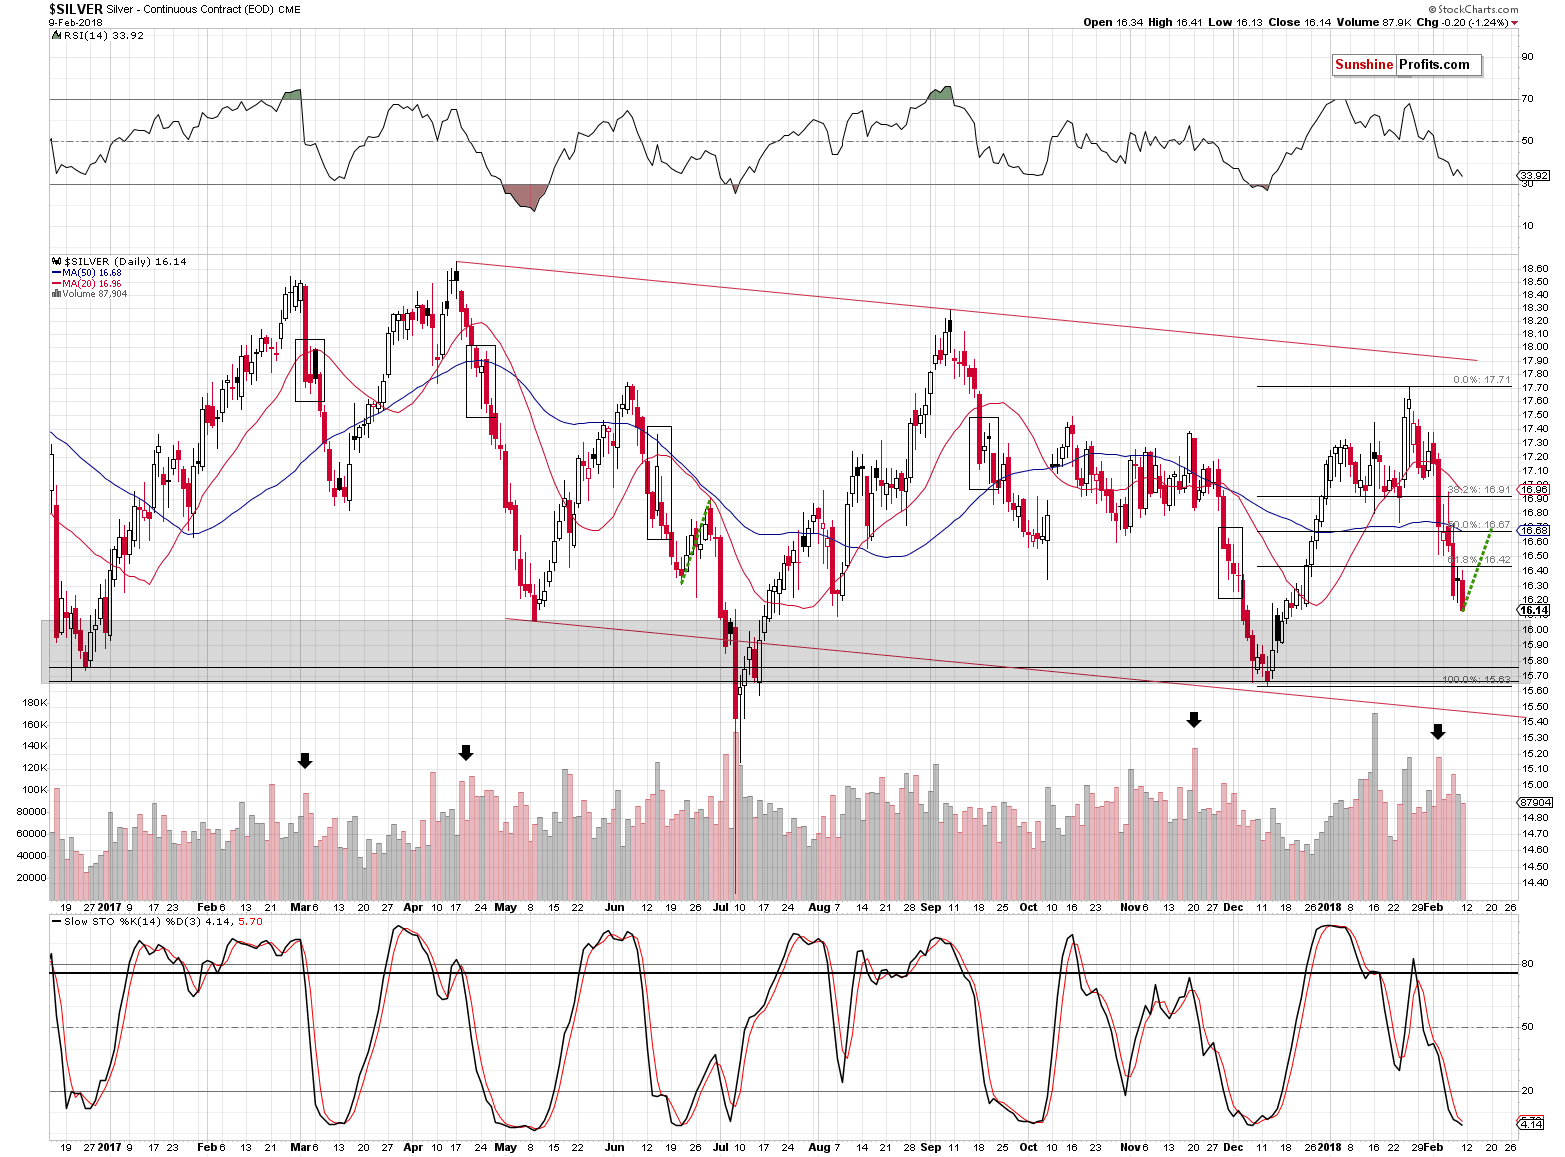
It moved lower and it came back higher, although the latter is not visible on the above chart. The size of the move was not huge, so it’s not that meaningful. What’s more meaningful is that at the moment of writing these words, silver is trading at $16.40 and the recently broken Fibonacci retracement is at $16.42. This suggests that we’ll either see an invalidation of the move above it quickly (which would mean that the rally is already over) or that we’ll see additional gains.
In the case of the latter scenario, it seems that the $16.70 level (approximately) has a good chance of stopping the upswing. That’s where we have the 50% Fibonacci retracement, the 50-day moving average and that’s how far silver moved higher during a correction after a similar decline. Back in June 2017, silver started its decline from similar levels (from about $17.70) and the same was the case in January 2018. Back in June, the correction starter from about $0.5 higher from the exact bottom, before the decline resumed. Once the decline resumed, it took only a few days to erase all gains and move below the previous low.
With silver at $16.40, the upside target is only about 30 cents higher than the current price and only 13 cents higher than today’s intraday high (at least the one based on the data that we have at the moment of writing these words), it doesn’t seem that the upside is significant enough to justify making major changes in the trading position.
So far, there’s nothing in the precious metals market that’s bullish enough to invalidate the major bearish signals based on the medium-term factors (we discussed them thoroughly in the last few alerts).
The main trigger for the PM’s movement is the USD Index, so let’s take a look at the situation in it. Naturally, it’s critical to monitor the way metals react to the USD’s price swings as it can tell a lot about the way in which the metals really want to go, but still, the way the USD Index is likely to move in the short term is important to determine whether a correction is likely or not.
As far as the USD Index is concerned, we described the possible triggers for a pullback in Thursday’s alert. We wrote the following:
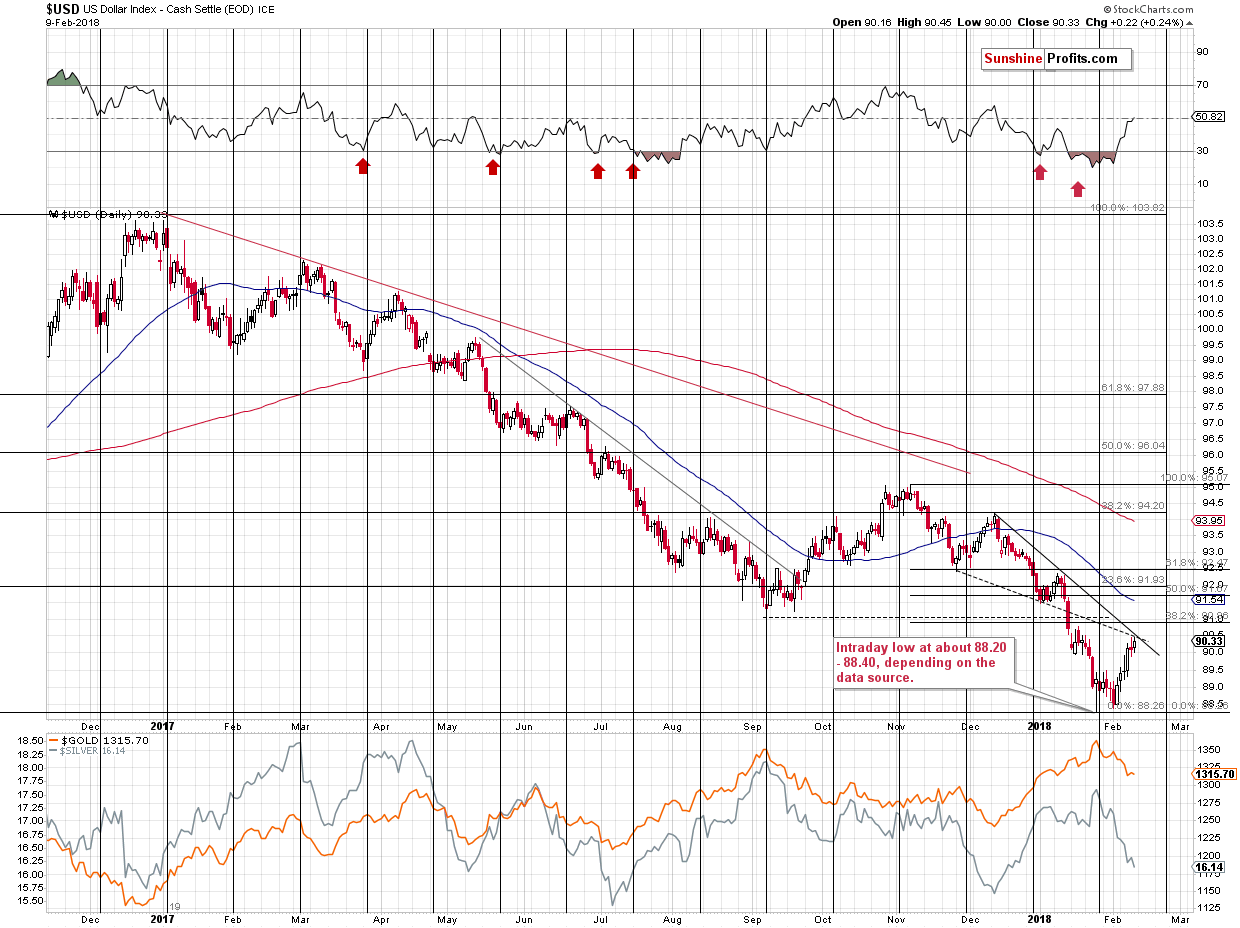
The USD Index moved higher this month and invalidated a small breakdown below the previous extremes. This makes the outlook very bullish for the following weeks. However, it doesn’t mean that there will be no pullbacks during the rally. There are several reasons for the USD Index to take a breather relatively soon:
- Declining solid resistance line.
- Declining dashed resistance line.
- 38.2% Fibonacci retracement based on the November – February decline.
- September 2017 bottom.
They all coincide in the 90.5 – 91 area, so that’s where we might see a consolidation. After a decline that was so huge as the recent one, it doesn’t seem that it will be anything major. Even if the USD Index is not moving above the 2017 high (and this seems quite likely), then the corrective upswing that should follow a yearly decline should be bigger than just a few-index-points upswing.
If the decline is not going to be big, then why should we – precious metals investors and traders – care?
Because if the PMs and miners get ahead of themselves during the current decline, then a brief pause in the USD may be enough to trigger a visible corrective upswing. For instance, in early October 2017, the USD Index moved lower for just a few days, but that was enough to trigger about a $30 upswing in gold and a comparatively bigger rally in silver. The current slide in gold and silver is even sharper than the September – October one, so metals might be even more inclined to correct in a visible manner if the USD triggers such a move.
On Friday, we added:
So far, we don’t see the strong willingness in gold to multiply USD’s correction. During yesterday’s back and forth movement gold showed how it currently reacts to USD’s both: upswings and downswings. Overall, in terms of the daily closing prices, there was little impact and as far as intraday price movement is concerned, we don’t see any spectacular movement. Gold moved higher when USD moved lower, but the moves were more or less the same – gold didn’t magnify USD’s signal. It’s visible even more clearly if we compare UUP and GLD charts (it might be more useful as prices for both ETFs have definitely the same data source). UUP was unchanged while GLD moved higher by 0.15% - also next to nothing.
During Friday’s session, the USD moved to 90.45 and in today’s pre-market trading it moved to 90.073 (Bloomberg data). The 90.45 level is close to the lower border of our target area, so the correction could have already started, but it’s also possible that we’ll see another move higher before the USD rests for a bit.
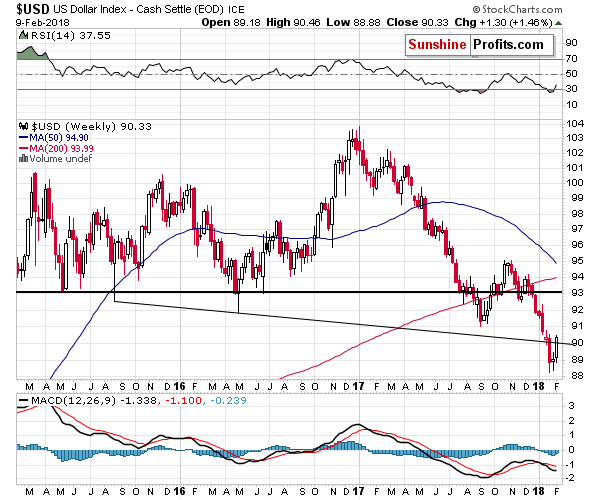
From the broader point of view, we see that the USD Index just invalidated the breakdown below the declining support line and this line is currently at about 90. The invalidation is by itself a bullish factor for the USD and a bearish one for the precious metals sector. Moreover, the line serves as a support level and since the USD was just a bit above the 90 level, the very short-term bottom might have just been formed.
All in all, if we look at gold, silver and the USD Index, there is very little reason to adjust the current short positions. We may or may not see corrections from here (in both the USD and PMs), but if we do, it’s not likely to be anything to call home about.
Now, the situation appears entirely different in the case of the GDX ETF as a result of the last several minutes of Friday’s session.
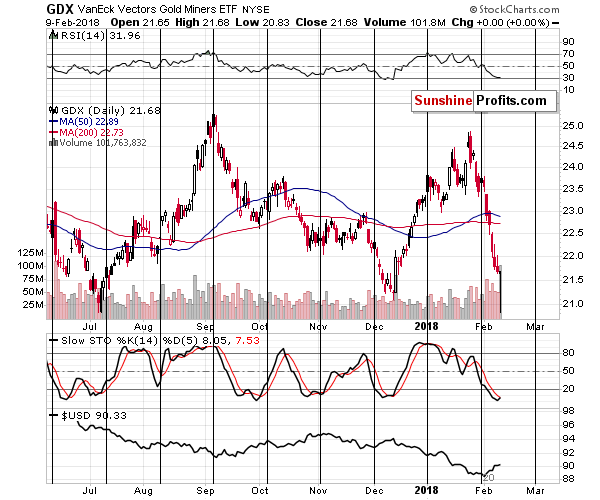
We just saw a reversal that was accompanied by huge volume. At first sight, it’s incredibly bullish as the above bullish combination was also accompanied by the RSI at about 30. At least that’s what classic technical analysis would imply.
The situation changed in the last several minutes of Friday’s session – just about half an hour before the closing bell, GDX was at $21. Should a several-minute-long change be trusted?
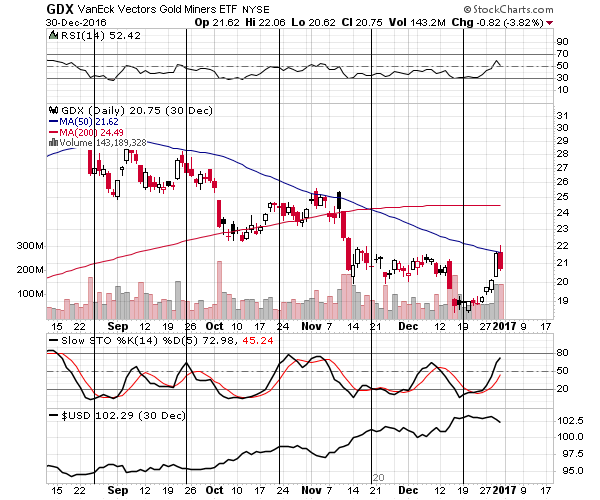
In the past, when the volume was also huge at after a sizable downswing, the huge-volume session didn’t mean that the bottom was in. It meant that it was close, though. The late August 2016 spike in volume, the early October 2016 one, and the mid-December 2016 declines and reversals all preceded bottoms, but that’s not when the sizable rallies started.
Given the sudden nature of Friday’s reversal, the analogy to the above cases might be more appropriate and we shouldn’t expect a major rally just because of the reversal.
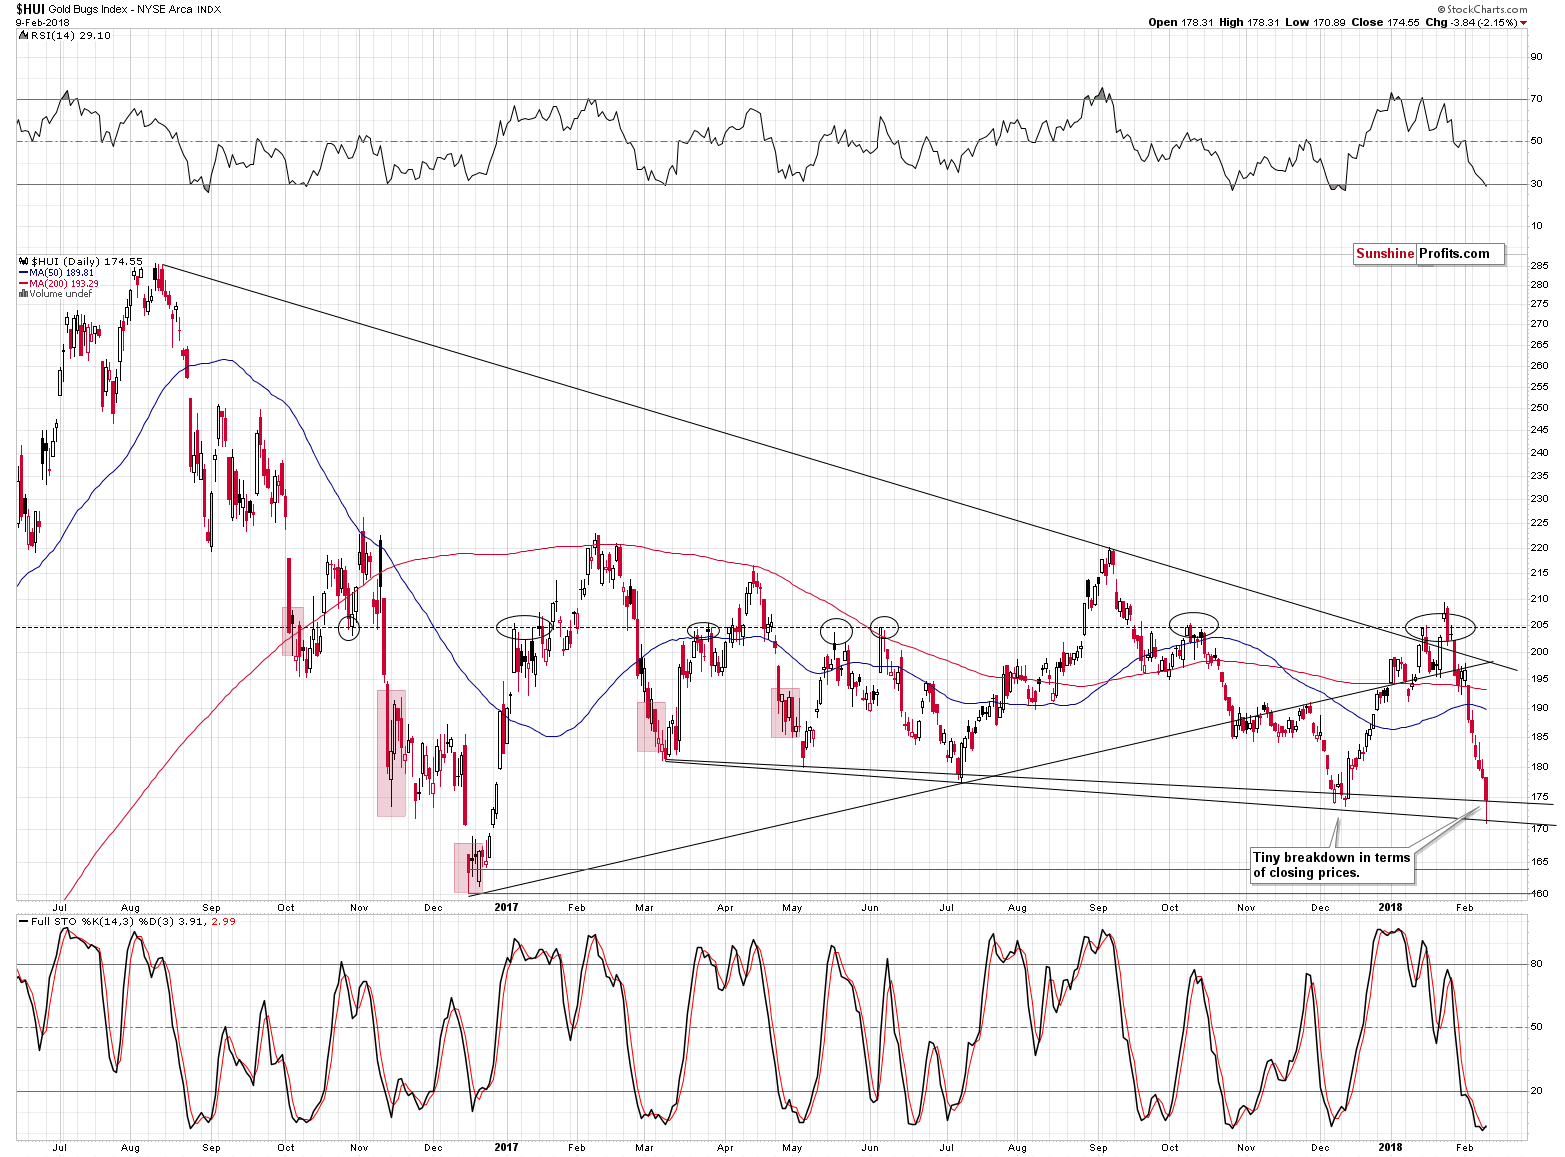
The HUI Index (the same can be seen on the XAU Index chart) also features a reversal, but it’s not as profound as the one in the case of the GDX ETF. Interestingly, the HUI Index reached the declining support lines base on the March 2017 and July 2017 lows in a quite specific way. The line based on the intraday lows was reached on an intraday basis and the line based on the closing prices was reached in terms of the closing prices. That’s a classic way in which the support lines (based on different prices) work.
As far as the current implications are concerned, since the support lines were reached, but not broken, then they are bullish factors. The same goes for the small (but still) buy signal from the Stochastic Indicator and the RSI below the 30 level.
Moreover, all of the above took place at the triangle’s apex, which makes a reversal very likely.
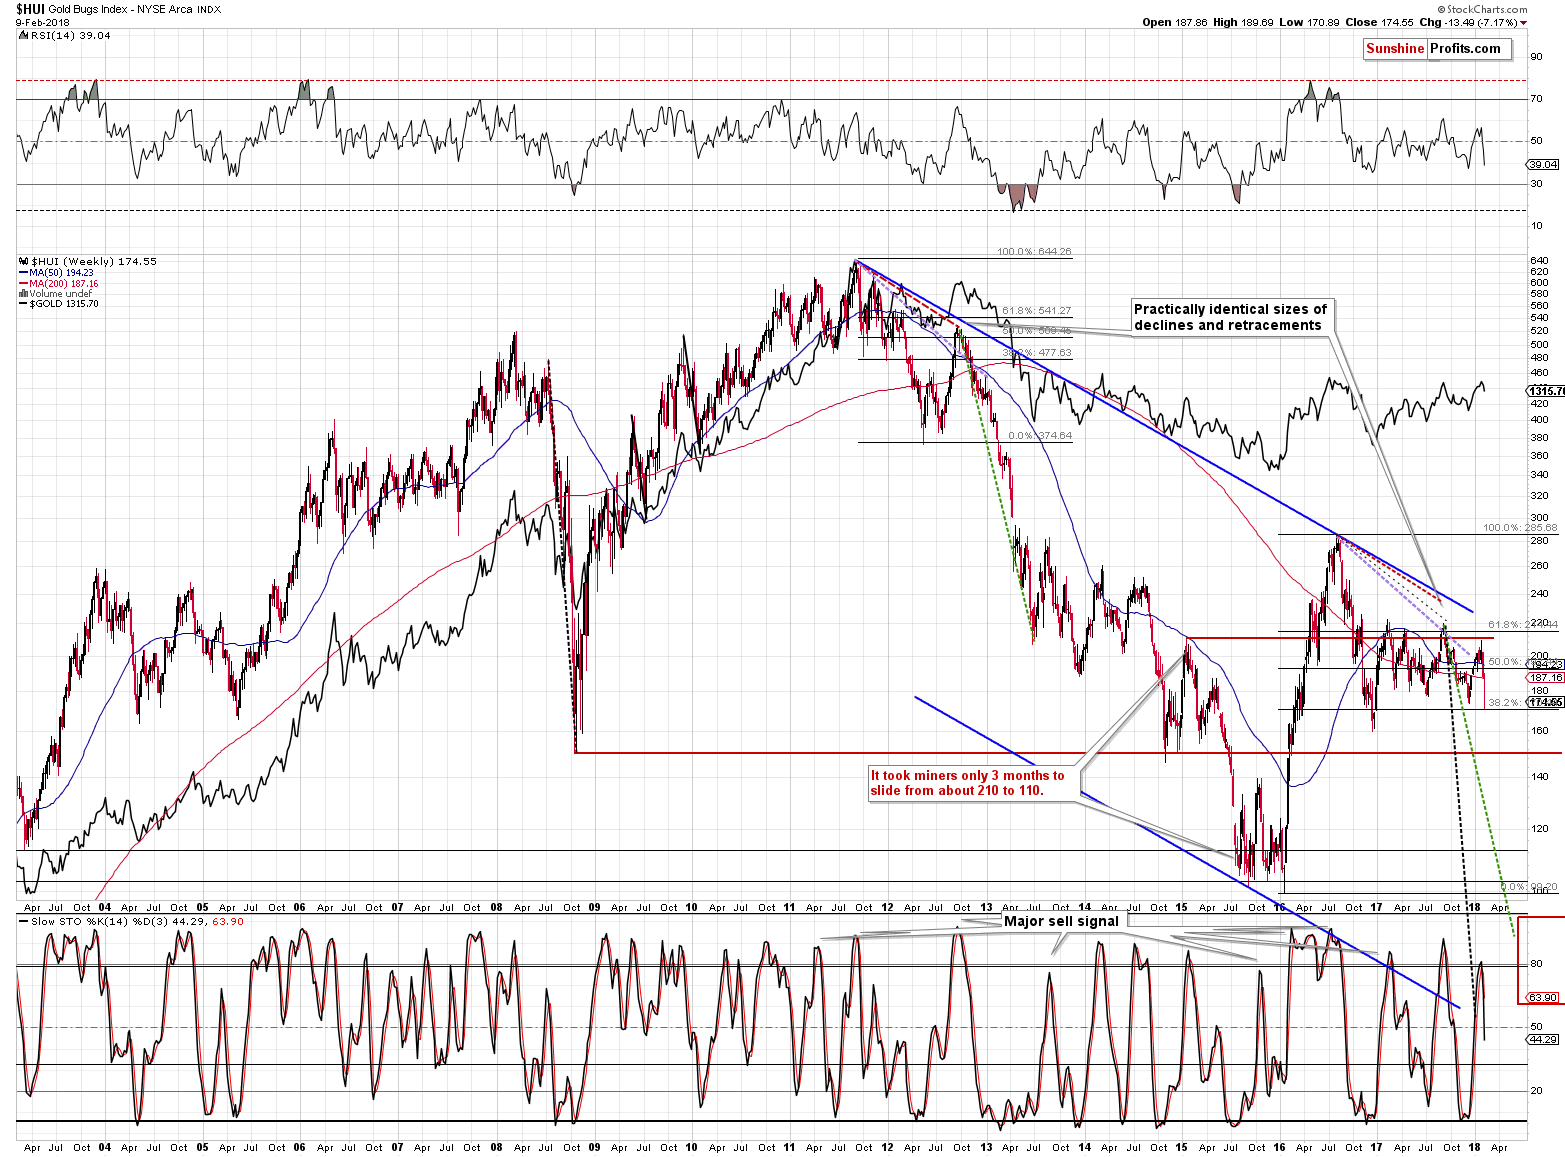
Naturally, from the long-term point of view, the outlook remains bearish and the sell signal from the weekly Stochastic indicator confirms it. Still, please note that the decline appears almost vertical, which is a good sign that the pace of the decline may be unsustainable, and a corrective upswing is likely.
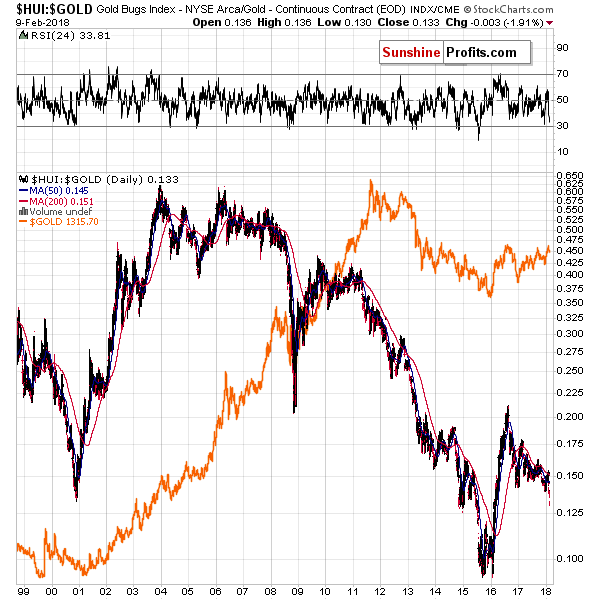
Comparing the performance of gold stocks with the one of gold provides us with bearish implications for the following weeks and (in particular) months as we saw a major breakdown below the late-2016 low in the HUI to gold ratio.
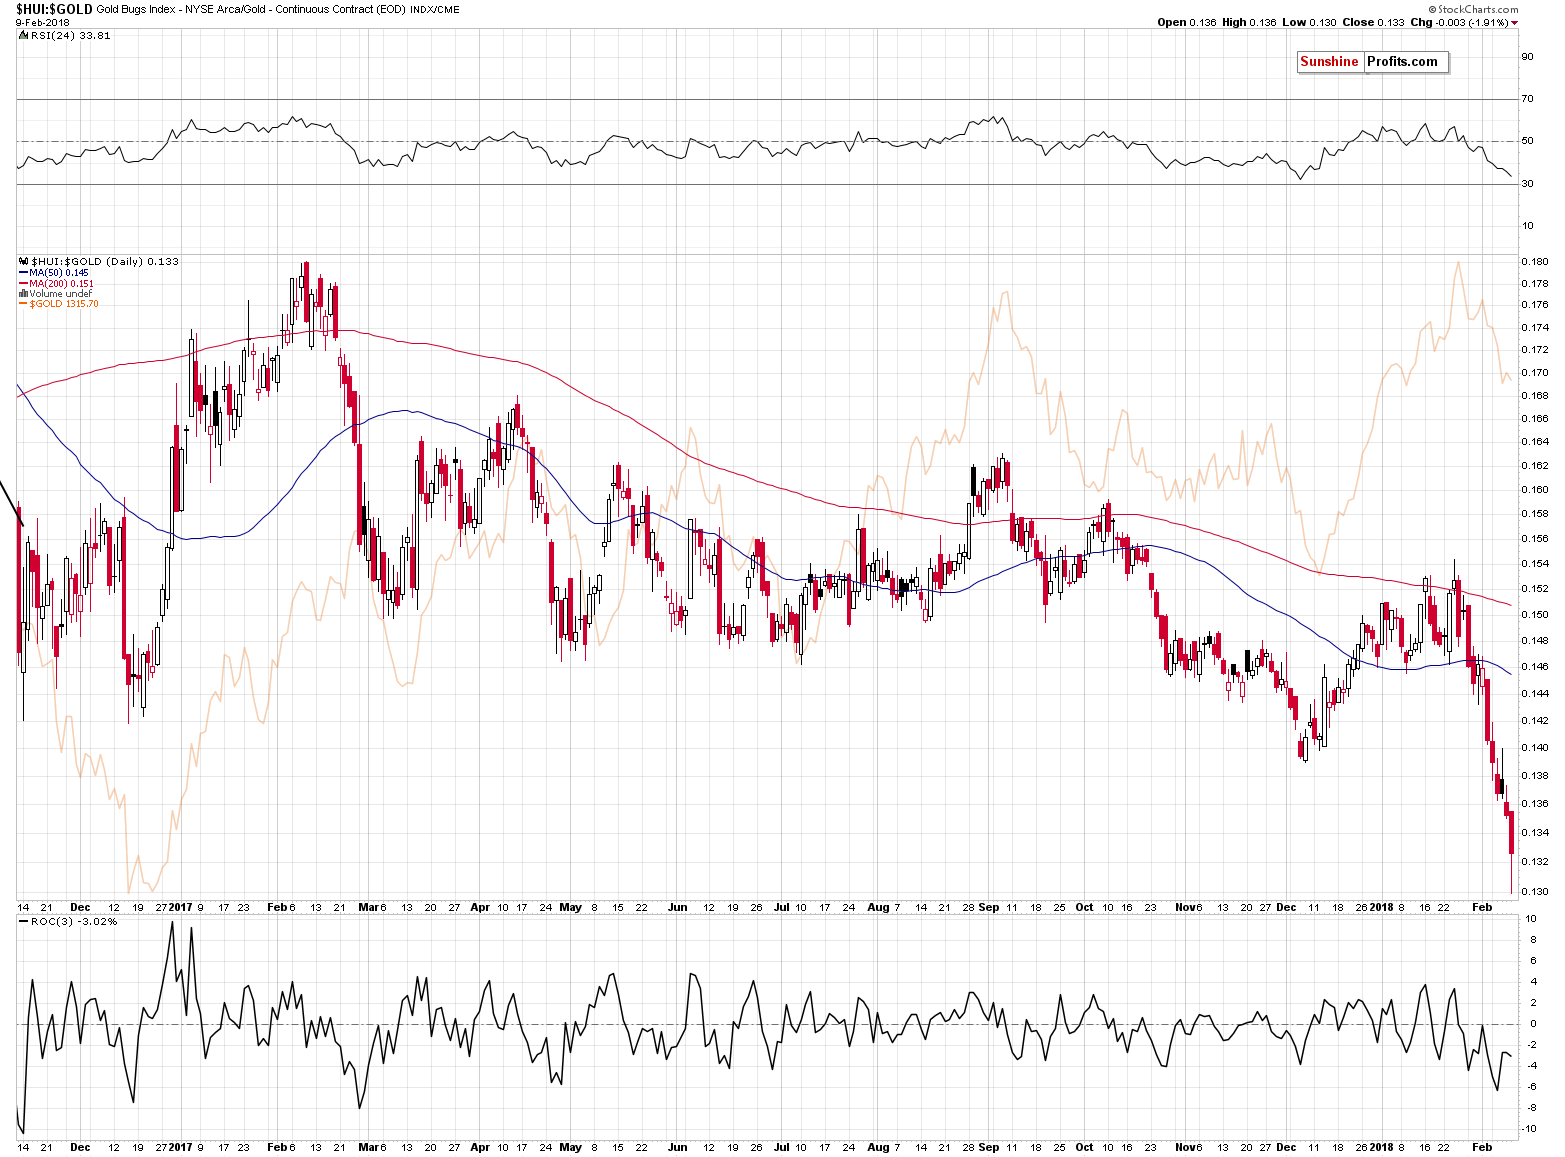
From the short-term point of view, however, we also saw a reversal and it would not be uncommon for the breakdown below the 2016 and 2017 lows to be verified by a move back to them. In the above case, and assuming gold at $1,327, we can look for GDX at about $22.50 before the decline is resumed. With gold at $1,345, GDX could be at about $22.85.
Both levels are visibly higher than Friday’s close, but nonetheless they are below the last closing price of 2017, so even if the mentioned rally did indeed materialize, 2018 would still be a down year for the GDX.
How is it possible for the short-term technical pictures to be so different for precious metals and precious metals mining stocks?
Enter the general stock market.
The decline in mining stocks was a reflection of a decline in the general stock market and as the latter reversed its course on Friday, it’s no wonder that mining stocks did the same.
In Friday’s second alert, we wrote the following:
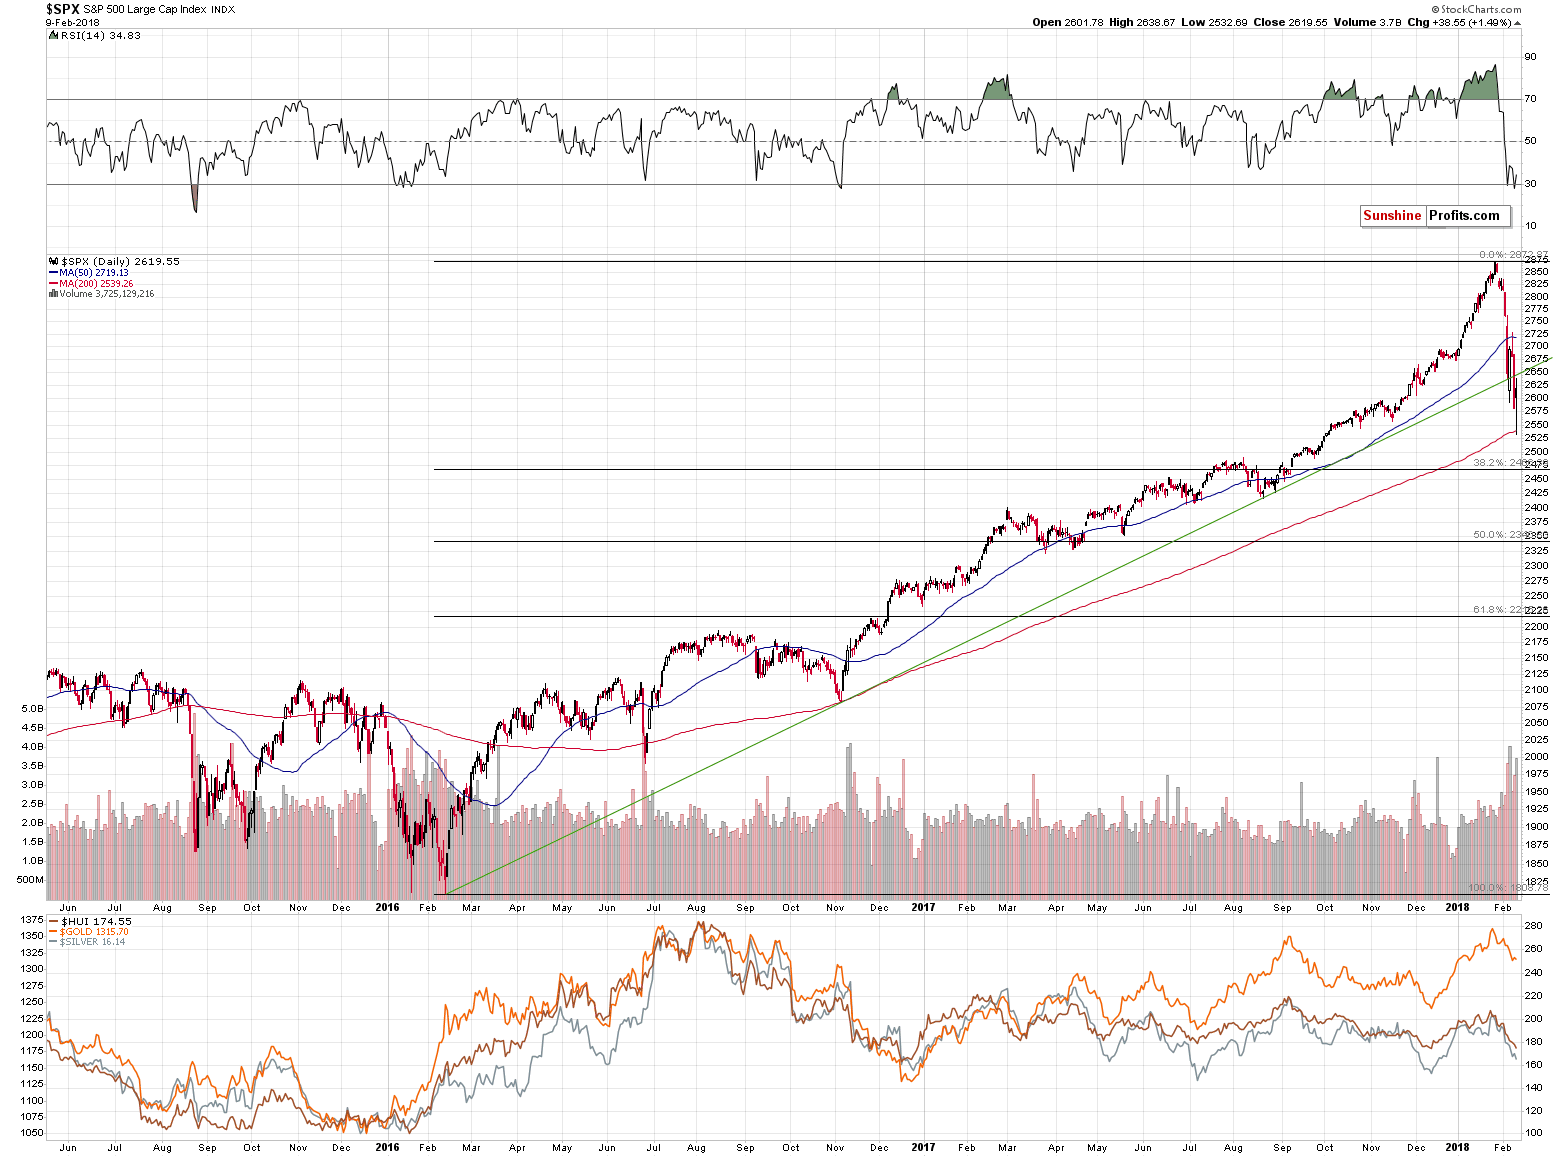
It could be the case that the miners correct along with the main stock indices and the latter are after a major breakdown below a rising support line. Their likely target is considerably lower (at about 2470 for the S&P 500), so it could be the case that miners’ downside potential is still considerable in the short term.
The above is up-to-date, but at the same time we see that stocks reversed with a vengeance gaining about 1.5% and that it happened after stocks reached their 200-day moving average. So, there are good reasons to think that the decline in the stock market is over, but there are also reasons (the first of the classic Fibonacci ratios has not been reached yet) to think that we can see another wave down. Another bearish factor is that stocks broke below the rising, long-term green support line, so Friday’s reversal could be simply a form of verification of this breakdown.
The interesting factor regarding the precious metals market is that since gold and silver didn’t do much and the general stock market actually rallied by 1.5%, then one might expect mining stocks to rally as well. Instead, GDX only erased the intraday declines (in a rather tricky way), while both key indices for mining stocks: the HUI and XAU ended the Friday session lower.
Mining stocks therefore showed weakness relative to both the underlying metals and the general stock market. Is this bullish? Not at all.
All in all, the situation looks bullish based on the GDX ETF and the HUI Index charts, however, seeing what the situation looks like in the case of the general stock market and in the case of the metals and the USD Index makes us doubt if the upcoming corrective upswing is going to be anything significant.
The key question is what to do with an extremely big short position that we currently have. The reply is the same as it is on all other days. It’s critical to ignore the position that you have and its results (in this case we’re ignoring the profits on the entire position) and decide what position you’d open if you didn’t have any.
The signals that we had from mining stocks are too significant for the short term for a short position with 200% or 150% exposure to be justified, so we can rule these exposures out. Is a long position justified? No, because the upside seems very limited (at least in the case of metals) and the odds are that the follow-up decline will be quite sharp, so betting against the bigger trend might be too risky here.
So, the choice is generally between no exposure, a small exposure to lower prices (50%) or a regular one (100%).
At the moment of writing these words, the S&P 500 Index futures are at about 2,650 – right at the mentioned rising green support/resistance line. If this line is invalidated and stocks rally, the outlook for mining stocks will improve, but at this time, the implications are bearish as it might be the case that the reversal-based rally is already over and that it was nothing more than a verification of the breakdown.
Naturally, while making the decision, we need to remember about all the long- and medium-term factors that we described in the previous alerts.
So, taking into account all the above, we choose the 100% exposure to the short position, while being extra prepared to adjust it further as new information becomes available.
We realize that no matter what happens, this is the decision that will generate the worst reactions. If PMs decline, then it will seem bad because we haven’t maximized the gains on the decline. If PMs rally, then it will seem bad because we haven’t exited the position and entered long ones. However, it’s our job to provide you with the analysis that we truly think is most justified that might result in the highest gains in the long term – not to focus on what you may be pleasant to read. No matter what happens, please note that this is the decision that we are making based on the information that we have available today. Consequently, while we know that many will not like this, we are sticking to the short position, but we are limiting it, by cutting it in half.
Summing up, in light of multiple bearish signs for the medium term, no meaningful short-term signs for the precious metals and bullish short-term signs for mining stocks, we are decreasing the size of our short position in gold, silver and mining stocks from 200% to 100% (thus taking half of the profits off the table).
As always, we will keep you – our subscribers – informed.
To summarize:
Trading capital (supplementary part of the portfolio; our opinion): Full short positions (100% of the full position) in gold, silver and mining stocks are justified from the risk/reward perspective with the following stop-loss orders and initial target price levels:
- Gold: initial target price: $1,218; stop-loss: $1,382; initial target price for the DGLD ETN: $53.98; stop-loss for the DGLD ETN $37.68
- Silver: initial target price: $14.63; stop-loss: $17.82; initial target price for the DSLV ETN: $33.88; stop-loss for the DSLV ETN $20.88
- Mining stocks (price levels for the GDX ETF): initial target price: $19.22; stop-loss: $26.14; initial target price for the DUST ETF: $39.88; stop-loss for the DUST ETF $15.78
In case one wants to bet on junior mining stocks' prices (we do not suggest doing so – we think senior mining stocks are more predictable in the case of short-term trades – if one wants to do it anyway, we provide the details), here are the stop-loss details and initial target prices:
- GDXJ ETF: initial target price: $27.82; stop-loss: $38.22
- JDST ETF: initial target price: $94.88 stop-loss: $37.78
Long-term capital (core part of the portfolio; our opinion): No positions (in other words: cash)
Insurance capital (core part of the portfolio; our opinion): Full position
Important Details for New Subscribers
Whether you already subscribed or not, we encourage you to find out how to make the most of our alerts and read our replies to the most common alert-and-gold-trading-related-questions.
Please note that the in the trading section we describe the situation for the day that the alert is posted. In other words, it we are writing about a speculative position, it means that it is up-to-date on the day it was posted. We are also featuring the initial target prices, so that you can decide whether keeping a position on a given day is something that is in tune with your approach (some moves are too small for medium-term traders and some might appear too big for day-traders).
Plus, you might want to read why our stop-loss orders are usually relatively far from the current price.
Please note that a full position doesn’t mean using all of the capital for a given trade. You will find details on our thoughts on gold portfolio structuring in the Key Insights section on our website.
As a reminder – “initial target price” means exactly that – an “initial” one, it’s not a price level at which we suggest closing positions. If this becomes the case (like it did in the previous trade) we will refer to these levels as levels of exit orders (exactly as we’ve done previously). Stop-loss levels, however, are naturally not “initial”, but something that, in our opinion, might be entered as an order.
Since it is impossible to synchronize target prices and stop-loss levels for all the ETFs and ETNs with the main markets that we provide these levels for (gold, silver and mining stocks – the GDX ETF), the stop-loss levels and target prices for other ETNs and ETF (among other: UGLD, DGLD, USLV, DSLV, NUGT, DUST, JNUG, JDST) are provided as supplementary, and not as “final”. This means that if a stop-loss or a target level is reached for any of the “additional instruments” (DGLD for instance), but not for the “main instrument” (gold in this case), we will view positions in both gold and DGLD as still open and the stop-loss for DGLD would have to be moved lower. On the other hand, if gold moves to a stop-loss level but DGLD doesn’t, then we will view both positions (in gold and DGLD) as closed. In other words, since it’s not possible to be 100% certain that each related instrument moves to a given level when the underlying instrument does, we can’t provide levels that would be binding. The levels that we do provide are our best estimate of the levels that will correspond to the levels in the underlying assets, but it will be the underlying assets that one will need to focus on regarding the signs pointing to closing a given position or keeping it open. We might adjust the levels in the “additional instruments” without adjusting the levels in the “main instruments”, which will simply mean that we have improved our estimation of these levels, not that we changed our outlook on the markets. We are already working on a tool that would update these levels on a daily basis for the most popular ETFs, ETNs and individual mining stocks.
Our preferred ways to invest in and to trade gold along with the reasoning can be found in the how to buy gold section. Additionally, our preferred ETFs and ETNs can be found in our Gold & Silver ETF Ranking.
As a reminder, Gold & Silver Trading Alerts are posted before or on each trading day (we usually post them before the opening bell, but we don't promise doing that each day). If there's anything urgent, we will send you an additional small alert before posting the main one.
=====
Latest Free Trading Alerts:
S&P 500 index gained 1.5% on Thursday, as it retraced some of its recent sell-off, following Wednesday's downward reversal. The broad stock market traded the lowest since early October, before bouncing off from around 2,530. Is this two-week-long sell-off the beginning of a new medium-term downtrend or just downward correction? It's hard to say, but this move down set the negative tone for weeks or months to come.
Friday's S&P 500 Bounce To Continue, But Selling May Resume
=====
Hand-picked precious-metals-related links:
PRECIOUS-Gold rises, but gains capped before U.S. price data
=====
In other news:
World shares attempt bounce after worst week in two years
US Treasury yields rise to a new 4-year high as inflation concerns drag on
Why the bond market is freaking out Wall Street
The stock market turmoil was all about good economic news
OPEC President Says Shale Surge Won't Thwart Plan to Clear Glut
Bitcoin Closes in on $9,000 as Regulatory Fears Peter Out
BitGrail Cryptocurrency Exchange Claims $195 Million Lost to Hackers
Monte Paschi Declines as Restructuring Far From Bearing Fruit
=====
Thank you.
Sincerely,
Przemyslaw Radomski, CFA
Founder, Editor-in-chief, Gold & Silver Fund Manager
Gold & Silver Trading Alerts
Forex Trading Alerts
Oil Investment Updates
Oil Trading Alerts

