
- General Stock Market
- Gold
- Silver
- Mining Stocks
- Junior Mining Stocks
- Letters from Subscribers
- Our take on the silver supply shortage
- The problem with technicals
- Summary
The Wall Street Journal had an especially colorful metaphor to describe what has happened to the price of gold that fateful week when Gold tumbled 13% in the two sessions through April 15, the biggest drop in 33 years.
“Slick with the viscera of crushed gold bugs, the world’s trading floors look even more treacherous than usual.”
Do we feel like crushed bugs? Not at all.
Do we think that the bull market in gold is over? Not yet.
Do we know that markets can be cruel? Hell, yes.
Needless to say the gold bears have been feeling lately like they have landed in a huge vat of honey. They are smug, to say the least. But we see this as an opportunity to get back into gold at a lower price and in the meantime, we made money shorting some of the downside. We are not alone. Jim Rogers, who foresaw the start of a commodity secular bull market in 1999, said this may be the correction that gold needs. “If it goes down enough, I will start buying it,” he told reporters.
Marc Faber, publisher of the Gloom, Boom & Doom report, could hardly contain his glee at the opportunity offered by the steep drop.
“I love the fact that gold is breaking down because it will give a good entry point. The fundamentals for gold are intact.”
He pointed out that while gold may be down 21 per cent from its September 2011 high, Apple is 39 per cent lower than last year’s high. The S&P is almost 1 per cent higher than its peak in October 2007, but over the same period gold is up 100 per cent.
The reason we don’t feel like squashed gold bugs is because we (and you if you followed our suggestions; please note that we take action after sending out the Alert / Update to you not before it) didn’t participate in a significant part of the decline.
Way back on April 4, seven trading days before the start of the big decline, we suggested getting out with half of the long term mining stock investments when the HUI Index closed at 330.
A day later we re-emphasized it - note the table at the end of the update.
On Friday, April 12, 2013, 11:22 a.m., we sent out a Market Alert in which we suggested closing the remaining long position in mining stocks and also closing half of the long-term gold and silver investments. That was the most significant of the alerts as it covered half of the entire long-term investment position. Silver was above $26 at that time and gold was trading around $1,500.
On Monday, April 15, we sent out an alert at 6:22 a.m. and suggested to close the remaining long-term position in gold and silver when gold was still above $1,400, and silver was above $23.50. We also suggested opening speculative short positions.
We noted that “we're not getting out of the precious metals market because we got scared. We are not selling our gold and silver because we think this market has no future. We are not selling precious metals because we think that the bull market is over.
We are selling because we realize that even the greatest of bull markets can at times decline significantly with no particular logical reason. We know that something like that happened over 30 years ago during the previous bull market when the price of gold dropped by almost half before it moved to the high which was multiple times the previous one.
On April 15, at 12:34 p.m., we suggested closing the short position in silver if silver moves below $22.10 and open a long one. Soon after that silver moved to $22. Two days later (April 17) we suggested closing the long position when silver was at $23.57. Whatever the outcome of the currently open trades will be (we know the worst-cast scenario because we have stop-loss orders), this decline seems to have been an opportunity – to get some profits from trading and to save some capital by getting out at higher prices (thus outperforming the buy-and-hold strategy).
There has been a lot of hyperbole going on. We even heard it said that a move of that scale would statistically only be expected “once every 4,776 years.” Going even further, John Kemp of Reuters calculates that, based on a normal distribution (by the way, market returns are not normally distributed), movements like this can be expected once in every 500 million trading days, or two million years. Sounds far-fetched?
Pundits have given a garden variety of reasons for the decline. Goldman Sachs in an April 10 report reduced its gold futures forecast and made a self-fulfilling prophecy to short gold, hurting gold sentiment and likely triggering stop-loss orders. (They must be laughing all the way to the bank. Wait, they are the bank.) Cyprus said it might unload 10 tons of reserves to help fund its bank bailout - the biggest sovereign sale for several years. It stoked fears that similar gold sales may be forced on other troubled Eurozone countries. Italy has the fourth largest gold holdings in the world of 2,452 tons.
China's economy grew “only” 7.7% in the first quarter, undershooting market expectations for an 8% expansion. China is the world’s second largest buyer of gold. There were concerns that the U.S. stimulus may be cut short since minutes of the Fed released just before the big decline in gold prices showed some officials were interested in ending the QE program this year. Another theory posits that since the new Japanese central bank governor promised to re-inflate the Japanese economy, Japanese government bonds (JGBs) have been on a wild ride. When investors in volatile assets are asked to put up wider margins they often sell assets they are holding. In this case, CME’s decision to raise margins for the entire precious metals sector is another bearish factor for the short term.
Bull markets have a parabolic stage when everyone is in a frenzy to get in and prices go up in a straight line. We have yet to see that spike.
Gold prices have been slowly gaining back some of the lost ground as traders and investors step in to buy bargains. Since making the call that started the downward spiral Goldman Sachs has covered its gold short this week.
There has been strong demand for physical gold, especially from Asia, which continues to underpin the gold market. Asia is witnessing one of the strongest waves of physical gold buying in 30 years. Retail sales of gold tripled across China April 15 to April 16, the China Gold Association said. The feverish buying has left many of Hong Kong’s banks, jewelers and even its gold exchange without enough gold to meet demand.
We don’t see any changes in the fundamentals for gold to make us think the bull market is over. There is still large unemployment, ballooning national debt, currency debasement and currency war, eurozone problems, QEs etc. etc. We like gold for the same reasons we have like gold for the past decade.
This week we've decided to dedicate the Premium Update almost entirely to the precious metals sector. The related markets have not had much impact on the precious metals, which have been moving pretty independently of late. We will put our emphasis on gold, silver and the precious metals mining stocks and related ratios as we feel this is the best use of our time this week. We will feature one stock market chart, though.
When this correction is done and the bull market takes off again, we want to make sure that you – our subscribers – and ourselves are among those that are invested. Is it time to be already back in the market? Let’s take a look (charts courtesy of http://stockcharts.com).
General Stock Market
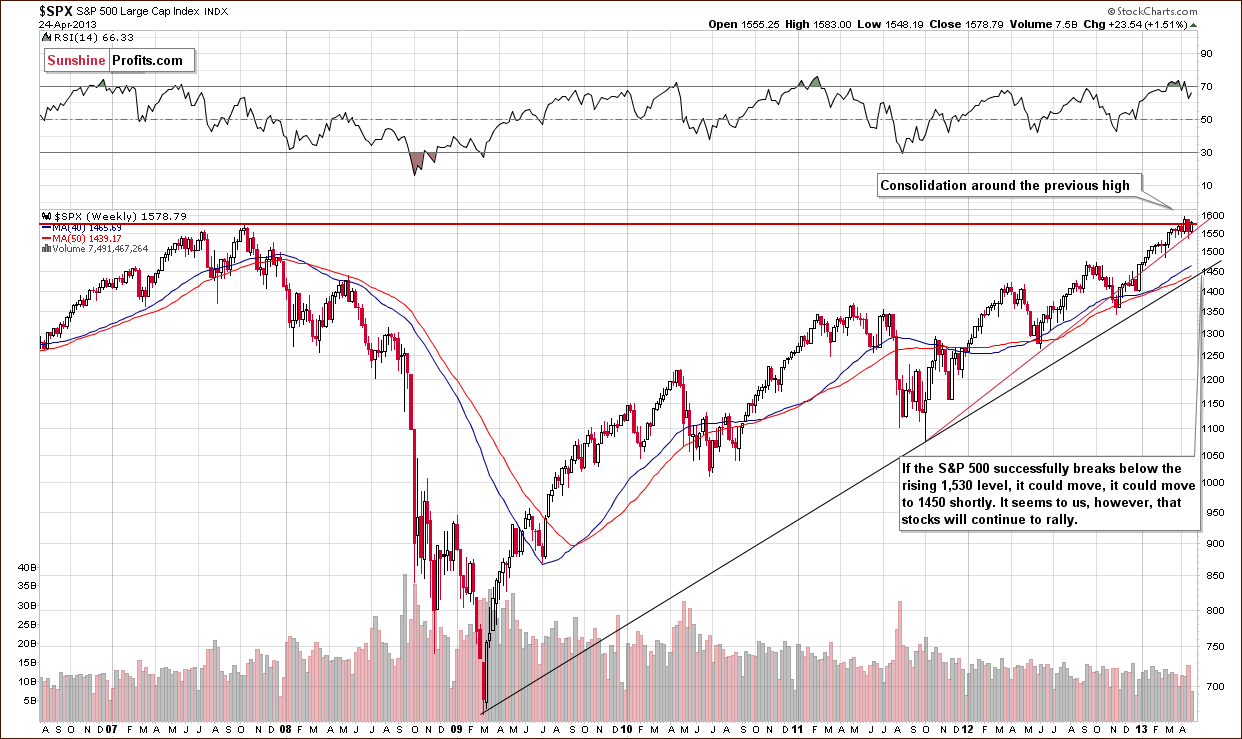
We begin this week with the long-term S&P 500 Index chart. A few weeks ago, the S&P 500 moved above their 2007 high and though the situation was bullish, we discussed the likelihood of some consolidation. In April 12 Premium Update we wrote that the RSI levels were overbought so a short-term consolidation was possible before the rally picks up and it’s what we have seen for almost 2 weeks now. The S&P 500 consolidates close to its 2007 top and the DJIA trades sideways above its 2007 high, thus verifying the breakout.
The outlook is bullish for the general stock market, with stock prices above previous highs indicating optimism about the economy on the whole. The sentiment seems to be that things are all right now and the worst is behind us - it seems that higher stock prices are ahead. This is something which discourages precious metals investment, as some investors view gold as the anti-asset meaning that loses its appeal when everything is going well. This is a negative factor for the short- and perhaps medium-term, but not for the long-term because we think that people will eventually realize that just because the nominal stock prices are rising, it doesn’t mean that gov’ts can get away with series of QE programs without higher gold prices.
Gold
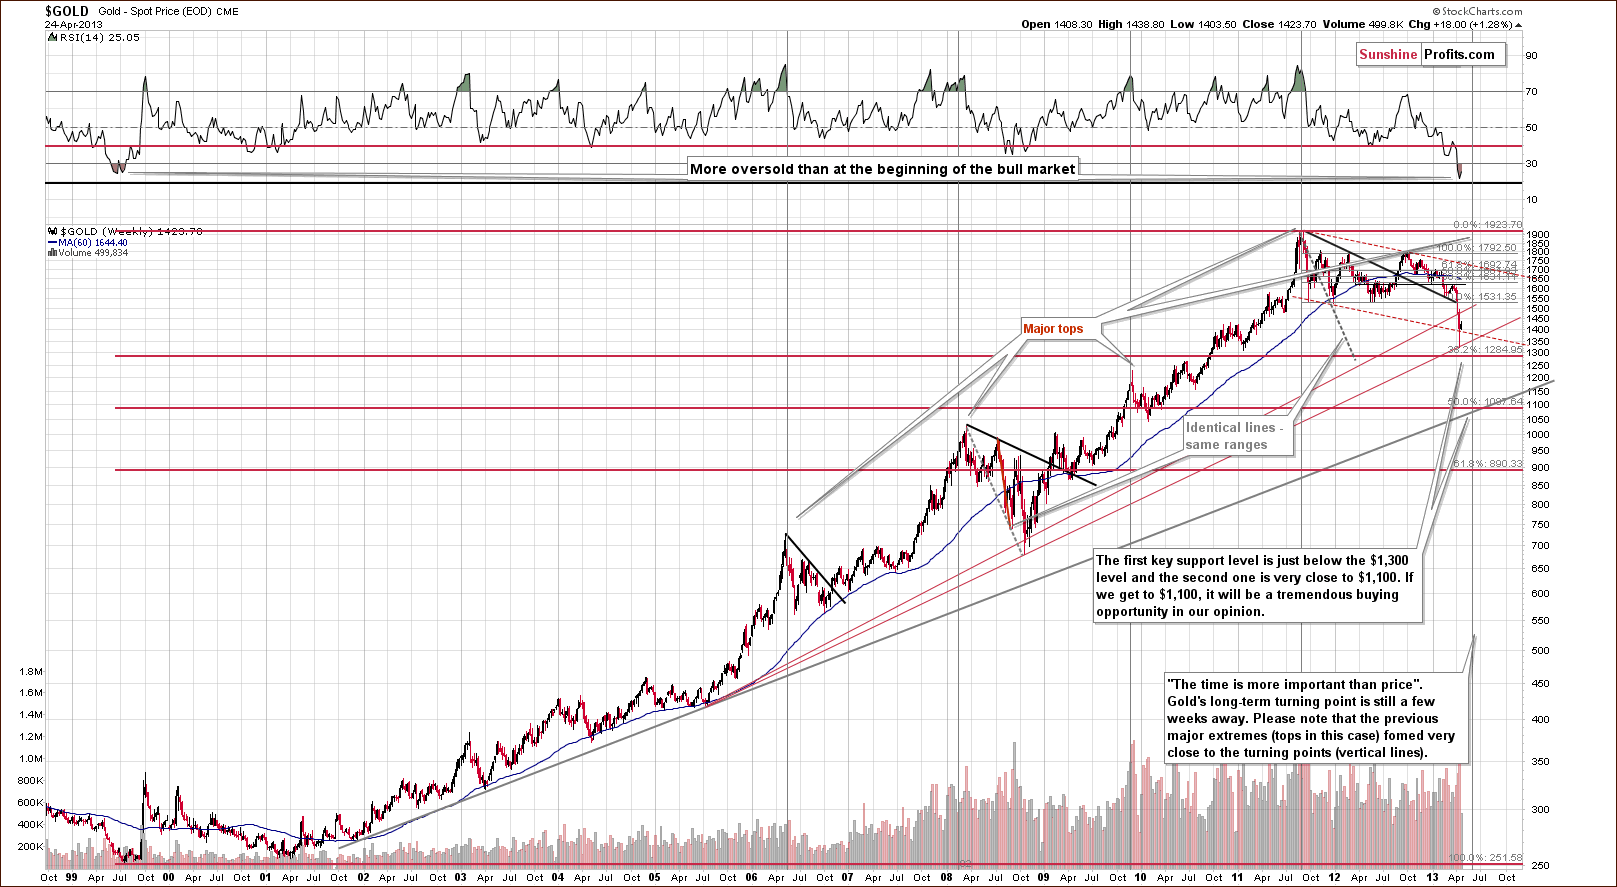
In this week’s very long-term gold chart, we see a pullback, which will be more visible when we zoom closer in our next chart. A local bottom may have been reached, though it seems that further declines are likely from here.
At this point, this major long-term cycle is still several weeks away, and with the precision of this cycle in the past, we expect that the final bottom will be seen much closer to it than what we’ve seen recently.
Please note that gold could decline to as low as $1,100 and still be in a long-term uptrend. In fact, technically, it could decline all the way to the 61.8% Fibonacci retracement level close to $900 and still remain in a bull market.
For now, the first Fibonacci retracement level provides the key support and this is where we expect the bottom to form – close to $1,285. It seems that if we see it move below this level and the breakdown is confirmed, then the yellow metals could decline all the way to $1,100 shortly.
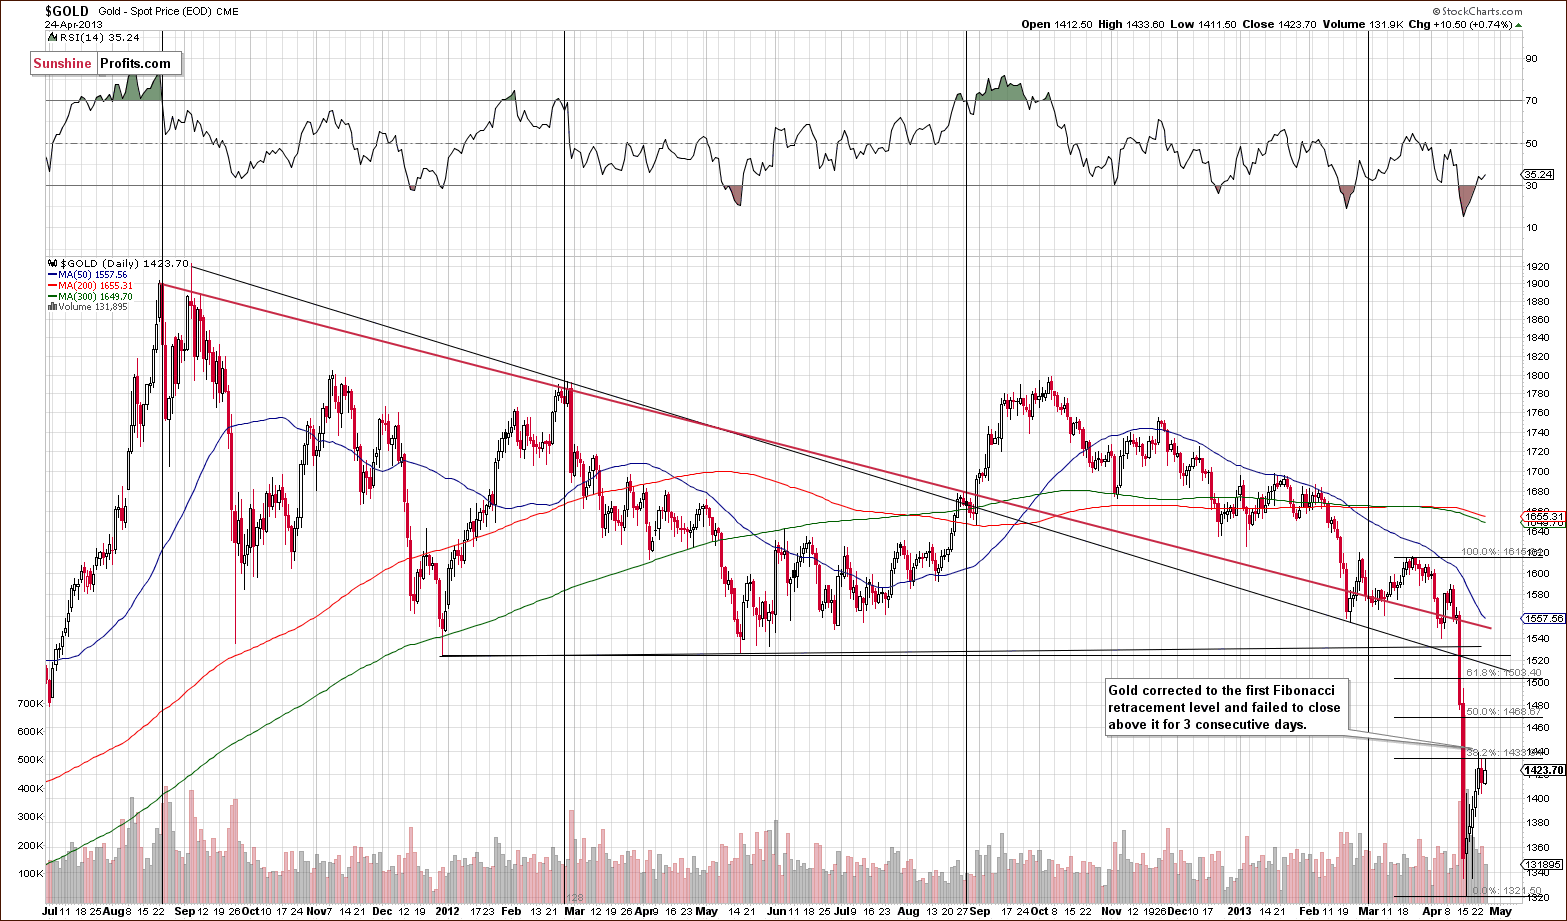
In the medium-term gold chart, we saw a correction this week as gold’s price rallied to the 38.2% Fibonacci retracement level but did not manage close above it. Prices consolidated below this level and the correction could actually be over. We have a situation where the minimum pullback was already seen – the bound is no longer likely because it was already seen. The RSI indicator reflects that – the market was extremely oversold on a short-term basis, but it’s no longer the case.
We see that volume levels were low on Wednesday when prices rallied, which is not a good sign. In order to confirm this and get a better look at volume levels, we turn to our next chart featuring the GLD ETF.
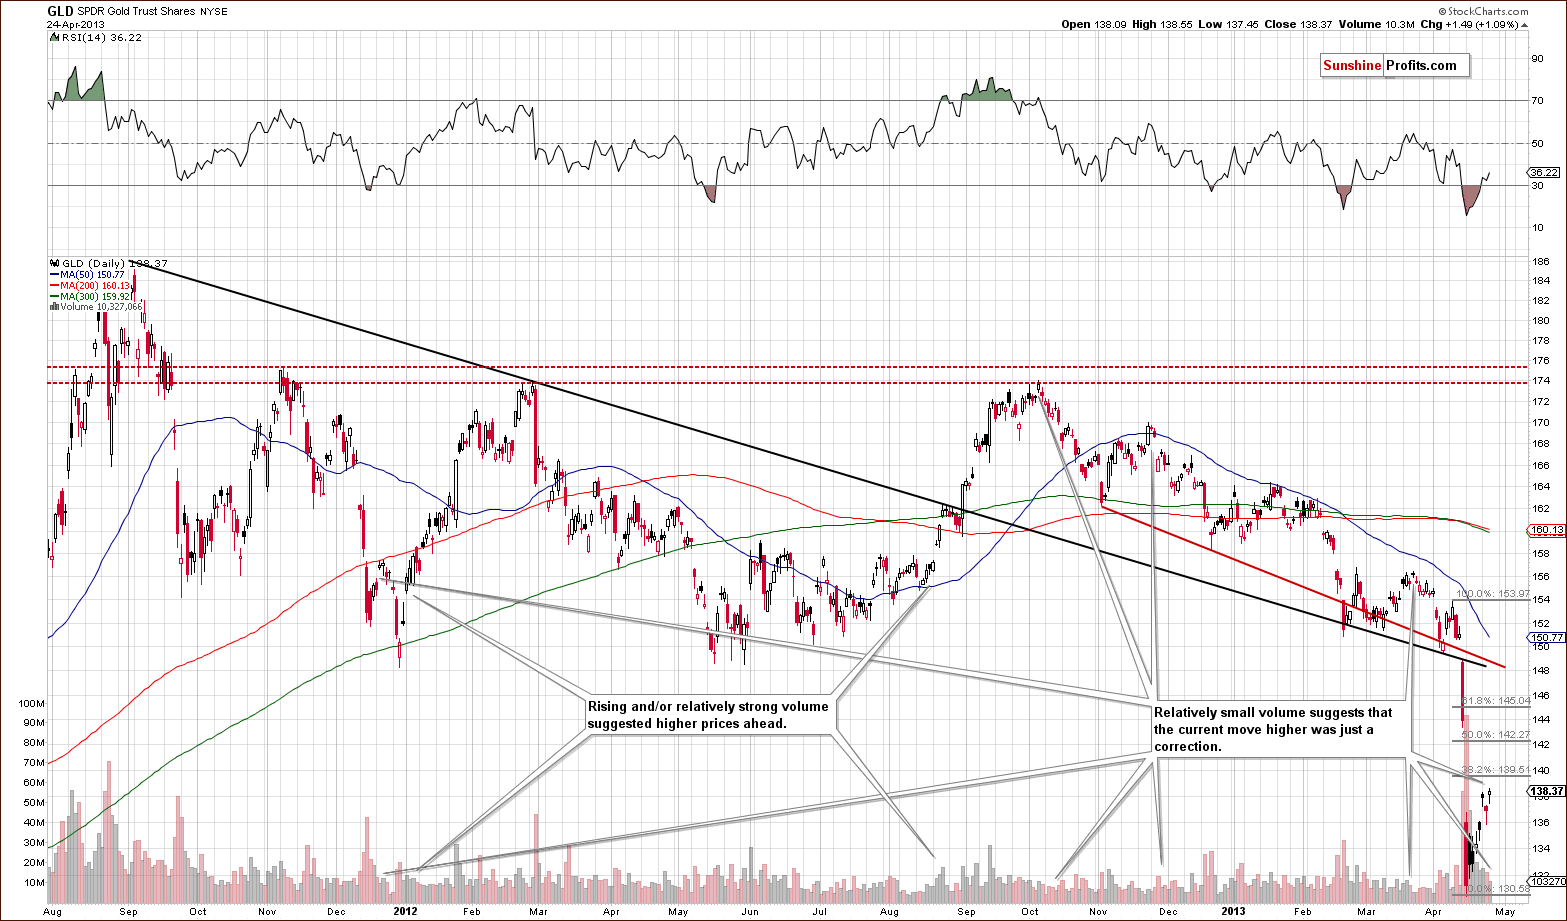
In this week’s GLD ETF chart, we see that volume levels were indeed low. Analysis of volume is often clearer when two charts confirm each other. Volume levels are seen more clearly here in the GLD ETF, whereas price levels are better seen in the spot gold chart. Therefore, the fact that GLD didn’t correct to the first Fibonacci retracement level doesn’t change much, as levels based on spot prices are more important.
Please expand the chart to see when volume confirmed tops and when it indicated that a bigger rally is ahead. The particularly interesting analogy is between now and late 2011 when gold pulled back (on low volume) after a sharp decline and then declined once again, forming the final bottom slightly below the initial one. The final bottom was confirmed with more significant volume.
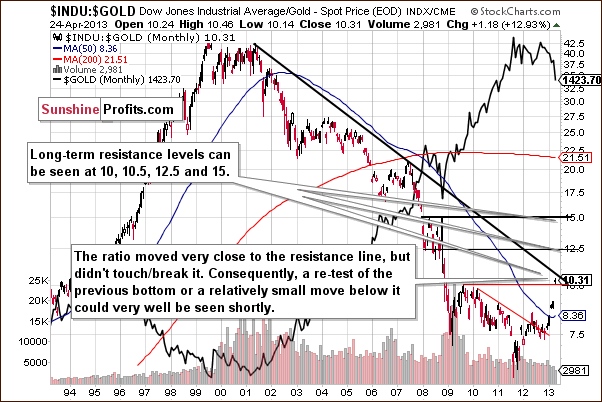
In this week’s Dow to gold ratio chart, we see that the ratio moved close to the declining resistance line but didn’t really reach it. There is still some room for the ratio to move higher. If gold declines to its previous low or slightly lower, this declining resistance line will be reached, so basically further weakness could be seen here. The important point here is: the Dow to gold ratio chart does not imply a move higher for gold prices just yet.
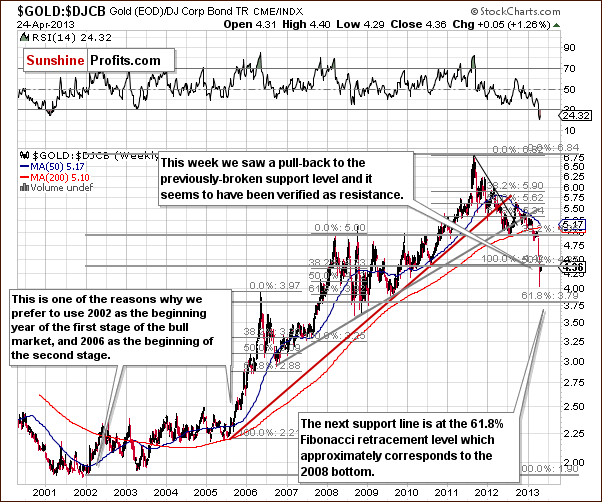
In this week’s gold to bonds ratio chart, we have another indication which may show us where gold might be going. Here we see a significant decline in the ratio followed by a correction to the previously broken support level (based on one half of the 2001-2012 rally). Gold’s price is back up to but not above it. Consequently the breakdown below this important support level was not invalidated (for now it seems that it’s being verified) and thus the ratio – and gold – are likely to move lower – perhaps to the final Fibonacci retracement level which coincides with the 2008 and 2009 lows.
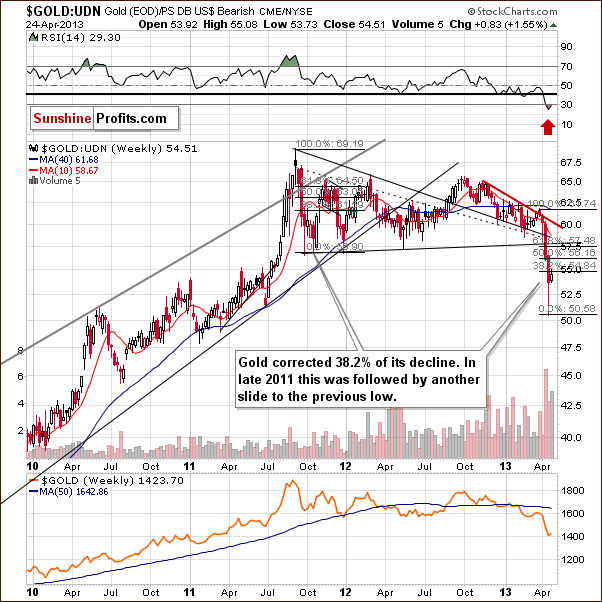
In this week’s chart of gold from the non-USD perspective, gold’s average price in other currencies, we have also seen a correction to the first Fibonacci retracement level without a weekly close above it so far. Declines could very well continue here for the time being.
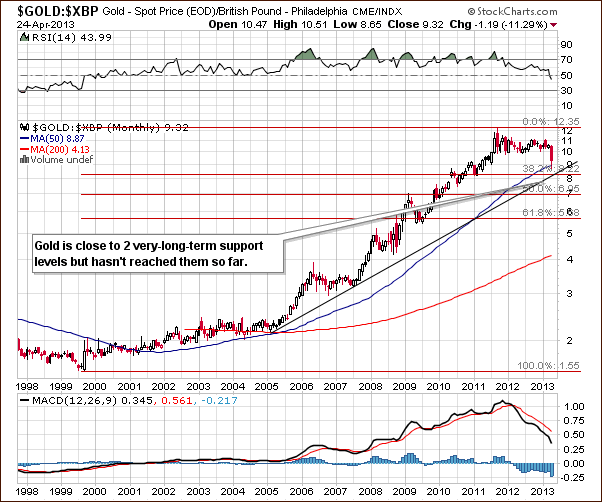
This week we feature two charts of gold from the British pound perspective. In the first, the long-term perspective, we see gold’s price close to a support line, one which has not been reached so far. We expect the bottom to be formed, when they are reached. Without it, the current move higher seems to be more of a correction than a beginning of another big rally. Let’s take a look on the short-term chart for more details.
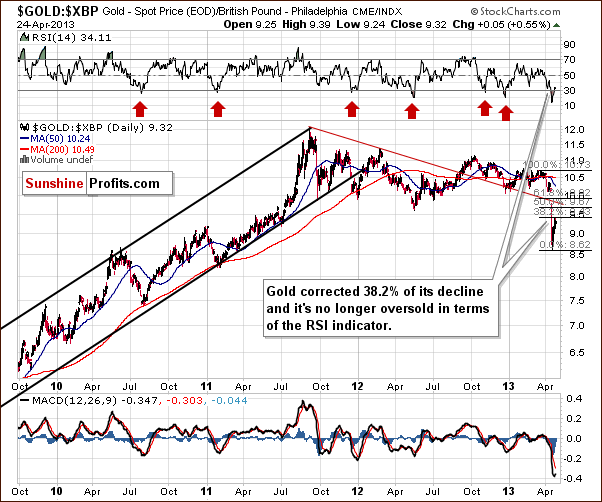
The short-term chart shows that gold has corrected to the first Fibonacci retracement level, which all-in-all confirms what we saw from the long-term perspective of gold priced in British pounds and in other gold charts – that the pull-back may already be over as gold reached reached its first Fibonacci retracement level known for being the first likely target for corrective moves.
Summing up, generally this week’s gold charts indicate that the yellow metal could move just a bit below its April local low before forming a final bottom and that it will take a few more weeks before the rally really starts. There are also some indications that the correction is already over or close to being over.
It seems that Thursday’s early-trading rally of $17 in gold and $0.46 in silver (the moves that we see at the moment of writing these words) took gold once again to its Fibonacci retracement levels from the non-USD perspective. In case of the regular USD perspective, it is indeed a move higher slightly above the first Fibonacci retracement.
Silver
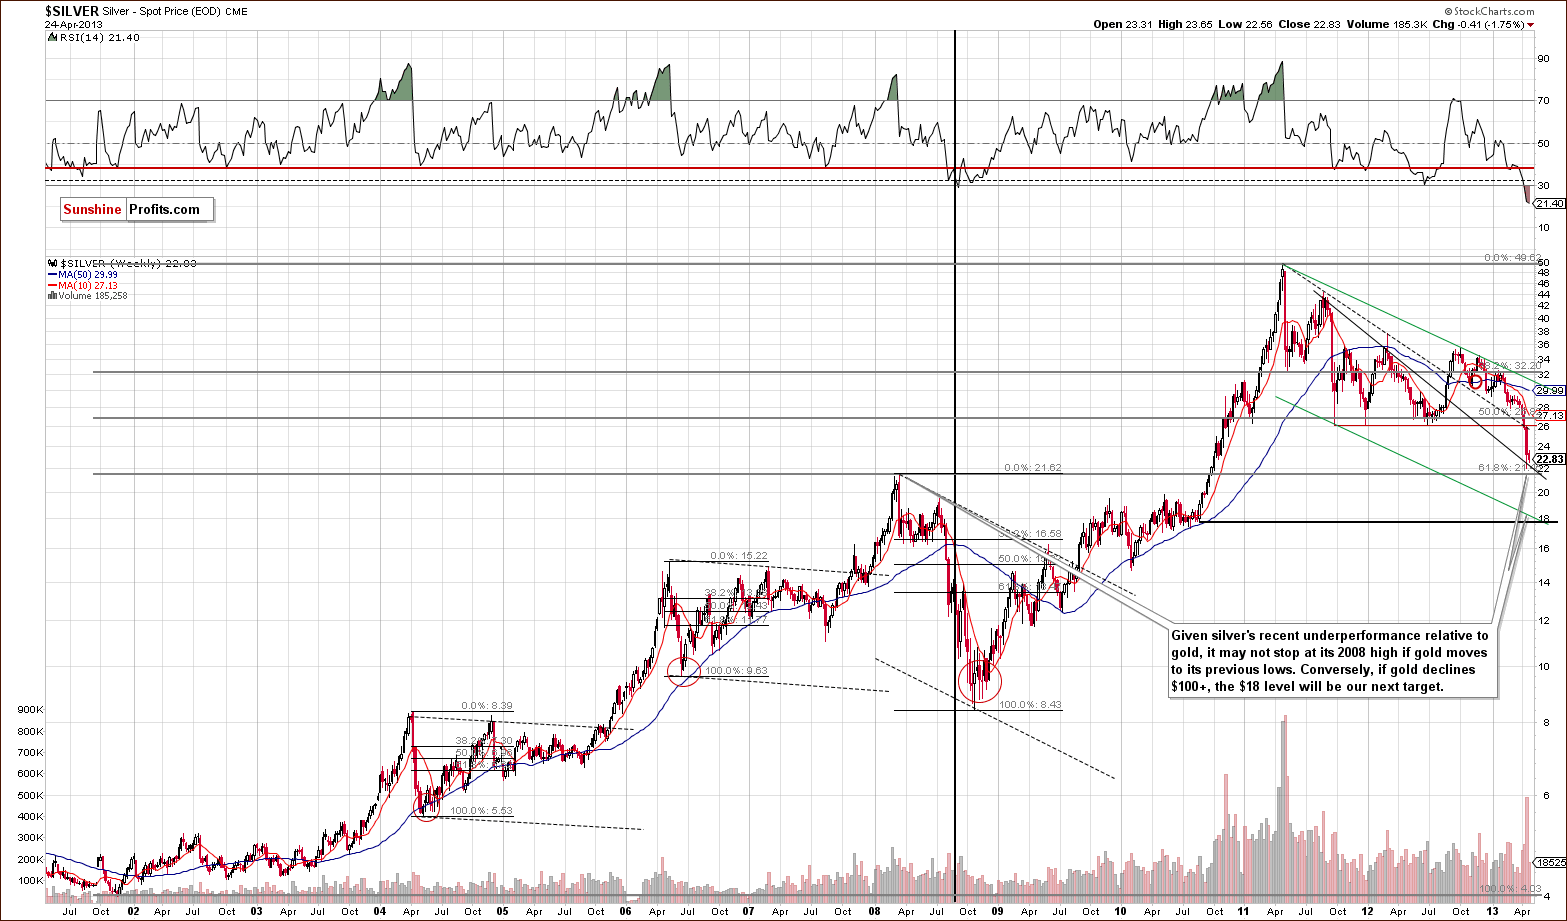
In this week’s very long-term silver chart, we don’t see the same corrective price action as we saw for gold. Silver prices declined this week, which is not a good sign. Unless we see higher prices in the next two days, we’ll have another lower weekly closing price for the white metal.
Declines simply continue here; gold prices corrected quite a bit and silver did not. If this underperformance continues and gold prices move lower by $100 or so, the implication appears to be that silver will decline sharply to perhaps the $18 level or so. This price level is created by the July local bottom and the declining trend channel (parallel, green lines on the chart above), and the price level where the huge 2010 to 2011 rally began.
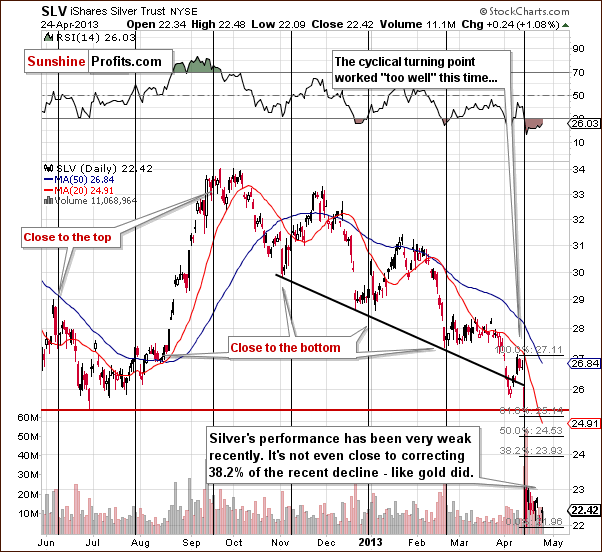
In the short-term SLV ETF chart, the underperformance of silver is very clearly visible. While there has been some sideways trading, prices have declined overall, and the lack of any real pullback indicates the overall weakness of this market at the present time.
Given Thursday’s pre-market move in the SLV ETF to $22.82 (silver at $23.64), we still see no significant change in silver’s performance – it’s correction is still very small compared to the one seen in gold.
Since silver’s underperformance is such an important issue at this time, we decided to examine it particularly closely.
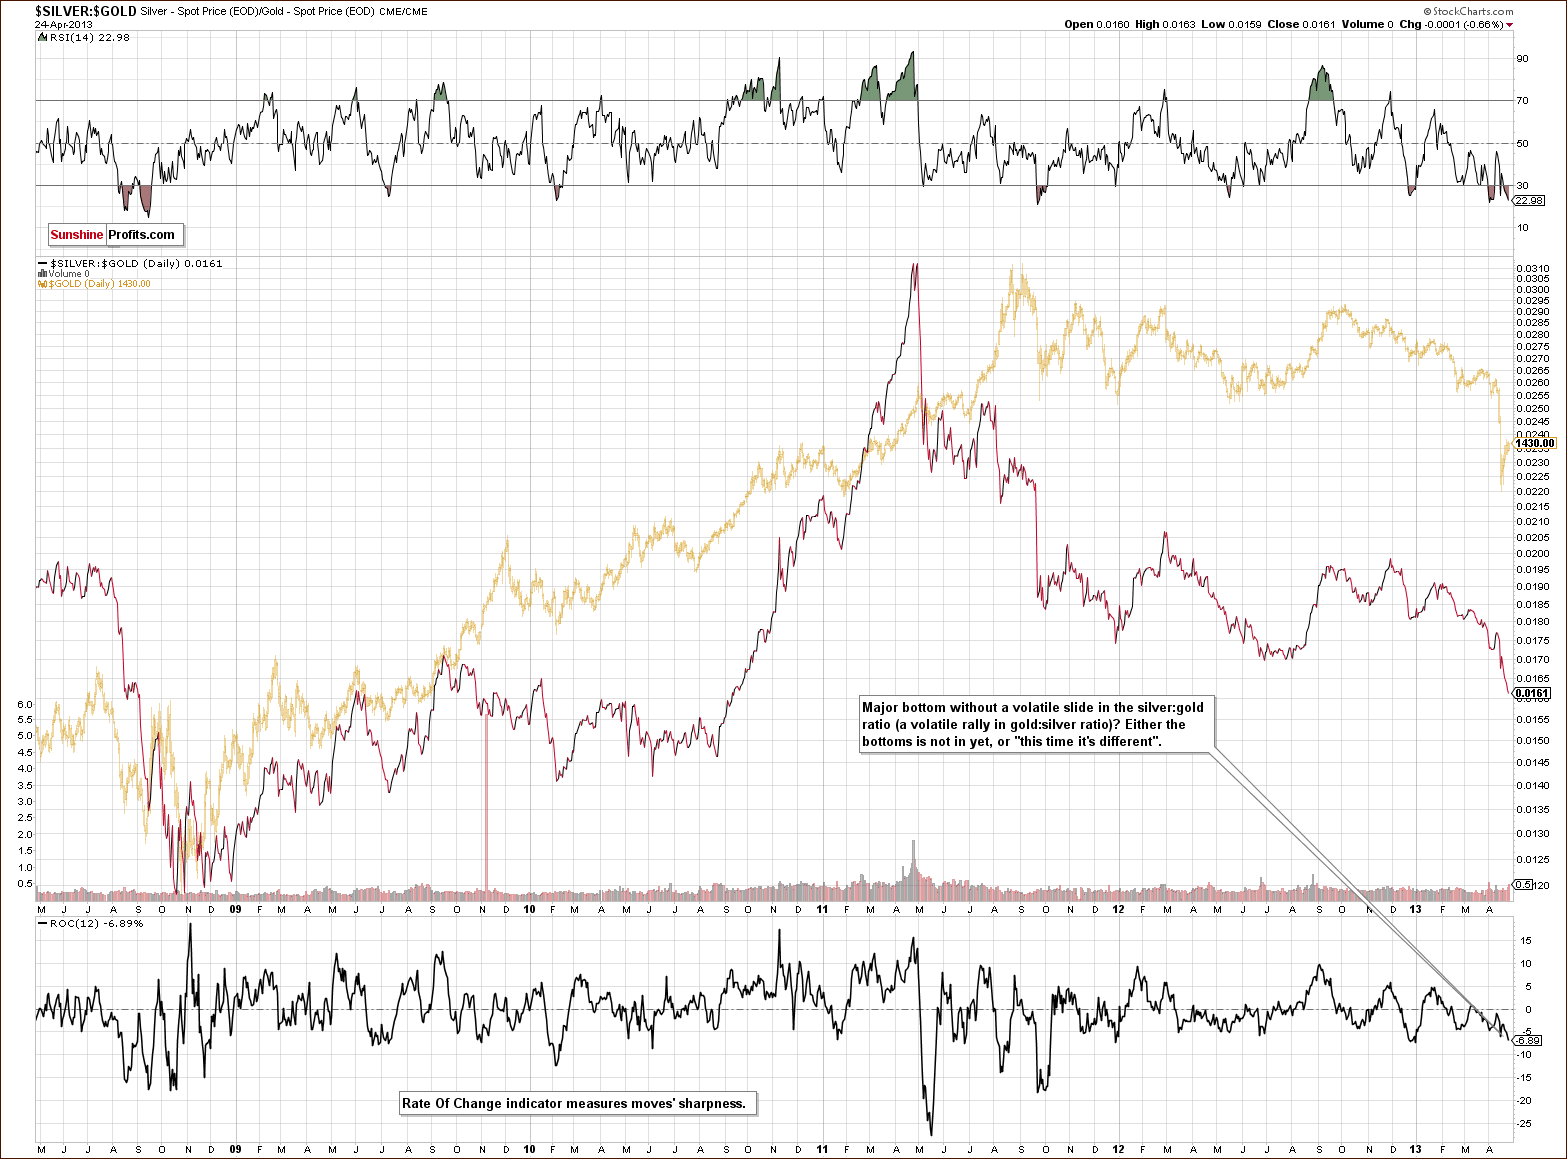
In this week’s silver to gold ratio chart, we present a somewhat new view of this ratio. We’ve discussed the underperformance of silver for some time now so we felt this graphic would be useful. We believe it’s best to plot the rate-of-change indicator (ROC) on this ratio as it does a very good job at measuring sharpness of given moves. The solid line in the chart is the ratio itself with gold’s daily price in the background and represented by the gold line.
The key point here is this: major bottoms used to be preceded by a sharp drop in the silver to gold ratio. We used to see either capitulation of silver investors or artificial sell-offs before the declines were over. Regardless of what the reasons were, it’s something that used to happen before the bottom was truly in. Recently, however, we saw prices declines in silver but not as sharp as expected relative to gold if a major bottom was forming. In the recent days, we have seen steady underperformance rather than a very sharp drop in the ratio. It looks on the chart like the trend is accelerating, though, sort of like a reversing parabola.
Ideally, we’d like to see a lower rate-of-change indicator, say -10 or -15 at least before stating that the final bottom is in. This indicator barely moved when the precious metals declined heavily earlier this month. The declines seen in 2008 and in the first 2 months of 2010 provide a good example of what the indicator can do. At first, metals declined but silver not as significantly as gold. Only when gold formed a major bottom, did the ratio decline sharply. We would like to see this confirmation also in case of the current decline.
Summing up, silver has been underperforming recently but not as extremely as we would expect during a major bottom. It seems therefore that the final bottom is still ahead of us. Thursday's move to $23.64 doesn't invalidate the above.
Gold and Silver Mining Stocks
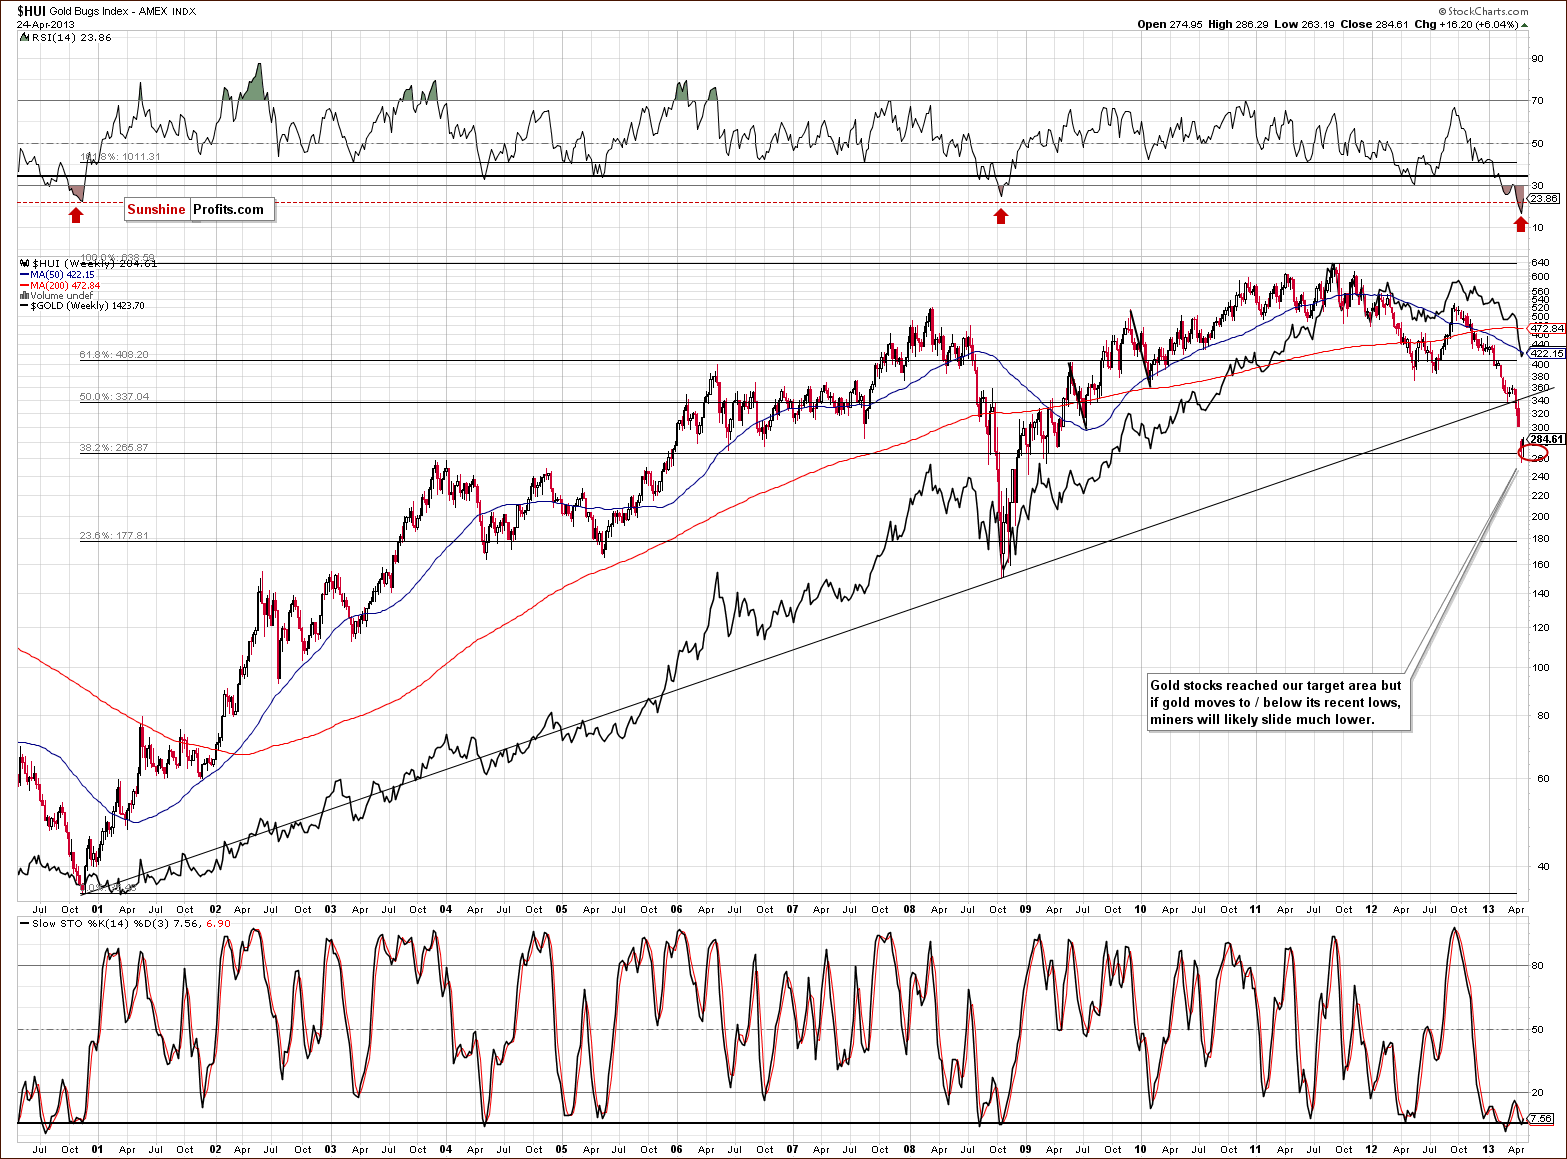
In this week’s very long-term HUI index chart, we see the index formed a local bottom at the final classic 61.8% Fibonacci retracement level of the whole 2000 to 2011 rally, which is a bullish factor. Look at the medium-term performance of mining stocks, however. We see a major downtrend, which is accelerating. Yes, miners are extremely oversold, but the mining stocks have been extremely oversold throughout April and, in fact, for most of 2013. So the question is, “Has the final bottom already formed?”
If gold’s price declines another $100, the gold stocks would probably break below their recent support line and move lower regardless of the current support. Lower support lines are a bit unclear in this HUI Index chart so we’ll turn to the XAU Index (another proxy for mining stocks) chart now.
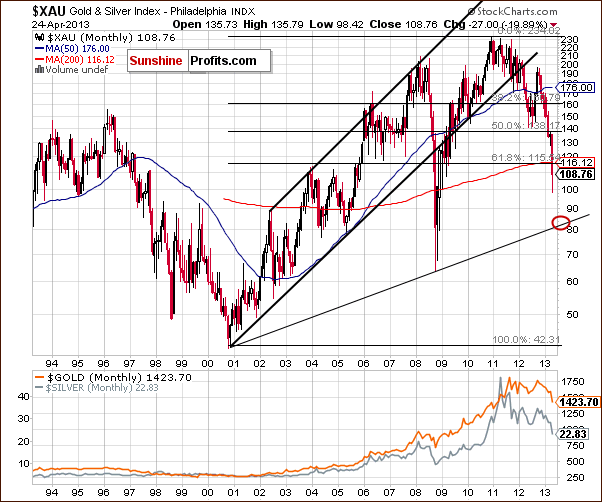
On the above chart we see a support line above the 80 level, and it is a major, long-term, and clearly visible support line. The mining stocks are relatively far from this price level today, but would be very much in the trading range if gold moved to or slightly below its April lows.
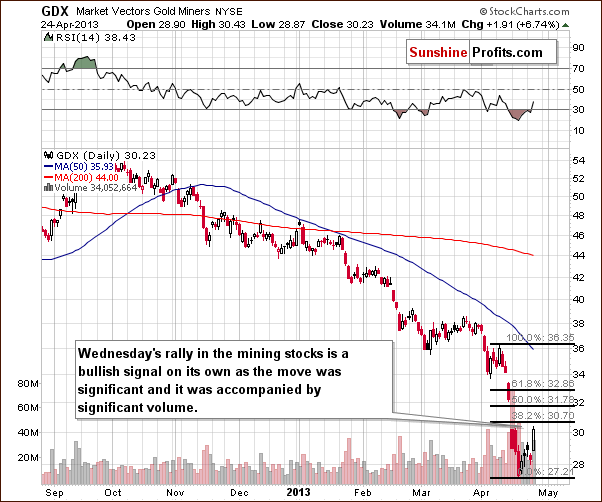
In this week’s short-term GDX ETF chart, we first see that we are no longer oversold here on a short-term basis. Some correction has been seen, which seems to have made the situation a bit more stable – RSI is back above the 30 level.
This bottom may have formed several days ago and Wednesday’s rally, which was relatively significant and accompanied by high volume, is a bullish sign. On the other hand, we did see similar price action in early March, however, and the rally was followed by a rather unimpressive move to the upside, so we remain a bit skeptical. Additionally, silver is not confirming this bullish outlook. All-in-all, this chart alone appears to be a bit more bullish than not, but we would prefer to see a breakout at least above the first Fibonacci retracement level and some strength in silver before considering getting back on the long side of the market.
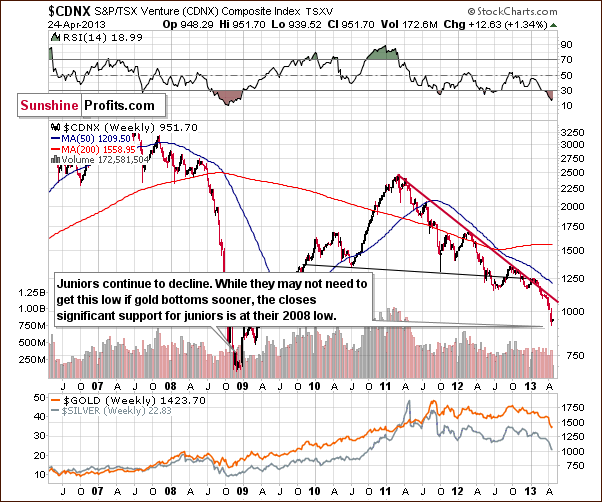
Our final chart this week is the Toronto Stock Exchange Venture Index (which is a proxy for the junior miners as so many of them are included in it). The juniors continue to decline even though a small rally has been seen for a few days now. Overall the trend is down here, and the negative thing about it is that the trend has accelerated recently. If gold prices decline further, significant declines are probable here and in the prices of the junior mining stocks. Some of them will decline less than others, though.
The most important bearish fact here is that in this chart the only significant support line below current price levels is the 2008 low. While prices may not go so low, if this support level is reached, it will present a good buy opportunity in our opinion.
Summing up, the technical situation for the mining stocks actually appears bullish at this time. Based on silver’s underperformance and gold’s price levels, however, we are not convinced that the situation is indeed bullish. While it is noteworthy that the GDX ETF rallied on significant volume on Wednesday, it is unclear whether the mining stocks are signaling strength and leading gold, or if the weakest sector is suddenly beginning to outperform at the very end of a corrective rally. The mining stocks have clearly been the weakest of the precious metals sectors in recent months.
Junior Mining Stocks
As stated in the Gold & Silver Portfolio report, the list of top juniors will be updated approximately every 4 weeks, usually at the beginning of the month. We skipped this part of the update in the past 2 months, as we believed this sector will not perform well and we were waiting for the bottom to be reached in order to estimate each miner’s strength during the decline.
However, we have received a specific request from one of our subscribers to cover juniors in this update, so here we are.
As a reminder, in our view, one of the most important considerations when choosing junior mining stocks is their performance relative to the rest of the sector and also their strength during a decline and the subsequent bounce. For juniors, we can’t apply sophisticated algorithms that we use in our rankings of senior gold stocks and silver stocks because the market for each junior is too small and the small price moves may not properly reflect the stocks’ true value. For the same reason junior mining stock prices can be manipulated more easily (diversify to lower the risk of being affected!). And this is also why we don’t analyze individual juniors from the technical perspective on a regular basis.
If you have been wondering if this approach makes sense during market downswings, we have calculated the performance of stocks that were included in our previous Top Junior Rankings and this is what we found taking into account the period Feb 8, 2013 to Apr 23, 2013:
Juniors included in the rankings (both gold and silver) have declined by approximately 26%
The GDXJ (Market Vectors Juniors Gold Miners – proxy for the junior sector) declined by about 36%
We have suggested limiting the exposure to juniors, and then to the entire mining stock sector, but if we had not then the methodology that we use for selecting juniors would still have saved you about 10%. Furthermore, it seems that this methodology is useful during both upswings and downswings.
You can see the results of our latest research on juniors in the tables below:
| Top Gold Juniors | April 25th, 2013 | ||
|---|---|---|---|
| Rank | Symbol | Company | |
| 1 | RIO.TO | RIOAF | Rio Alto Mining Ltd. |
| 2 | OGC.TO | OCGPF | OceanaGold Corp. |
| 3 | ARZ.TO | AZK | Aurizon Mines Ltd. |
| 4 | PTQ.TO | PTQMF | Petaquilla Minerals Ltd. |
| 5 | OSU.TO | ORSUF | Orsu Metals Corp. |
| 6 | IAU.TO | IAUFF | Intrepid Mines Ltd. |
| 7 | XRC.TO | XRA | Exeter Resource Corp. |
| 8 | MDW.V | MDW | Midway Gold Corp. |
| 9 | DMM.TO | DMMIF | Dynasty Metals & Mining Inc. |
| www.SunshineProfits.com | |||
| Top Silver Juniors | April 25th, 2013 | ||
|---|---|---|---|
| Rank | Symbol | Company | |
| 1 | SVL.V | STVZF | Silvercrest Mines Inc. |
| 2 | BCM.V | BCEKF | Bear Creek Mining Corp. |
| 3 | SPM.TO | SMNPF | Scorpio Mining Corp. |
| 4 | EXN.TO | EXLLF | Excellon Resources Inc. |
| 5 | AUU.V | AUSVF | Aura Silver Resources Inc. |
| 6 | MSV.TO | MISVF | Minco Silver Corp. |
| www.SunshineProfits.com | |||
Our top pick in February was Rio Alto Mining Ltd., and it’s still the first on the list today. It declined recently, but if you consider the fact that it’s still above its 2011 highs, the situation starts to appear very bullish indeed. We have removed Orko Silver from our ranking, as it was taken over by Coeur d’Alene earlier this month. The final price at which it was trading was $1.99 and it was $2.22 on Feb 8 – it almost did not decline at all even though metals and other miners declined heavily.
Orsu Metals Corp. is a company that is new to our gold ranking and is basically a company that stopped declining even though the rest of the sector plunged. This company is thinly traded so if you plan on buying this company, we suggest spreading the transaction over several days or more to minimize the impact on the market (you don’t want to push the price much higher as you buy).
Please keep in mind that at this time we are not advocating getting back on the long side of the mining stock sector. However, if we do make such suggestions, or you plan to buy before we write about it, you will know our picks.
Letters from Subscribers
Q: What is your take on the silver supply shortage? Is this a temporary event caused by surging demand resulting from the unexpected price drop catching dealers short? Do you view the premiums (which now exceed $5/spot for eagles and maples, even in large quantities) as temporary as well, and a response to being caught with short supply?
Demand for physical, both gold and silver, seems to be holding fairly steady over the past week. At some point, this should taper off and help prices to fall again. But major physical buying could come back in at $1300 or below and provide a floor at that point. How do we assess if that level is the real bottom or if that floor will give way at some point and allow the price to fall further?
Looks like you are right about further room to fall - commercial shorts are still about the same volume as last week. But I still wouldn't short this market. The physical demand is a factor not seen to this extent before. Plus, there are other anomalies: a box of maples is now $1000 more expensive than eagles? Something is going on there.
A: Our take on the physical side of the market and the current premiums for silver bullion products is the same as it was last week - we commented on premium on eBay in the April 19 Market Alert. We didn't comment on it from the dealers' point of view, though.
If dealers also view the drop as temporary and they had built their inventory previously then it's not surprising that they don't want to sell at a loss if instead they can just wait it out. Again, if prices stay low for some time the premiums will likely decline, as dealers either (1) run out of cash and are forced to liquidate their inventory, or (2) they see that they can either start selling or wait and perhaps sell at even lower prices. For now, both dealers and buyers seem to think that the drop in prices is only temporary, and they are taking this into account when making transactions - thus high premiums over spot.
How to assess if a given level is already a bottom or not? By using technical analysis, investment tools, self-similarity patterns, cycles and similar. Unfortunately the fundamental factors can't tell us how far prices can drop temporarily. We'll keep you informed.
Q: (...) That's the problem with technicals. They reflect history, and project it to the present. What the technicals don't reflect: nothing really changed over the past week, and the traders are beginning to realize that. The tide is turning.
Prediction: we won't see 1350 again, and the miners have seen their lows for this year.
A: Technicals reflect whether something has changed or not through support/resistance levels and breakdowns/breakouts. That's a better indication for the short run than fundamental analysis, which will tell you what's going to happen to a certain asset years from now.
2 weeks ago critical support levels were broken - nothing had really changed fundamentally, but thanks to technical analysis we were able to send you the get-out-of-the-market alert. Silver was above $26 at that time and in the hours following the alert it moved close to $26.50, effectively allowing to sell at that price.
Sure, markets discount information instantly, but they apply emotional filters to facts - and that's what technicals deal with. The tide may be turning or it may not be turning.
Summary
The gold market has declined significantly in recent days and the question now is, “has it declined enough for the bottom to have formed?” Gold corrected to its short-term resistance level, created by the first Fibonacci retracement, in most of this week’s gold charts and gold-related ratios and it may be ready to continue its decline – to more significant support levels – slightly below $1,300.
No spectacular slide has been seen in the silver to gold ratio yet and we would expect to see one if this was a major bottom. The implications are that the bottom was not yet reached.
The mining stocks’ performance on Wednesday appears somewhat promising, but we feel that the underperformance of silver is a more important signal at this time.
Trading – PR: Short gold, silver and mining stocks. Please note that stop-loss orders are relatively close, but were not reached yet. One can argue whether they were reached in case of gold in today’s early trading, but we think that a more meaningful move above $1,455 would be necessary to close the position (visibly to $1,456 or so).
Trading – SP Indicators: No positions: SP Indicators suggest long positions but the new self-similarity-based tool suggests short ones for a part of the precious metals sector (silver) and there are mixed signals for another part (gold and mining stocks) and we think that overall they cancel each other out.
Long-term investments: No positions.
| Portfolio's Part | Position | Stop-loss / Expiry Date |
|---|---|---|
| Trading: Mining stocks | Short (half) | 291 (HUI) / - |
| Trading: Gold | Short (half) | $1,455 / - |
| Trading: Silver | Short (half) | $24.20 / - |
| Long-term investments: Gold | No position | Buy half at $1,305 |
| Long-term investments: Silver | No position | Buy half at $18.20 |
| Long-term investments: Mining Stocks | No position | Buy half at XAU 84 |
This completes this week’s Premium Update. Our next Premium Update is scheduled for May 3, 2013. We will continue to provide you (as our Premium Service subscribers) with daily Market Alerts at least until the end of May, 2013.
Thank you.
Sincerely,
Przemyslaw Radomski, CFA

