
- Euro & USD Indices
- General Stock Market
- Crude Oil
- Correlation Matrix
- Gold
- Silver
- Mining Stocks
- Letters from Subscribers
- Will other countries have to sell gold?
- Australian Dollar will be exchanged directly with the Chinese yuan
- What is the new self-similar tool saying today?
- Swiss Franc and gold connection
- Conflicting tools and confidence
- Five periods in which silver shorts were as high as they are now
- Summary
What is the world's fastest gaining currency?
Hint--it's not the Swiss franc or the Australian dollar. It does not belong to any nation and is not issued by any central bank. It has a global circulation worth more than $1.4 billion on paper.
We’re talking about a decentralized electronic currency called bitcoin and it is interesting to notice that recently the price surged to stratospheric heights when Europeans realized during the Cyprus crisis that their euros might no longer be safe in the bank. Cyprus may have been the canary in the coal mine.
We had been hearing talk of bitcoin for about six months or so in Libertarian and geeky circles, but all of a sudden it’s a media darling. It’s on the cover of every newspaper and talked about on TV. Initially traded among computer hackers and cryptologists, the bitcoin has gained wider acceptance and can now be exchanged for goods and services. Only two years ago, one bitcoin was worth less than $1. A few days after Cypriot officials announced their original plan to plunder the savings accounts in the island nation’s banks, the price of the bitcoin rose from forty-five to sixty-five dollars. The price is over $75 at the time of publishing the Premium Update – after moving to $266 just a few days ago.
This shows the desperation of people looking for a safe haven, the kind traditionally provided by gold. Some are calling bitcoin “electronic gold.” History has shown us Tulip Mania. We may now be witnessing the first Cyber Mania, a rush to find the Philosopher’s Stone. Already, there are numerous knockoffs such as litecoin, namecoin, and freicoin.
So what is bitcoin and is it good as gold or good for nothing?
It is not something you can bite, or jangle in your pocket. It is a unit of money generated by computer algorithms and has no intrinsic value, like all other fiat currencies. Its worth is based solely on the willingness of holders and merchants to accept it in trade, and a growing number of merchants, such as Amazon, are accepting it. In that respect, it is as much a fiat currency as the dollar or the Euro, except that it has no government central bank backing, which means that there is no central bank that can manipulate its value by printing more units in tough economic times. Bitcoin’s appeal is that it is immune central bank machinations. This is a new type of a super fiat currency, a fiat of all fiats, if you will, that gets its value by the issuing crowd rather than the state. Can it become universal? Not until the majority of the 7 billion people that inhabit planet earth have a smart phone and frequent access to the internet.
Each bitcoin is essentially a piece of code generated through very slow computing processing known as “mining.”
The fact that a number of panicked Europeans turned to the volatile and vulnerable miniscule bitcoin market as an alternative to their own banking system, signals a serious breach in their trust in global banking and traditional fiat currency. But we have known this already for a long time which is one of the reasons for which we have been buying precious metals. As with gold, there is a limited supply of bitcoins which some see as built-in protection against inflation. Whereas gold has been a store of value for thousands of years and has at least some practical uses, bitcoins are brand new and exist only on the Internet.
Bitcoins are generated at a predetermined rate by an open-source computer program, which was set in motion in January of 2009 by a mysterious founder who used the pseudo name, Satoshi Nakamoto. Influenced by the 2008 financial crisis, “Nakamoto” combined existing peer-to-peer network technologies, cryptographic techniques, digital signatures, and the potential power of network effects to design and develop the Bitcoin System.
Today the system runs on a massive network of some twenty thousand independent nodes, very powerful computer systems optimized to compete for new bitcoins. The software is similar to the file-sharing software used to download music and movies, technology the entertainment industry has been trying unsuccessfully to quash for years. There's no bitcoin headquarters, main server or central bank one can visit, only a network of thousands of users. There is something called the Bitcoin Foundation. It is difficult, if not impossible, for authorities concerned about the use of bitcoins to buy drugs and launder money, to take action against it or to regulate it.
This is how the Bitcoin system works. It releases a twenty-five-coin reward every 10 minutes to the first node in the network that succeeds in solving a difficult mathematical problem. At first, almost anyone armed with an ordinary computer could download and run the bitcoin software and gather (“mine”) bitcoins. The more computing power dedicated to bitcoin mathematical calculations, the better the chances of arriving first at each solution. The system was designed to become a computational race that rewards ever increasing computing power. Four years into the Bitcoin project, only very powerful computers can do the job. Today bitcoin mining has become the domain of specialists.
Anyone can buy bitcoins. You choose a virtual wallet from one of the various providers which allows you to start buying bitcoins from other users and then to buy things, on eBay, for example. Bitcoins are accepted as payment by a growing number of merchants, both online and in the real world.
One can compare this to gold mining. Bitcoins, like gold, are mined in quantities that are small relative to the total supply, so that the supply grows slowly. There is an upper limit of twenty-one million coins built into the software and the last coin is projected to be mined in 2140. According to the latest data from Bitcoin charts, there are currently about 10,986,175 bitcoins in circulation—in other words the half-way point.
As of now, bitcoins are initially issued to the miners and get distributed when miners buy things or sell them to non-miners, for example, anxious Europeans eager to exchange their euros for something they deem safer. The ownership of every bitcoin in circulation is verified and registered with a timestamp on all twenty thousand network nodes to prevent double spending, since no coin can be exchanged without the authentication of some twenty thousand independent cyber-witnesses.
The anonymous nature of the currency has also led to brazen use by drug dealers and other shady characters who want to cloak their identities. Of course, cash is also anonymous and has been used in illegal activities.
Already there is evidence that the official financial sector will not stand idle in the face of a threat to its authority. Last month the American Financial Crimes Enforcement Network – a bureau of the US Treasury which aims to counter money laundering, issued new guidelines regulating "virtual currency" trading.
Is bitcoin looking like a bubble? It certainly looks that way. This is a brand new concept and the hype is causing people to buy it because prices are rising, which then causes prices to rise until the bubble will burst. Tulips were also new to Amsterdam at the time but a lot of people were left holding bulbs for which they sold their homes. Gold, on the other hand, has maintained its value through the centuries.
Bitcoin certainly failed to maintain its value this week after its main exchange was frozen after a serious DDOS attack – this alone caused the price to drop significantly. Actually, at Sunshine Profits we were discussing what could harm this market, since confiscation was generally not an option. The outcome was that “they” (who would want to destroy such a government-free currency? The answer is right in the question) would have to take out e-wallets or exchanges. We didn’t have to wait for a long time to see it.
Please keep in mind that it was not until recently – historically speaking – that we were able to use the Internet and just because it’s new, there are very few people that suggest that it’s only a temporary phenomenon, not something that’s here to stay. Perhaps bitcoin’s situation is similar? Even if it is, it seems to have gone up too far too fast and bound for correction. In fact, the decline seems to be now underway – with price below $100 after the $266 spike-high earlier this week.
The Cyprus events showed the world that cash in bank deposits is not safe. Bitcoin events showed that the electronic currency is not completely safe – at least not yet. What does that leave us with as safe-haven currencies? Precious metals.
Let’s turn to this week’s technical portion. We will start with the US Dollar Index chart (charts courtesy by http://stockcharts.com.)
USD and Euro Indices
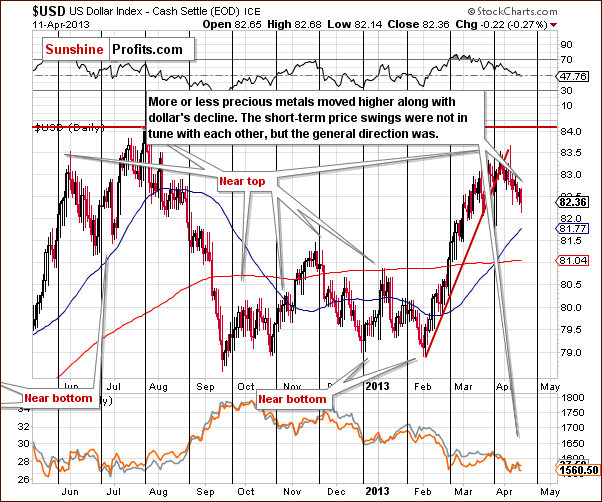
We begin this week with the short-term USD Index chart. We see that a local top formed close to the cyclical turning point in late March. While there was a single move to the upside in early April, the turning point basically worked, and the USD Index seems to be heading lower on a short-term basis. The situation is not close to oversold at this time, so declines are likely to continue.
Here we see that gold and silver did initially respond to the lower values for the dollar as their prices moved higher, but Wednesday’s decline in metals’ prices made the situation unclear again. It’s too early to state that lower USD Index values will now once again lead to higher precious metals prices.
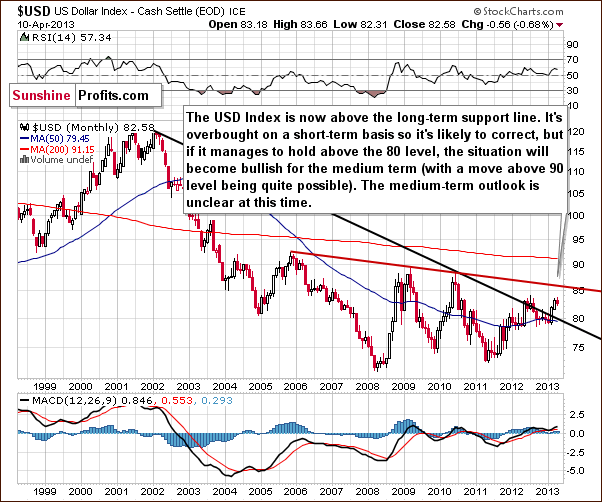
In the long-term USD Index chart, nothing has really changed since last week and comments made in our last Premium Updateremain current:
The breakout here is now quite significant, and we must consider the possibility that the USD Index might move higher in the medium term. The situation in the short term, however, is overbought, so it is likely that we will see the index decline soon and then we’ll see what happens next.
If the correction stops at the declining support line, around the 80 level, then the breakout will be confirmed, and a rally will likely follow. If however, the correction takes the index below the 80 level, the whole breakout will be invalided, and lower values would probably follow. At this time, the medium term and long-term outlooks are somewhat unclear based on this chart alone.
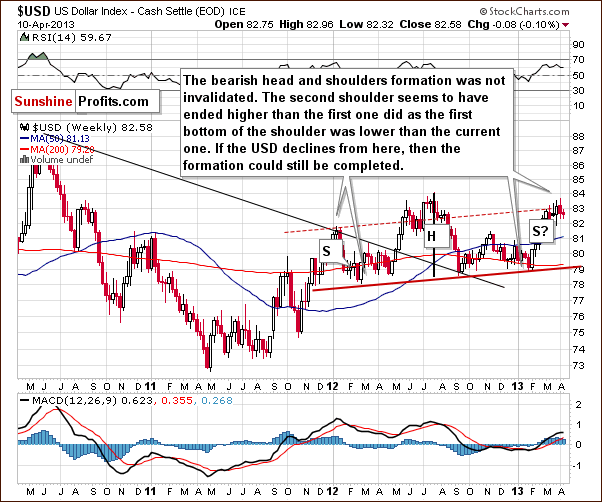
In the medium-term USD Index chart, the situation is unchanged in the past 7 days here so our comments in last week’s Premium Update are still up-to-date:
...the important thing to discuss here is the head-and-shoulders formation. This trading pattern has bearish implications for the USD Index and the question now is whether the formation is still present given the recent rally. We feel the answer is “yes”, because even though the index is now higher than the level of the left shoulder, the full formation is simply a bit skewed.
Local bottoms have been a bit higher each time so it is perhaps quite natural for the second shoulder to be above the first shoulder. Consequently, the formation could still be completed - though not yet - the other should has yet to form. Declines in the index are needed for this to happen, and we feel this could still be seen.
Please note that although there were intra-day attempts to move above the rising dotted line, the weekly closes were always at or below this line.
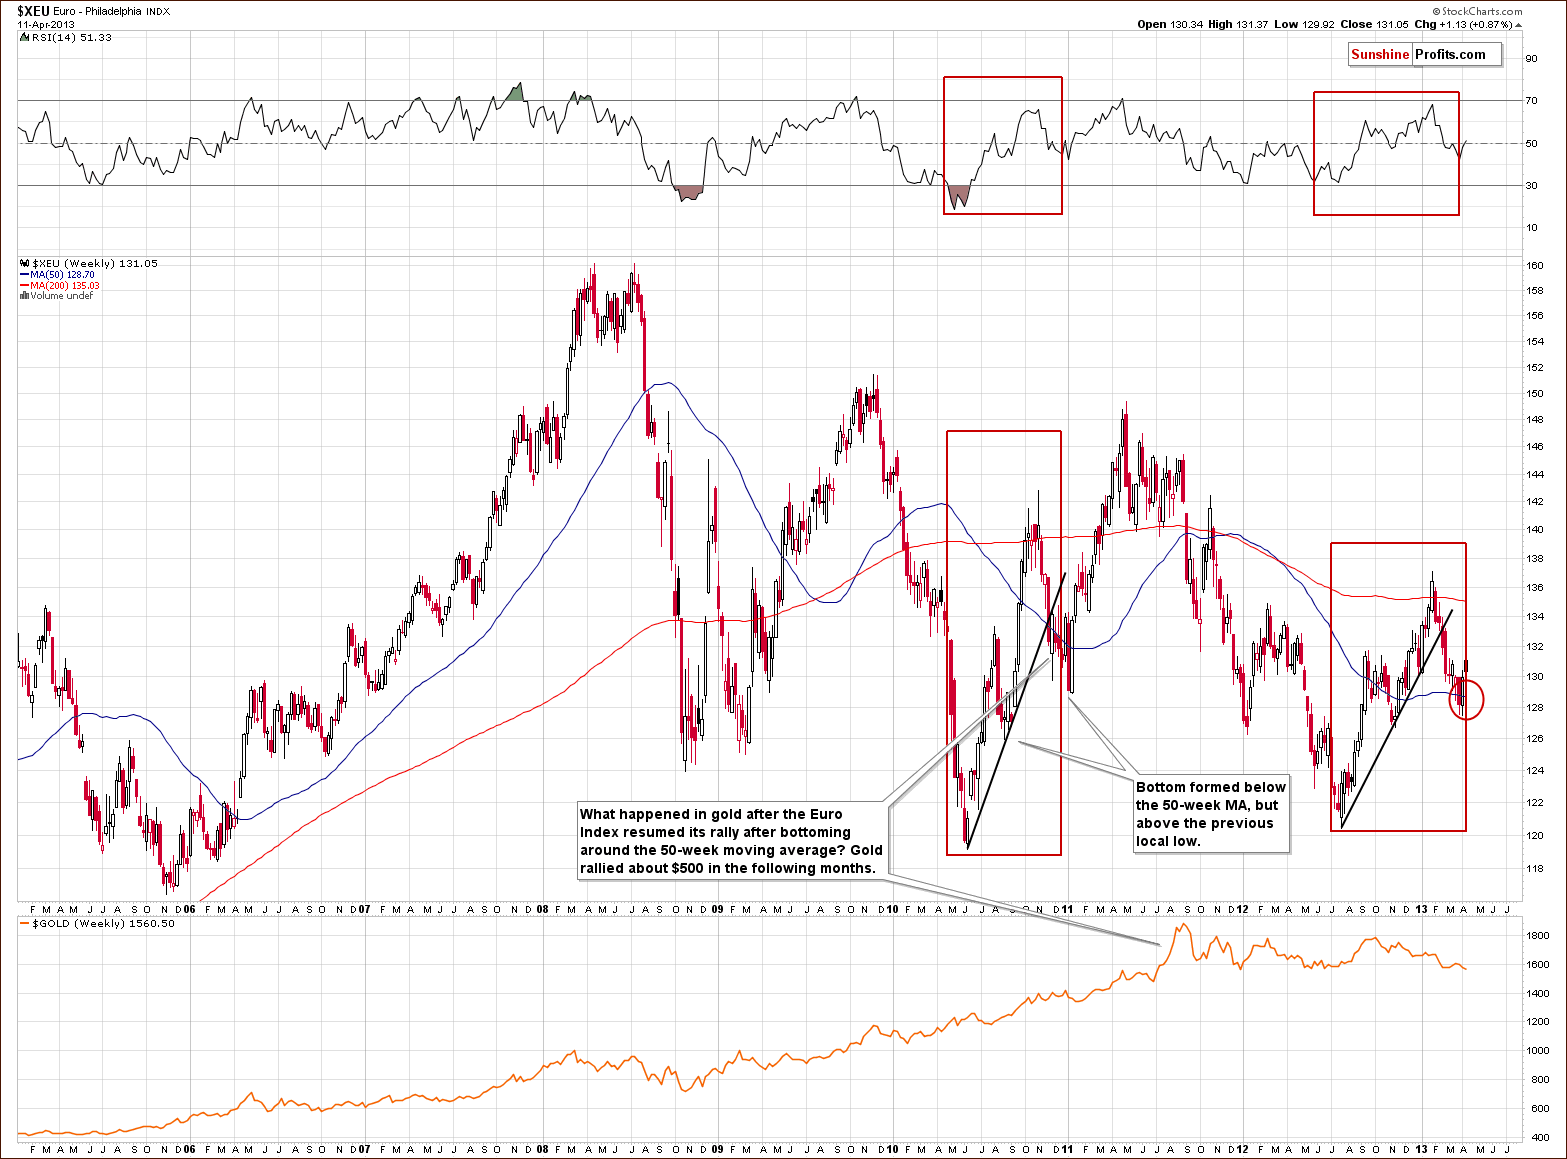
In the long-term Euro Index chart, we see that a bottom is likely formed in our target area. This is in tune with historical patterns, which are outlined in the chart (red rectangles). If the self-similarity continues, we can expect to see a strong rally in the European currency. This in turn would likely lead to powerful rallies in the gold and silver markets.
Summing up, the medium-term implications for the precious metals from the USD Index and the Euro Index are bullish at this time. The short-term situation remains unclear, however.
General Stock Market
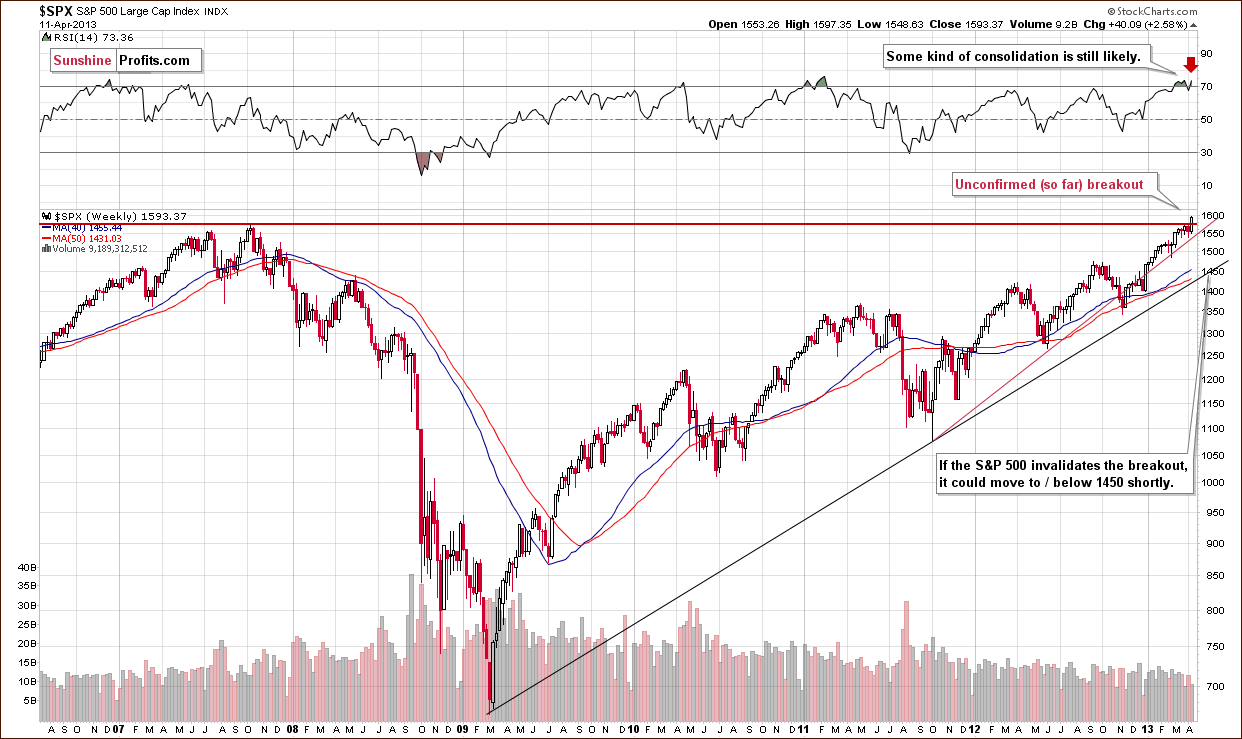
In the long-term S&P 500 Index chart, we finally have a breakout as we have seen two daily closes above the 2007 high. One more close above this level (today) will confirm the breakout for the S&P 500. If this does happen, it will increase the odds for the continuation of a medium-term rally in the general stock market.
RSI levels are overbought for the medium term so some short-term consolidation is possible here anyway - before the rally really picks up. Nonetheless, this week’s price action is bullish based on this chart alone. If the breakout is invalidated, we are likely to see quite visible declines, perhaps to the 1,450 level for the S&P 500. This level approximately coincides with the long-term support line on the above chart.
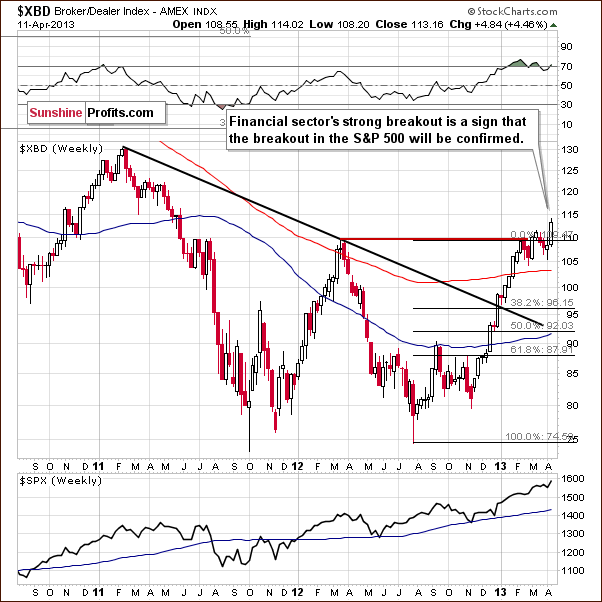
In this week’s Broker Dealer Index chart, we also see a breakout for the financial stocks. The move here in fact is even more significant than that of the S&P 500. This is a strong bullish signal, though not yet confirmed, and will become even stronger if confirmed by today’s closing price levels.
The breakout here materialized after the cup-and-handle pattern was seen. The consolidation preceding the breakout was not huge when compared to the cup, but the implications are clearly bullish anyway. Please keep in mind that the financial sector used to lead the general stock market lower and higher so the bullish sign here is also a bullish confirmation for other stocks.
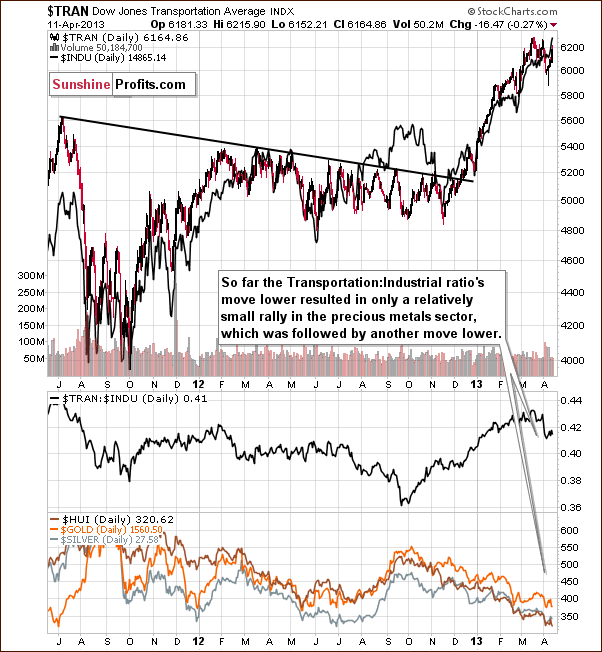
Turning now to the transportation-industrial stocks ratio, little has changed here since last week and our comments from last week’s Premium Update should be kept in mind:
Turning now to the transportation-industrial stocks ratio, we see an important development [last] week as the transportation stocks declined. This resulted in a significant decline in the ratio and the ratio has been inversely correlated with the precious metals for some time now. This relationship has been quite strong week-to-week, especially since last August. It seems that at this time, it could have positive implications on the precious metals market. So, in short a lot has happened, but not much has changed yet.
At this time it seems that what was supposed to happen based on the decline in the ratio – has already happened, and thus, further declines would be necessary to trigger further gains.
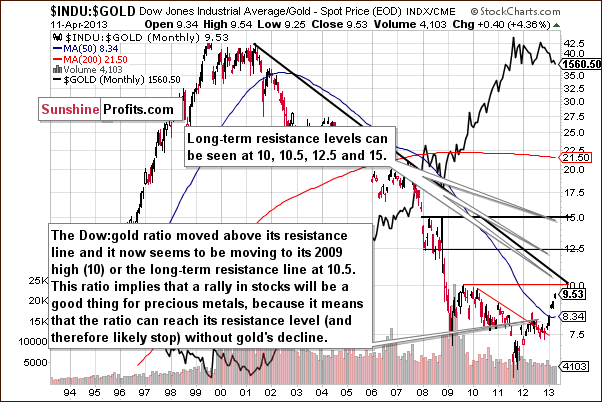
In the Dow to gold ratio, we see that the ratio provides bearish implications for gold or bullish implications for stocks or perhaps both. If the ratio moves higher, either gold’s price will decline or stock prices will rise. The ratio has been rallying recently and the medium-term trend remains up as a major resistance line has not yet been reached.
There is resistance at the 10.0 level here, which equals the 2009 high. A ratio of 10 means that the level of the Dow Industrials is equal to 10 times gold’s price. The question based on this chart now is will gold prices decline, will stocks move higher, or will we perhaps see both. If stocks confirm their breakout, then gold will not have to decline – or at least not much lower – for the ratio to move higher. This signal was visible for some time, however, other signals did not confirm it.
Summing up, the situation in the general stock market improved this week, and if the S&P 500 ends the week above their 2007 highs, their breakout will be confirmed. The breakout above the 2007 highs is visible in many indices at the same time including the industrials, transportation stocks, the S&P 500 and the financials. Based on the current medium-term trend in the Dow:gold ratio it seems that higher stock prices may not lead to much lower gold prices. Conversely, they could result in the ratio reaching a resistance level, something likely to mark the bottom in gold.
Crude Oil
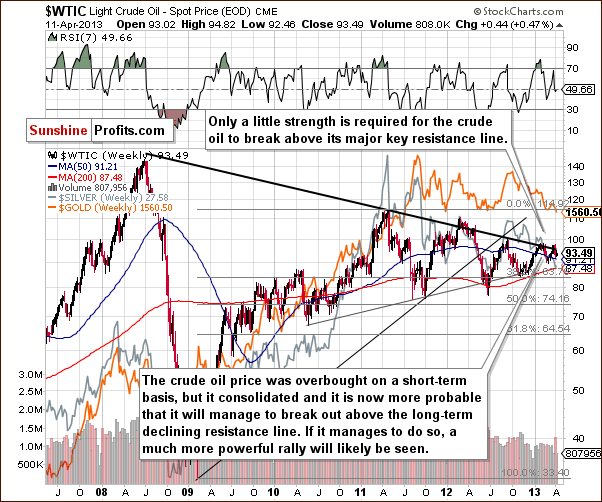
In the crude oil price chart this week, we see that oil’s price moved higher on Thursday but still did not surpass the declining long-term resistance line. Prices have been trading sideways for some time right below this resistance line, likely gathering strength for the eventual breakout.
The situation is somewhat similar to what was seen with the S&P 500 in recent weeks when stock prices traded sideways below the level of their 2007 high. Crude oil prices seem likely to break out quite soon as this will be their fourth attempt (two first top created the resistance line). They seem ready to succeed and create a significant rally thereafter. Crude oil prices have been consolidating for two full years now (since April of 2011). A breakout here could easily contribute to higher commodity prices in general as well as higher precious metals prices.
Gold and Silver Correlations
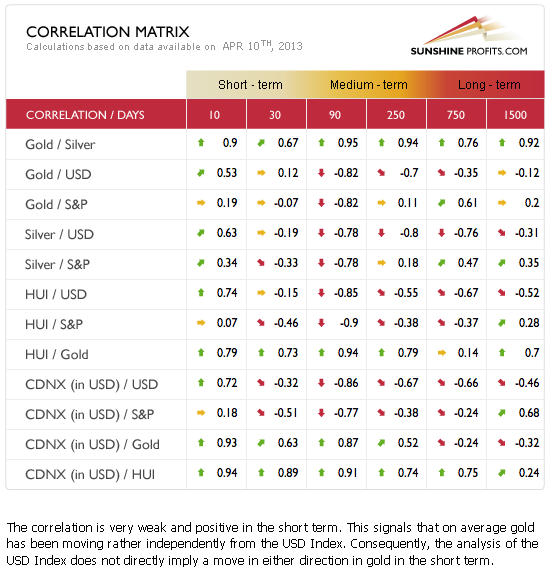
The Correlation Matrix is a tool which we have developed to analyze the impact of the currency markets and the general stock market upon the precious metals sector, (namely: gold and silver correlations). Precious metals have been trading independently from stocks and the currencies in the short term. They are negatively correlated in the medium term, however, so a short-term move to the upside for stocks may or may not result in lower gold prices. This relationship has not been in perfect tune over the past month.
In fact, it seems that the move higher in the Dow:gold ratio made the gold – precious metals correlation coefficients less effective. When the moves in the ratio become smaller, we will once again have more meaningful signals coming from the above table.
Gold
In general, much happened on a short-term basis this week, but not much changed on a medium-term basis and we are more or less where we were last week – a significant part of today’s gold section will be based on quotations. Naturally, we’re using quotations only if they indeed up-to-date.
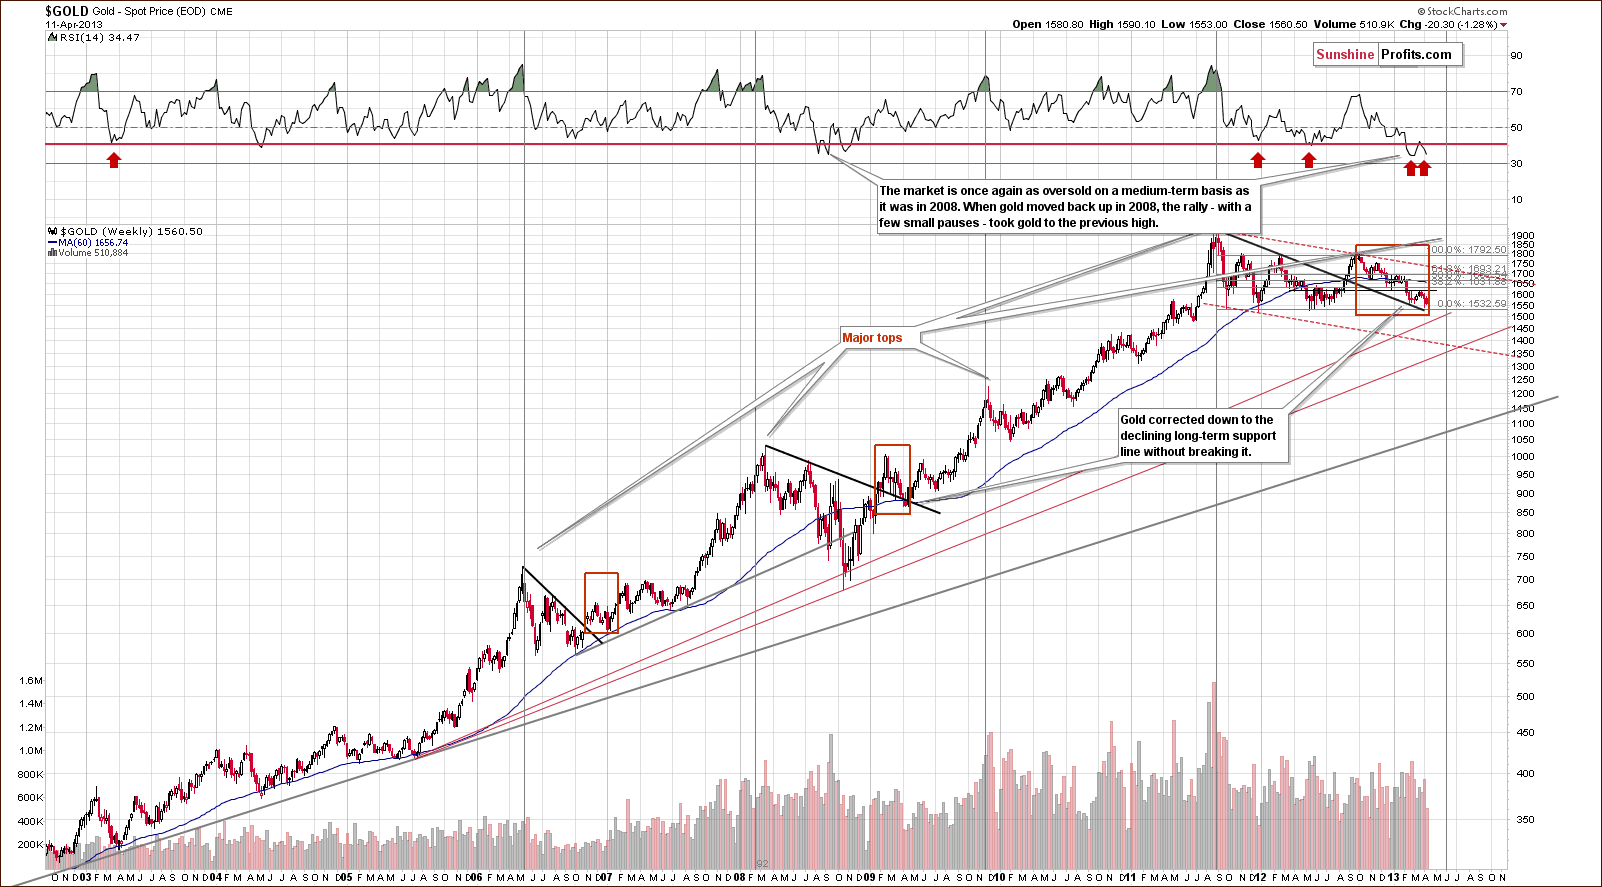
In this week’s very long-term gold chart, there was basically no change since last week. While we don’t see the big rally yet, gold has still not moved below its previous lows ($1,524) and comments made in last week’s Premium Update are still current (also given today’s pre-market move to $1,530):
Even though the situation is still bullish, as gold is above its long-term support lines, it seems that it could be the case that the next long-term turning point in gold may be a major bottom as opposed to a top. If gold prices break below the declining support line and the 2012 low, the next significant support is about $100 lower.
At the same time, although prepared and looking to the downside target level, it does not mean that the situation is bearish for the medium term. RSI levels are still oversold, so gold may not decline significantly.
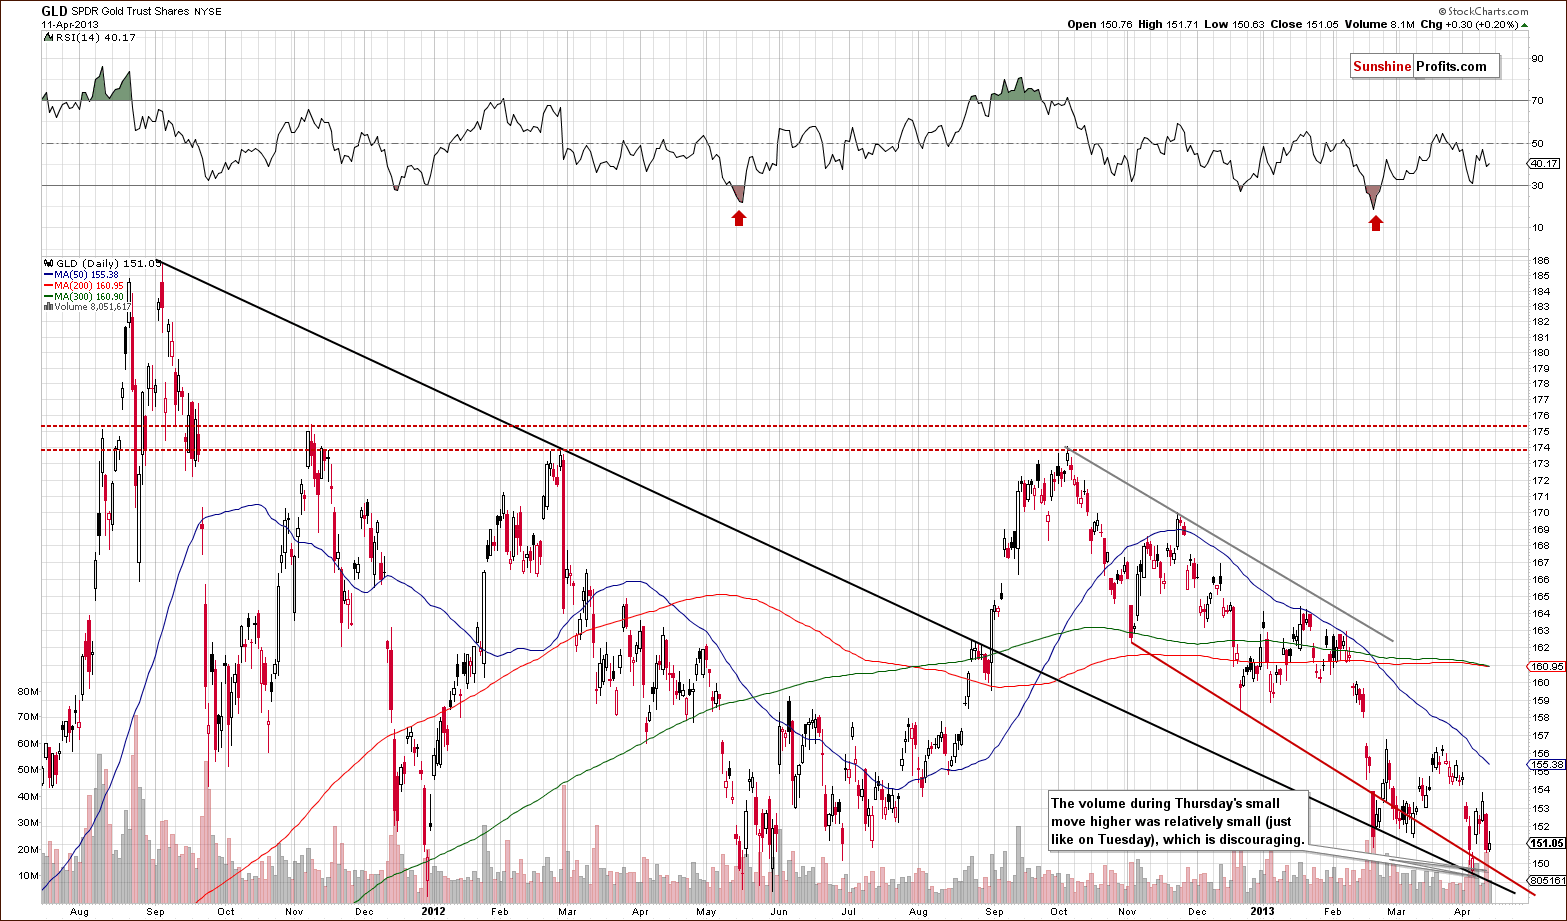
In the medium-term GLD ETF chart, we see a very concerning factor for the short term this week. On Thursday, a small move to the upside was seen on very low volume. We saw this on Tuesday as well and it was followed by a decline. It concerned us then and it concerns us now as well. This is a very short-term bearish factor but it has no medium-term implications.
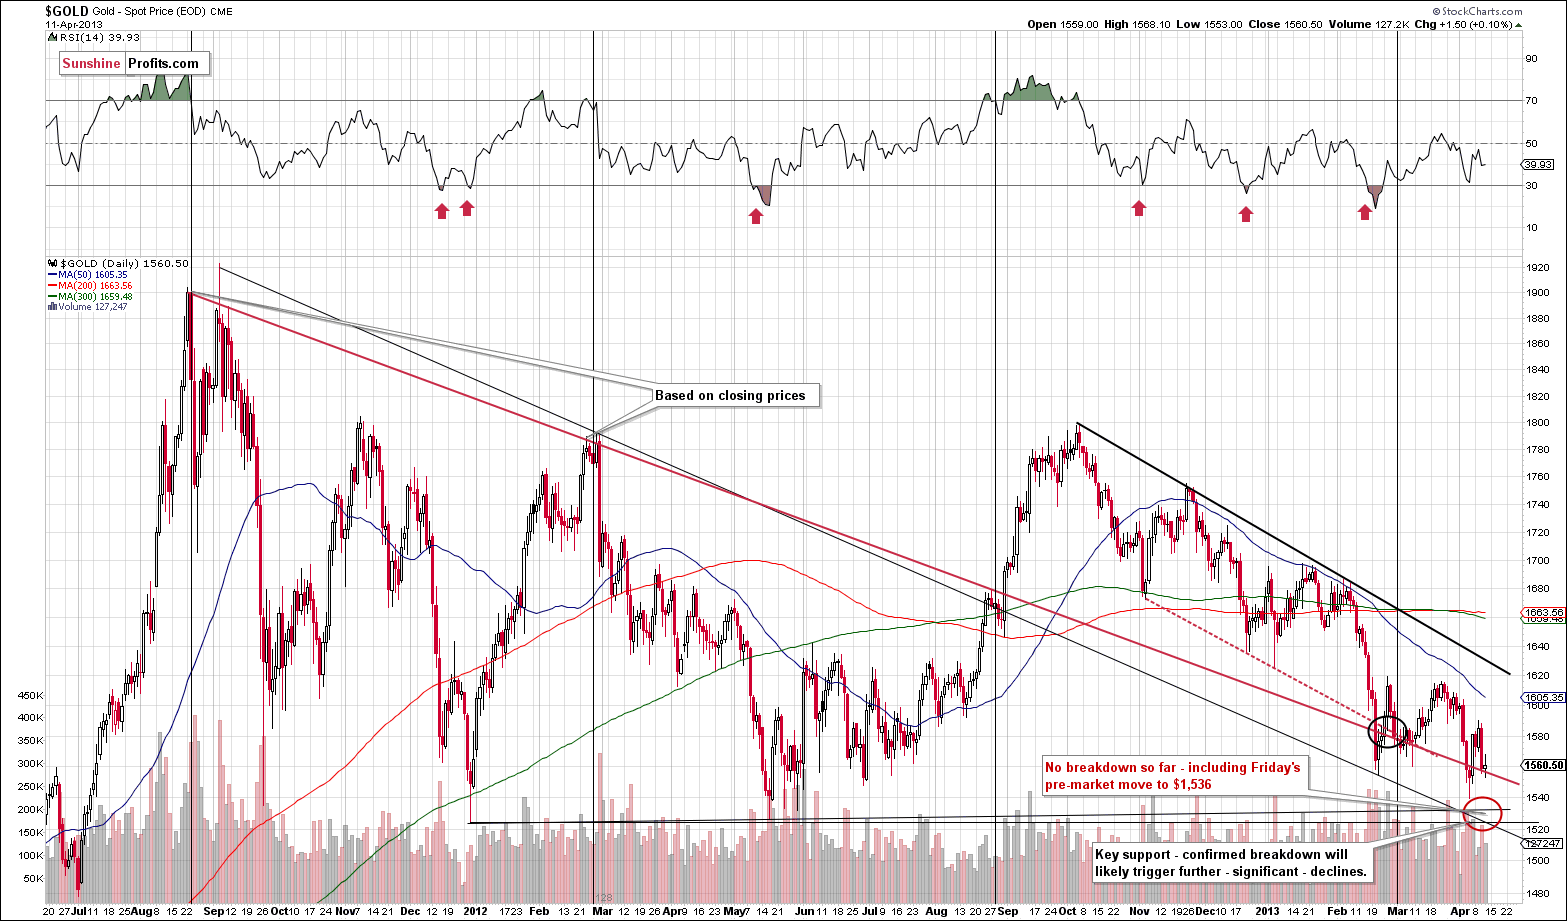
The above-mentioned concerning factor has already resulted in lower gold price today. Gold, however, didn't move below the area that we previously marked with the red ellipse - at the moment of writing these words gold is at $1,536, in the upper part of the ellipse, but definitely not below it.
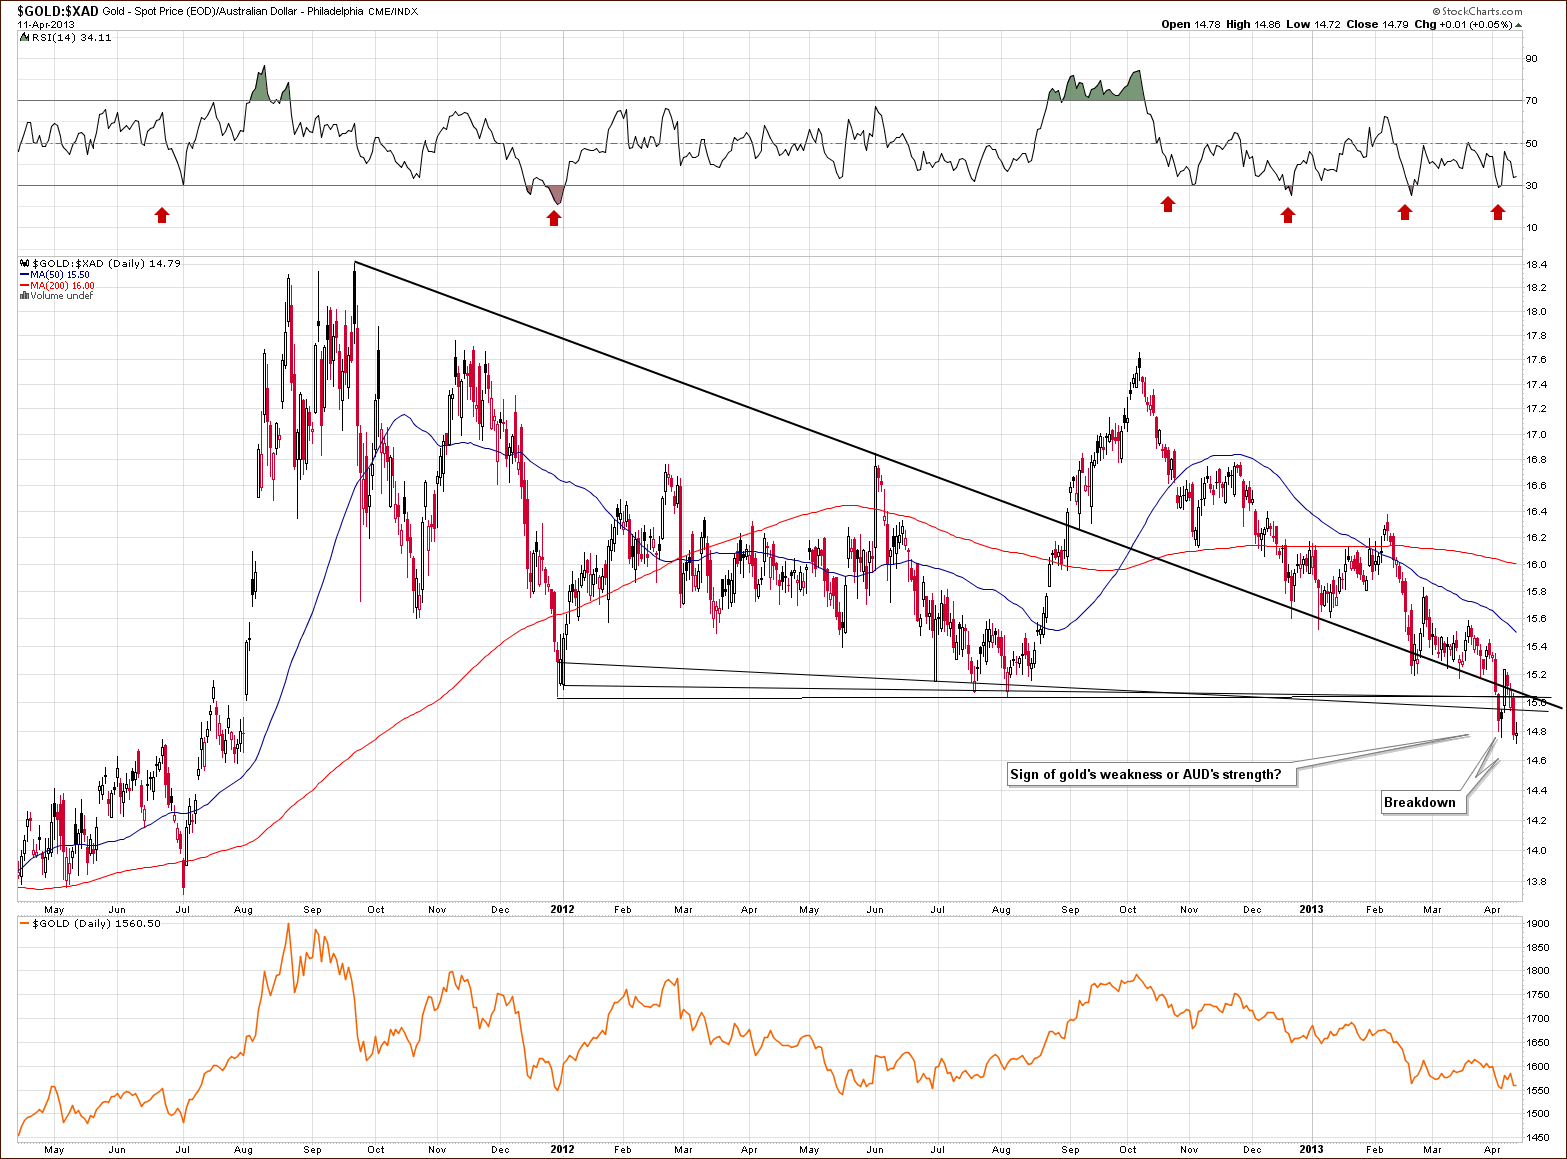
In this week’s chart of gold from the Australian dollar perspective, we see another breakdown below a key medium-term support line and this doesn't bear well for gold. However, the bearish implications are limited because possibly the bearish outlook here is due to the strength of the Australian dollar not to gold’s weakness. We will get back to this issue in today’s Letters section.
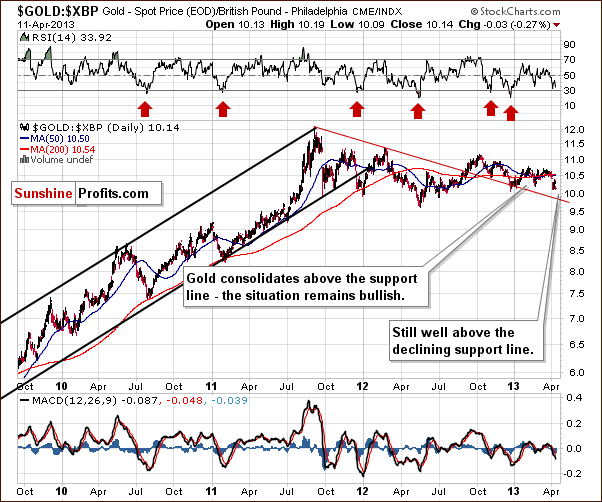
In this week’s chart of gold from the British pound perspective, nothing has changed and last week’s commentsare still up-to-date. We stated that “a strong support line is in place as well, and the situation is also bullish.” This continues to be the case today.
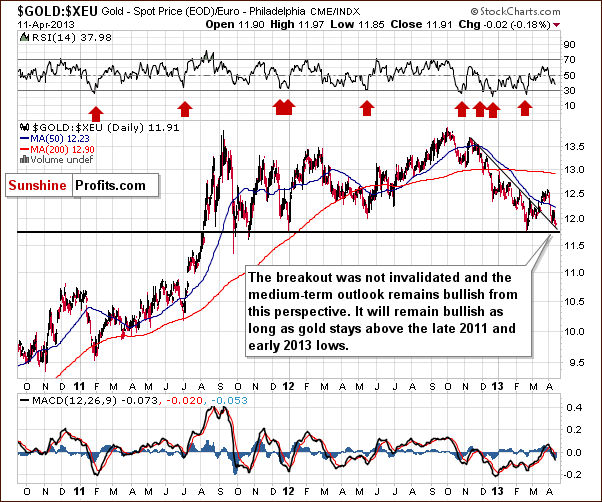
In this week’s chart of gold from the euro perspective, nothing has changed and last week’s comments are still up-to-date. We said that “we saw a sharp though unlikely decline [last] week. Prices did not go beyond support lines however so the situation remains bullish.” Support lines continued to hold declines in check this week.
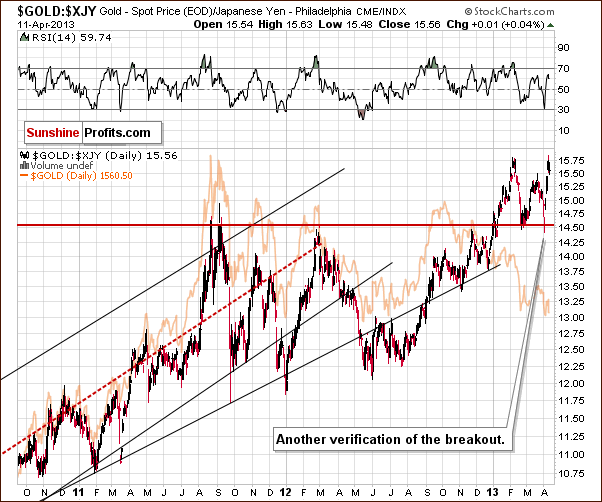
In this week’s chart of gold from the perspective of the Japanese yen, nothing has changed and last week’s comments are still current:
…we see there was a sharp decline [last] Wednesday followed by a quick pullback [last] Thursday when the Bank of Japan announced a huge round of quantitative easing. This is indeed a very significant move and a very positive long-term factor for gold. Gold reacted immediately and in terms of the yen remains quite bullish.
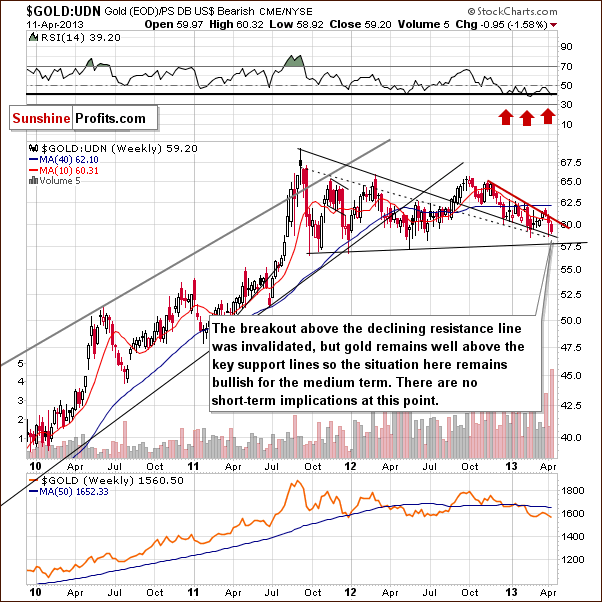
In this week’s chart of gold from the non-USD perspective, we saw another move lower, almost to last week’s lows. Last week’s comments are up-to-date:
…we see mixed short-term signals this week. The breakout above the declining resistance line has been invalidated, but the declining support line has held. Even if broken, another is just a bit lower. The situation is mixed for the short term but the medium-term outlook remains positive.
The RSI levels here are once again at levels corresponding to previous buy signals, and this is a sign that the final bottom is in.
Summing up, we have seen very significant back-and-forth movement this week and gold’s price is pretty much where it was a week ago. The short-term outlook for the GLD ETF is bearish, but we emphasize that long-term implications are more important. The long-term outlook suggests higher gold prices, as a key support level has still not been broken and the situation remains bullish. The Australian dollar is the exception, but gold’s price from this perspective has likely declined due to fundamental market changes regarding the Australian dollar.
Overall, the situation remains critical. It seems that we have a great buying opportunity, but as you will see in the mining stocks section later in this update, the latter sector suggests otherwise.
Silver
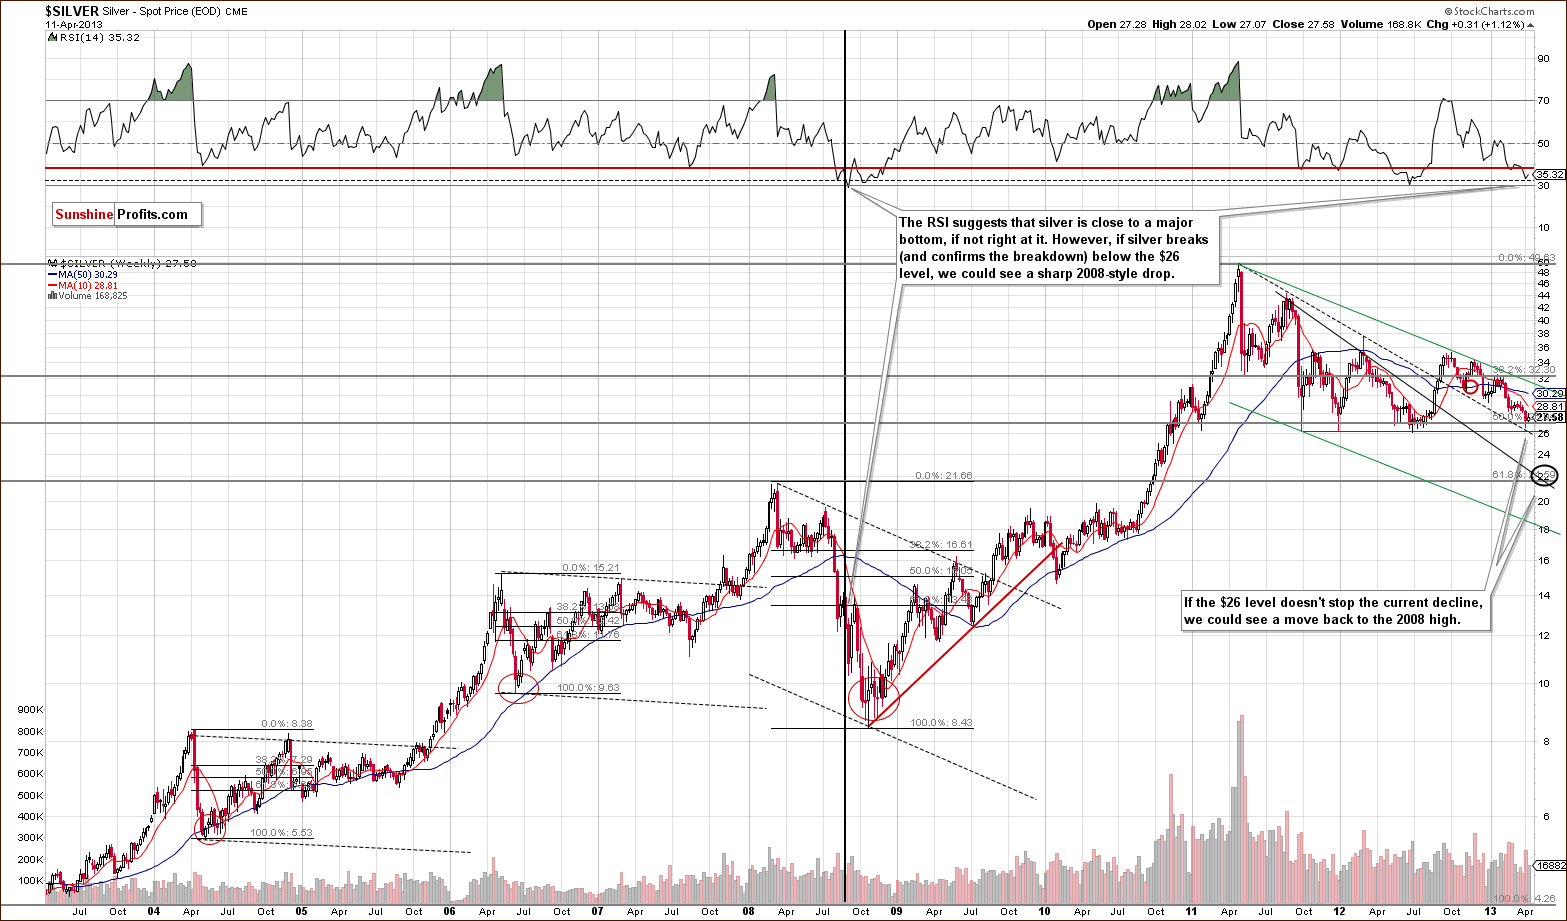
In this week’s very long-term silver chart, little has changed since last week and comments from our last Premium Update are still up-to-date:
The lows of the past two years are very close to silver’s current price level. We also have silver just above the declining support line based on previous major tops, much as is the case for gold as well.
On a long-term basis, silver is close to these price levels, but there are several support lines in place. The picture remains bullish here, but there will be concern if prices break down below the support lines.
More declines appear to be possible, and a downside target level around $22 seems appropriate. This is considerably lower, by about $5, almost 20% below silver’s current price. Such a decline is worth avoiding, of course, but,as with gold, there has been no breakdown seen here yet, so the situation remains bullish for the medium term.
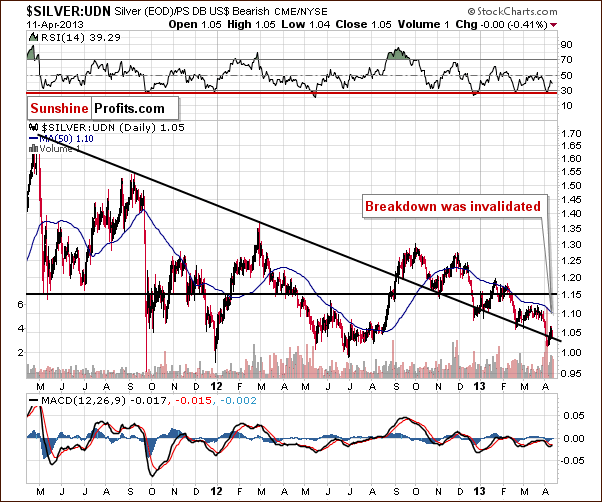
In the medium-term chart of silver from a non-USD perspective, we see that the breakdown has been invalidated as it was in late 2012 and in February 2013. This development is something that we expected. With the breakdown invalidated, we now have a buy signal and a bullish outlook for silver from the non-USD perspective. Several attempts (four in fact) have been seen for silver to rally after reaching this support line. The odds still favor a move to the upside since prices are above the long-term support line.
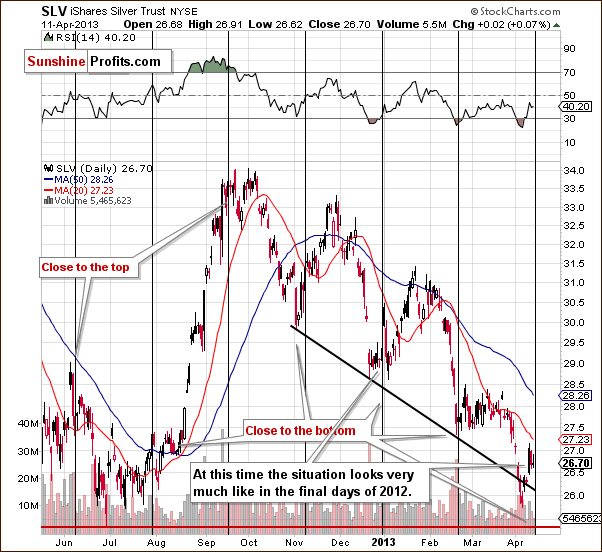
In the short-term SLV ETF chart, we see that silver is now at a cyclical turning point. Earlier this week, we said that we would prefer not to see silver rally ahead of this turning point because a move to the upside would have bearish implications for the weeks following the cyclical turning point. The long-term perspective for silver, gold and mining stocks could see trading patterns similar to the end of 2012, when prices pulled back sharply and then quickly rallied. The same type of volatility here could be followed by higher prices. The very-short-term trend is now up but at the same time we saw a bottom just a few days ago, so anything is possible, especially increased volatility. Our best guess here is a decline in silver prices initially with higher prices likely thereafter.
Summing up, the medium-term perspective is similar to last week. No major breakdown has been seen so the situation remains positive. A short-term decline is possible before another bottom is formed, but we expect silver to stay above the $26 level.
Gold and Silver Mining Stocks
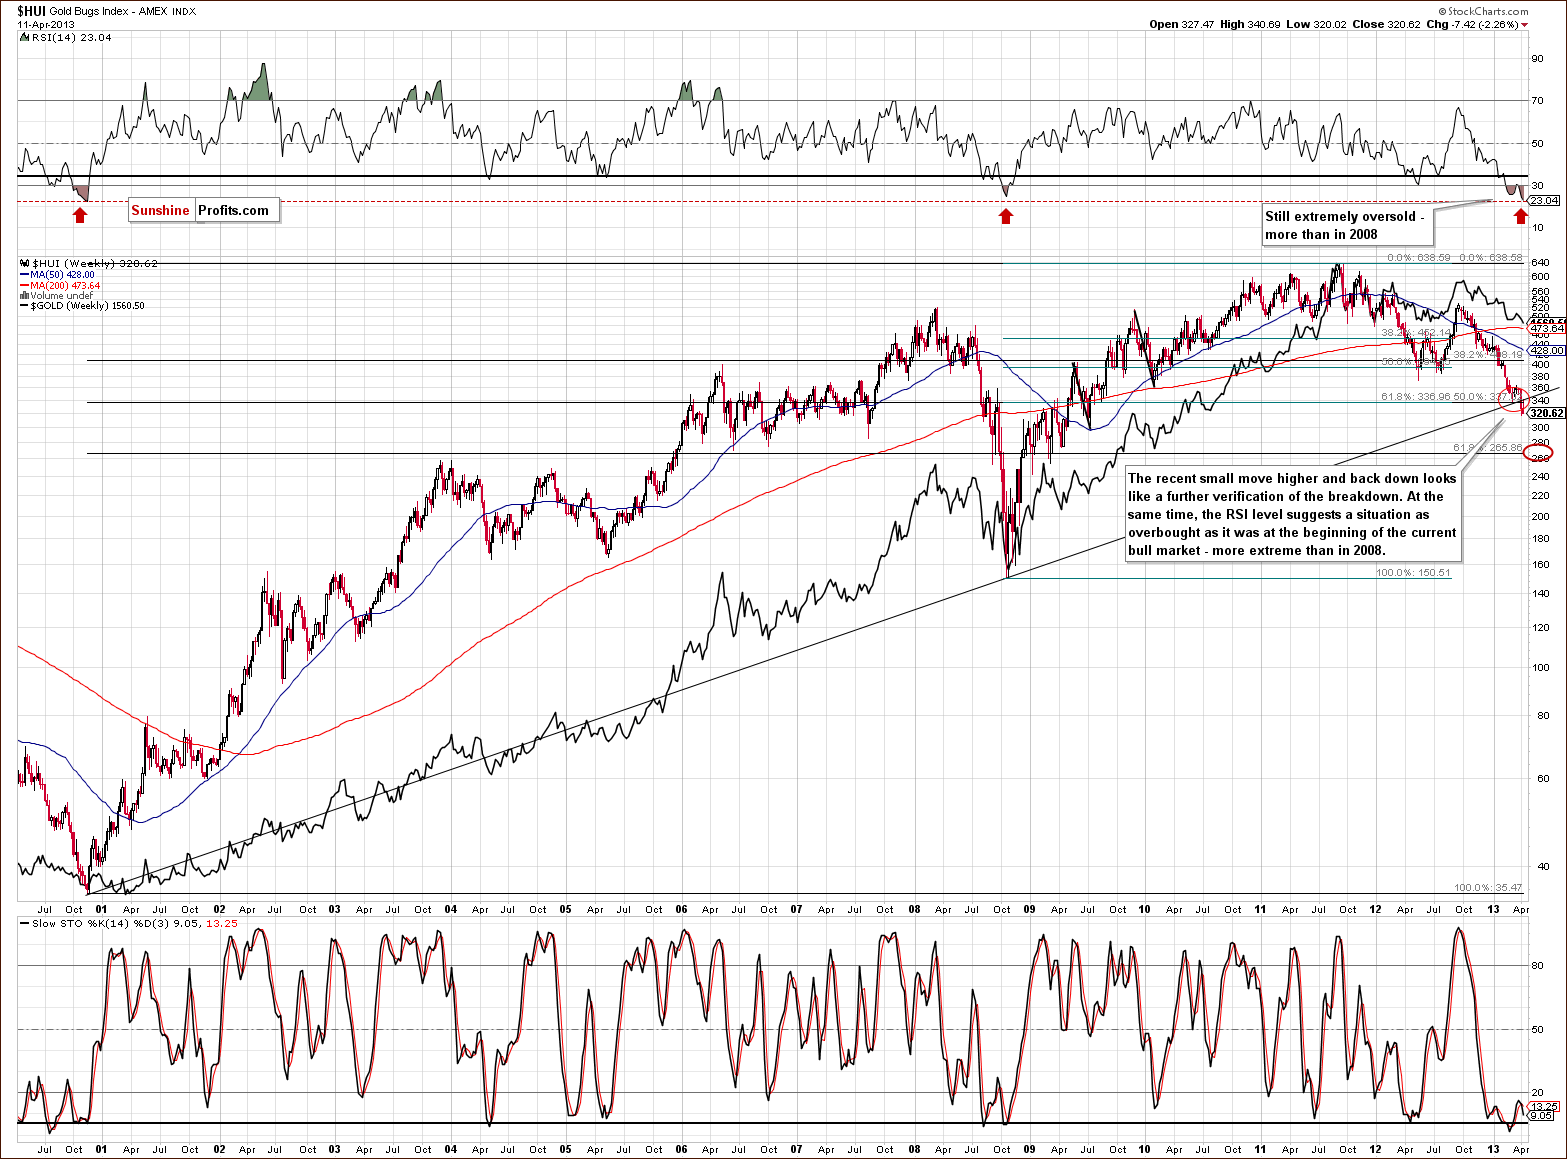
In this week’s very long-term HUI index chart, we see what looks like another verification of the breakdown this week. We saw a pullback to the previously-broken support line and prices declined once again. This clearly has bearish implications.
Based on RSI levels, however, the situation now is just as oversold as at the beginning of the bull market - in 2000. It is visibly more oversold than the 2008 bottom when the index values were less than half of what they are today.
Taking both of the above into consideration, the outlook here is still more bearish than not for the medium term.
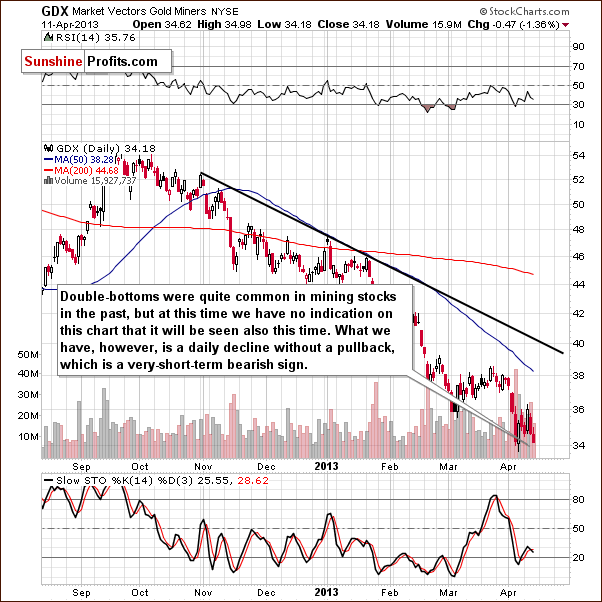
In this week’s short-term GDX ETF chart, we see no breakdown below the previous low, but we did have a market session where the miners declined without any pullback whatsoever. This is usually followed by additional declines.
Summing up, the overall situation for the mining stocks from a technical perspective is bearish at this time. They are as oversold as at the end of the previous bear market but have broken below a key support line and verified this breakdown. We also have small indications that declines will be seen in the short term as well. We are not suggesting getting out of the mining stocks completely at this point, but please note that our stop-loss levels for the long-term investments in this sector are very close.
Additionally, it’s unclear if the mining stocks have bottomed yet, so we have postponed our regular rankings of junior mining stock companies for at least one more week.
Letters from Subscribers
Q: Seems like gold will now head for 1350. Goldman and the Fed will see to that. Will other countries in Europe have to sell gold as Cyprus has?
A: Maybe they will if they want to be bailed out and perhaps that was a part of the agreement that we simply didn't hear about previously. Think about it, why do you frame it as a "sale" and not a "purchase"? It's simply how it was announced - if it was forced, then it's not really a sale. Take a look at the ending statement of this article. Last year the official sector bought the most in 48 years.
If you were buying something and wanted to buy even more, wouldn’t you prefer to see its price decline? This is what just happened. The announcement took gold lower. All the official purchases get less publicity than this one has. Reading between the lines, one could actually read this situation as "gold is still a very important asset and governments continue to buy it." Even the language they used in the statement supports it: "The Cypriot authorities have committed to sell the excess amount of gold reserves owned by the Republic." Excessive meaning unnecessary and needless? Then why are other countries trying to buy more and why was Cyprus forced to "sell" their gold? If it was excessive, why didn't they sell it earlier?
Q: In the daily Sunshine Profits update, you have mentioned gold and the Australian dollar together several times lately. I noticed that the Australian Dollar will be exchanged directly with the Chinese yuan (not using the US dollar) soon. Can you explain to us the significance of both: the AUD against gold, and the AUD to be exchanged for yuan directly?
A: The ability to exchange AUD for yuan directly will be bullish for AUD and bearish for USD, as the demand for the latter will decline due to its decreased role in the world economy. What it means for the precious metals market is that the breakdown below the support levels in gold or silver in terms of the Australian dollar may not reflect metals' weakness, but rather the strength of the Australian currency. We will put less weight on this phenomenon when examining the situation in the gold market from various perspectives.
Q: "Our best guess is that miners will invalidate their breakdown shortly and a powerful rally will start."
What is the new self-similar tool saying today, and why isn't it being referenced in each update?
A: We are currently letting you know when the tool changes its signal. In order to keep updates timely, we can't comment on each tool/ chart/ signal that we monitor so we are sticking to the most important ones on a given day. The self-similarity-based tool should be available shortly and then you will be able to monitor its signals each day. We have been working on multiple tools in recent months and, indeed, years. We will start releasing them shortly.
Q: I am long on silver and presently being squeezed heavily. The following link gives me further concern. What is your take on it?
A: There are 3 charts in this article. The last two feature gold that didn't (!) break below its rising support line and suggest that we are at a critical point for the entire precious metals sector - and we agree, there are other factors pointing to this. The situation remains bullish for the long run, though, in our view.
On the first chart we have an interesting observation. However the line that is drawn for the Swiss Franc is not based on local highs. Note the 1988-1989 high – it is well above the line. If the top was used to draw it, the current resistance levels would be much higher than they are right now.
Regardless of the above, please consider the dataset. The resistance line is based on the tops formed during the bear market in gold. The implications don't have to be the same in the bull market. In fact, we shouldn't expect them to be. Sure, a top in the Swiss Franc could result in multi-year consolidation in gold in a bear market, but in a bull market, with Quantitative Easing programs popping up, it could simply result in a smaller correction. And it has - we have seen gold consolidating for almost 2 years now. Gold moving higher right now is not a scenario that this picture invalidates, in our view.
Q: It appears the tools are in conflict, yes? Then you, who are most familiar with them, must make a call - in or out? I am reluctant to be out, but given the losses so far, out I am as of today. I would rather take additional losses buying back into a rising market than risk what could be a very substantial decline.
I think further decline is likely. Cyprus - little response. Korea - no response. S&P falls - PM stocks decline. The big issue is this: is the gold bull intact, and at what point is that called into question? Personally, right now, I would love to see 1350 - so long as I knew it would be followed, in the next 2 years, by an 1850.
I think this is where the focal point of your analysis should be. I am not that interested in making a little money here and there on a weekly basis. It is the larger trends that are more important to me; while it is that much harder to predict further out, we have at hand, perhaps, a major opportunity: further decline, and if so, to what extent.
Just how much confidence do you have in this new tool?
A: The tools and signals will be in conflict from time to time. However, if you think about it, "it's not a bug, it's a feature." Creating more tools - each of them based on different phenomena - will allow us to diversify our positions, decrease their average size, while retaining the profitability. This will decrease variability of returns and thus risk (in the classical sense). You can be happy with that or you can increase the leverage to move with the variability to the initial level (or stop mid-way) but at increased profitability. We will get further into this discussion when we have the tools ready for you.
At this point I personally have a considerable amount of confidence in the new tool. We will start featuring it when I have enough confidence to think that it can be used as a signal source on its own. Based on yesterday’s closing prices, we still have a buy signal for short- and medium-term in case of gold and silver.
At this time we have the precious metals market at a crossroads and signals suggest lower values for mining stocks and higher for precious metals. Both sectors are likely to move in the same direction, though, so one of them will likely follow the other.
We will continue to see the situation on the precious metals market as a bull market as long as fundamentals are in place. We thought that perhaps if bitcoin gains popularity, it could perhaps take some demand away from gold – but at this point and based on this week’s turmoil in bitcoin exchanges – it seems that it won’t happen anytime soon on a large scale. If gold moved to $1,300 but there will be no signs of stopping the quantitative easing programs and other fundamentals will remains in place, we would describe the situation as a major decline within – still – a bull market.
Q: In the last 20 years, there have only been five periods in which silver shorts (in silver futures, based on the Commitment of Traders data) were as high as they are currently. Four of those five periods were followed by considerable rallies in silver prices. The one period where prices flat-lined (fell modestly) was a slow and steady rise in shorts (as opposed to the spike-like move currently). Of course, with near-record amounts on the short side of the boat, it would seem clear where silver should go next but this time is different we will be told.
A: We agree, this is yet another factor pointing to the excessive oversold situation in silver and in the whole precious metals sector, which makes a coming rally (a major one) likely. Still, prices can get from very oversold to even more oversold. So if miners drag metals lower - below their key support levels - we will need to lower our exposure in the sector. This has not been the case, however, so we remain bullish for the medium- and long term.
Summary
The short and medium-term outlook for the USD Index is bearish. The outlook is bullish for the euro and for the general stock market with the outlook for stock becoming even more bullish if the S&P 500 confirms its move above the 2007 high with today’s closing price level.
The short-term implications for the precious metals are a bit unclear especially when it comes to implications for the general stock market. A sharp move higher in stock prices without a decline in gold would be bullish in that the Dow to gold ratio would move to a resistance level, which could mark the final bottom for the decline in gold.
Gold has not broken down below key support lines except for gold in Australian dollars. Fundamental changes recently, which have likely strengthened the Australian dollar, could be the cause of the bearish performance of gold from this perspective. In other words, it does not necessarily imply any weakness in the yellow metal.
The same is true for silver as the long and medium-term outlooks remain favorable. For the short term, both gold and silver appear vulnerable based on low trading volume in the GLD ETF and silver’s cyclical turning point. The technical situation in the mining stocks is very bad at this point based on long and short-term pictures. In the long-term perspective, we have a breakdown which has been confirmed and verified, and we see weakness in the short term as well.
Trading – PR: No position.
Trading – SP Indicators: Long position in gold, silver and mining stocks (please note that the expiration date for the signals were moved based on yesterday’s buy signal from the SP Gold Stock Extreme Indicator)
Long-term investments: Remain in the market with your precious metals holdings and stay with the market with half of your mining stock investments.
Please note that we made an adjustment in the stop-loss section in the table below – if HUI moves below 309 temporarily today, it means that we’re suggesting closing the remaining half of the long-term investment position. A close below 315 would have the same effect.
| Portfolio's Part | Position | Stop-loss / Expiry Date |
|---|---|---|
| Trading: Mining stocks | Long (half) | - / Apr 26, 2013 (half) |
| Trading: Gold | Long (half) | - / Apr 26, 2013 (half) |
| Trading: Silver | Long (half) | - / Apr 26 2013 (half) |
| Long-term investments: Gold | Long | $1,496 |
| Long-term investments: Silver | Long | $24.9 |
| Long-term investments: Mining Stocks | Long (half) | 315 (closing price) or 309 (intra-day) |
This completes this week’s Premium Update. Our next Premium Update is scheduled for April 25 (Thursday), 2013. This means that there will be no Premium Update next week and that the update in the following week will be posted a day ahead of the schedule. However, we will keep you updated on a daily basis anyway, through Market Alerts, and we will include replies to your questions in them (so that you don’t have to wait for the next update to get a reply) and charts, if necessary.
Thank you for using the Premium Service. Have a profitable week, a great weekend!
Sincerely,
Przemyslaw Radomski, CFA

