

Briefly: in our opinion, full (300% of the regular position size) speculative short positions in junior mining stocks are justified from the risk/reward point of view at the moment of publishing this Alert.
Welcome to this week's flagship Gold & Silver Trading Alert. Predicated on last week’s price moves, our most recently featured outlook remains the same as the price moves align with our expectations. On that account, there are parts of the previous analysis that didn’t change at all in the earlier days, which will be written in italics.
Let’s start today’s analysis with a recap of what recently happened on the fundamental front.
The Weekly Fundamental Roundup
With the Fed the focus of investors’ attention this week, the central bank raised interest rates by 50 basis points. However, while market participants initially put on brave faces, optimism turned to pessimism as reality re-emerged. To explain, I wrote on May 5:
With investors hitching their wagons to the Fed’s horse on May 4, they still believe that Chairman Jerome Powell can accomplish the impossible. Therefore, it’s all about following the man who will lead you to prosperity.
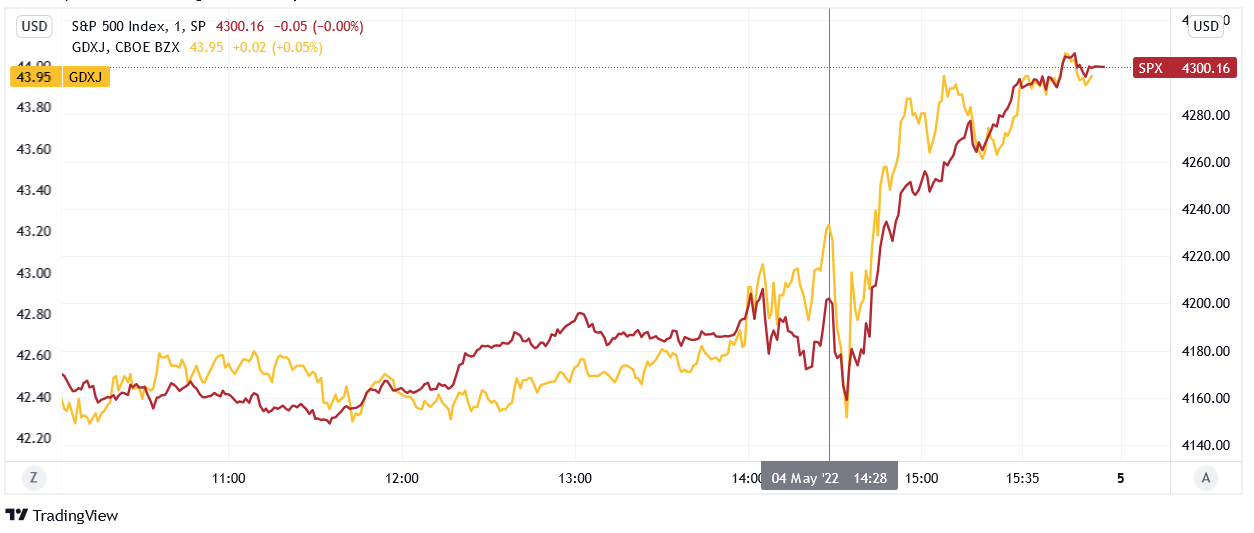
To explain, the red line above tracks the one-minute movement of the S&P 500, while the gold line above tracks the one-minute movement of the GDXJ ETF. If you analyze the relationship, you can see that both sunk at the outset of Powell’s presser and then rallied into the close. As a result, a little bullish sentiment combined with some short-covering were the perfect ingredients for a sharp daily rally.
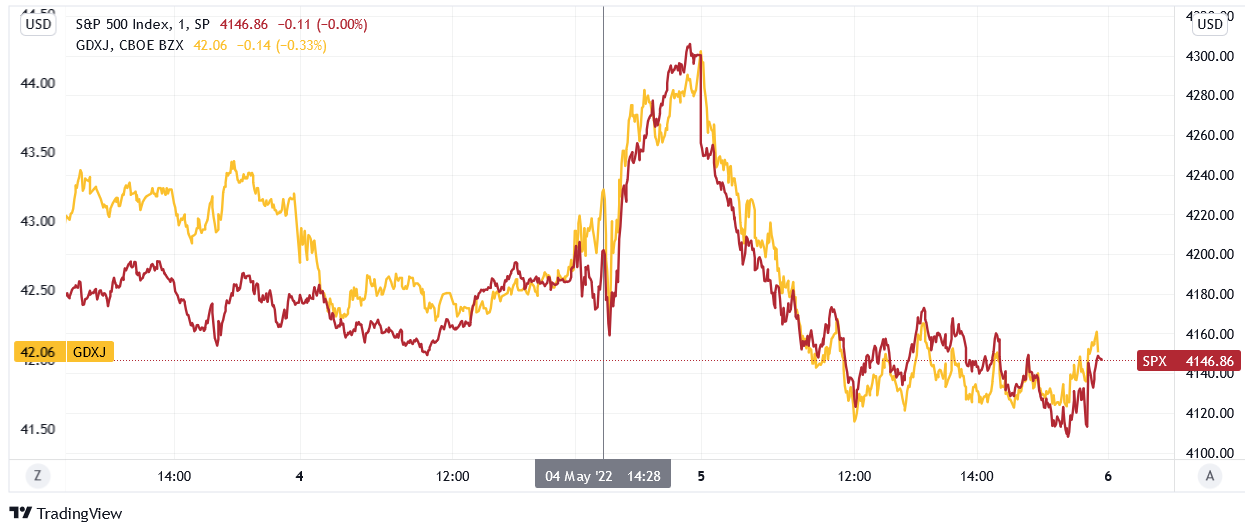
However, not only did the pair’s medium-term fundamentals not follow suit, they actually worsened. Therefore, while sentiment rules the day in the short term, their medium-term outlooks couldn’t be more treacherous.
Well, with investors’ panic attack turning the medium-term into one day, the S&P 500 and the GDXJ ETF gave back all of their misguided gains and then some.
Please see below:
However, the medium-term outlook remains unchanged and what I wrote on Apr. 27 still stands: while investors will likely remain in ‘buy the dip’ mode until the very end, lower highs and lower lows should confront the S&P 500 and the PMs over the next few months.
Remember, investors are always looking for the bottom. They speculate, hoping that every morsel of bullish news will turn the tide. On May 4, that optimism was underwritten by the relief that the Fed didn’t hike rates by 75 basis points.
However, it’s not about how much the Fed hikes at a given meeting; it’s about how long the rate hike cycle lasts and whether or not the Fed turns dovish. Therefore, with officials stuck between a rock (growth) and a hard place (inflation), bad news should continue to hammer the financial markets for the foreseeable future.
To explain, when analyzing Chairman Jerome Powell’s prediction of a soft landing, I wrote that this statement should go down as one of the most important quotes of 2022:
“I do expect that this will be very challenging; it’s not going to be easy; and it may well depend on events that are not in our control. But our job is to use our tools to try to achieve that outcome, and that’s what we’re going to do.”
As such, with Powell noting that a soft landing "may well depend on events that are not in our control," he's essentially telling you that the Fed is past the point of managing this outbreak. In reality, inflation is like cancer. Once it spreads, it reaches a point where too much damage has been done to save the patient.
Thus, this is where we are now. With the Fed's "blunt tools" poised to inflict serious damage on the U.S. economy, the undesirable trade-off of supporting growth versus curbing inflation has the Fed in a material bind. As a result, investors severely underestimate the challenges that will confront them over the next several months.
Therefore, what should Powell do? On the one hand, he could hammer home rate hikes, kill demand, eviscerate inflation, and push the U.S. economy into recession. On the other hand, he could stop hiking, support growth and let inflation rage.
However, investors don’t realize that both roads lead to the same destination. If Powell is serious about fighting inflation, the end result is pretty clear. If he performs a dovish 180, the S&P 500 and the PMs could bask in the short-term glory. Yet, the medium-term implications are even more bearish (for the stock market) if the second scenario unfolds.
Letting inflation rage will cripple long-term economic growth and push the U.S. economy into an even deeper recession (with a lag) than if Powell hikes the federal funds rate to 3.5%. As a result, investors don’t understand that what they cheered for on May 4 (the hope of a dovish Fed) will actually lead to the worst possible long-term outcome. Thus, whether it’s one day, one week, or one month of bullish optimism, the ghost of stimulus past should haunt investors for much of 2022.
To that point, there is a third scenario; and with the bulls desperately searching for a medium-term catalyst, the new narrative from CNBC’s oracle looks like this:
 Source: CNBC
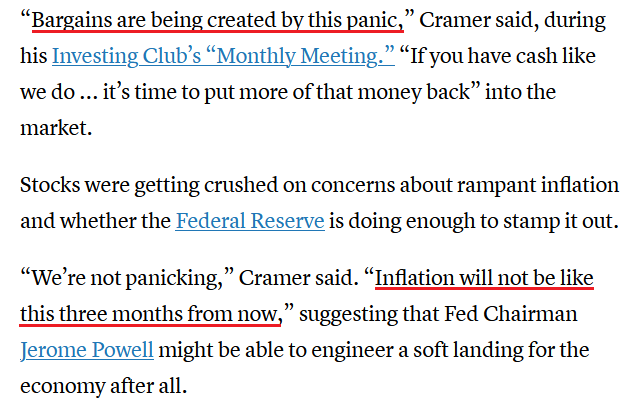
He said:
 Source: CNBC
Therefore, when inflation is too high to expect a dovish pivot and the Fed’s “blunt tools” are too harsh to avoid collateral damage, the only bullish narrative left is to predict that inflation will subside on its own. However, while I’ve been warning since 2021 that the concept is laughable, desperate times call for desperate measures. Furthermore, even if inflation peaks on a year-over-year (YoY) basis, it’s still increasing month-over-month (MoM). As such, “the fool wonders; the wise man asks.”
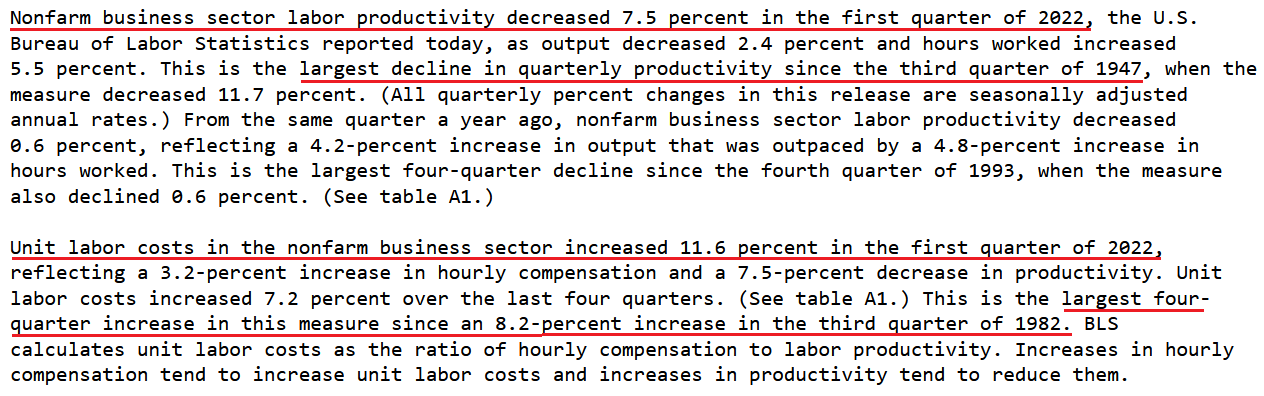
So, let’s dig a little deeper than Cramer. On May 5, the U.S. Bureau of Labor Statistics (BLS) released its nonfarm business sector labor productivity report. An excerpt read:
 Source: BLS
Now, this is lagged data, so the future implications are less relevant than PMIs or business surveys. However, the results are still profound. For example, labor productivity measures output produced per hour. When productivity increases, employees produce more goods in the same amount of time, or the same amount of goods in less time. In a nutshell: they are more ‘productive.’
However, the important point is that productivity offsets wage inflation. When productivity increases, the number of goods one person creates increases, and even if that individual receives a wage increase, the labor cost per unit can remain constant or decline. As such, the company doesn’t need to pass the wage increase on to the consumer.
With productivity declining by 7.5% in Q1, U.S. employees are producing fewer goods in the same amount of time, or the same amount of goods in more time. As a result, unit labor costs have increased materially, which is extremely inflationary.
Second, the CNBC article stated: “Cramer said rising mortgage rates should cool the housing market,” and therefore, help reduce inflation. Now, I agree with the long-term implications of his thinking.
However, his uninformed analysis assumes that housing prices are reflected in the Consumer Price Index (CPI). In reality, shelter (rent inflation+) accounts for more than 30% of the headline CPI’s movement. Therefore, higher mortgage rates won’t impact rent inflation until several months down the road.
Case in point: Apartment List released its National Rent Report on Apr. 27. An excerpt read:
“Rent growth is continuing to pick up steam again, after a brief winter cooldown, with our national index up by 0.9 percent over the course of April. So far this year, rents are growing more slowly than they did in 2021, but faster than the growth we observed in the years immediately preceding the pandemic.”
Please see below:
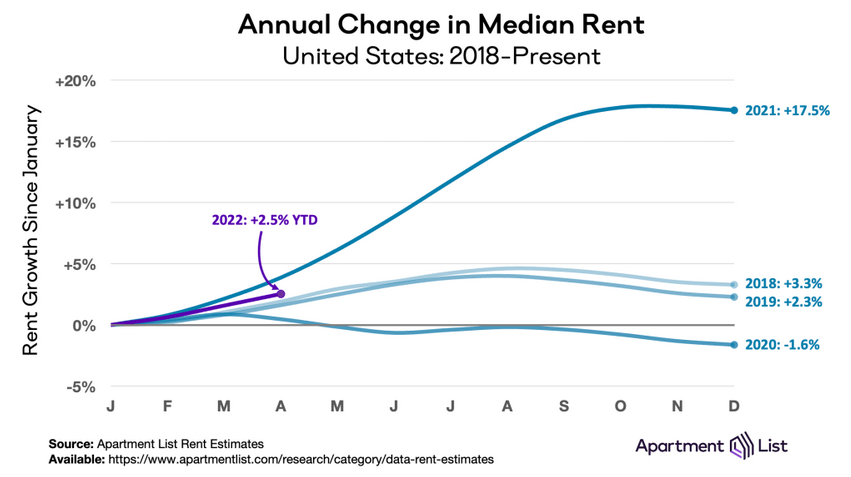
Furthermore, please consider that with median rents up by 2.5% YoY in four months, that annualizes to nearly 7.7% YoY for 2022. Likewise, a continuation of the current trend would result in 2022 YoY median rent inflation that’s 2.3x 2018 and 3.3x 2019’s figures. In addition, the spring and summer months are when peak pricing occurs. As a result, the data is extremely bullish for Fed policy.
The report added:
“In December 2021, rents fell in 61 of the nation’s 100 largest cities, the only month last year in which more than half of these cities saw a decline. This month, however, rents were up in 93 of the nation’s 100 largest cities (…).”
“As we enter the spring and summer months, rental activity is likely to pick up, and rent growth is likely to accelerate. Despite a recent cool-down, many American renters are likely to remain burdened throughout 2022 by historically high housing costs.”
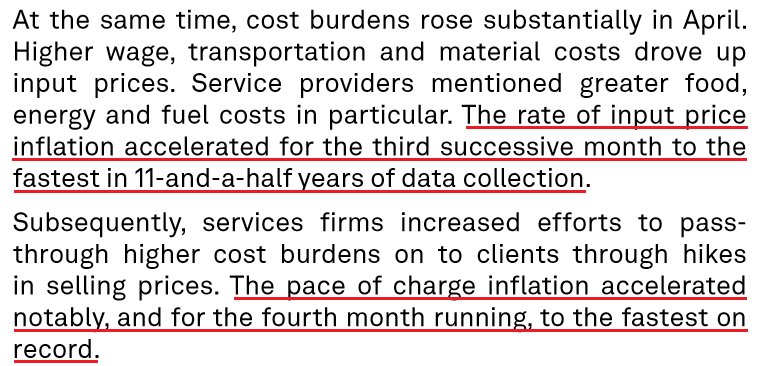
Finally, S&P Global released its U.S. Services PMI on May 4. The report revealed:
“U.S. service providers recorded a steep expansion in business activity during April, according to the latest PMI™ data. The rate of output growth eased to the slowest for three months but was sharp overall…. Demand conditions remained strong and sparked the fastest rise in employment for a year as backlogs mounted at a near-record pace.”
More importantly, though:
 Source: S&P Global
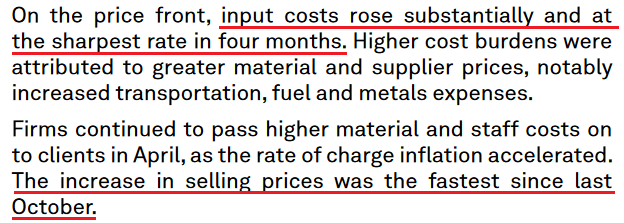
Moreover, the data mirrors the results from S&P Global’s U.S. Manufacturing PMI released on May 2:
 Source: S&P Global
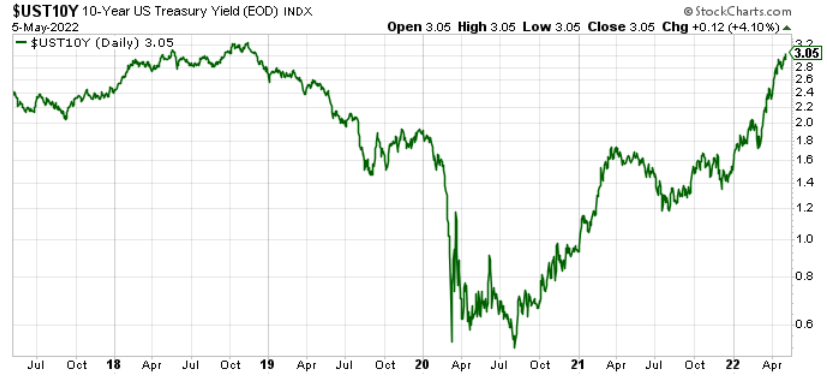
Also noteworthy, I wrote on May 4 that the U.S. 10-Year Treasury yield has continued its ascent, [and] while the Treasury benchmark eclipsed 3% intraday on May 3, a close above the key psychological level should occur sooner rather than later.
Well, sooner has arrived:
The bottom line? While it's surprising how CNBC personalities will say things without doing their homework, the Fed's reality check still has room to run. Moreover, I warned on Mar. 28 that investors' confidence would eventually cower. I wrote:
The PMs and the general stock market remain in la-la land. Despite repeated warnings from Fed officials and a rout in the bond market, both asset classes continue to ignore the potential ramifications. However, with the medium term likely to elicit a profound shift in sentiment, the Fed’s war on inflation should send shockwaves across the financial markets.
As a result, while investors slowly realize the implications of the Fed’s catch-22, plenty of downside is needed before the medium-term effects are accurately priced in.
In conclusion, the PMs were mixed on May 5, as mining stocks suffered the brunt of the damage. However, with the Fed on a hawkish warpath and the medium-term outlooks bullish for the USD Index and real yields, the PMs should confront more selling pressure before long-term buying opportunities emerge. Please note that a short-term buying opportunity may present itself if certain technical developments materialize in the coming days.
What to Watch for Next Week
With more U.S. economic data releases next week, the most important are as follows:
- May 9: The Conference Board Employment Trends Index (ETI)
With employment making up one-half of the Fed’s dual mandate, continued strength in the U.S. labor market could add more fuel to the hawkish fire.
- May 10: NFIB Small Business Optimism Index
With small businesses having a material impact on U.S. employment and inflation, it will be interesting to see if employers continue to increase staff and raise prices.
- May 11: Consumer Price Index (CPI)
Although it’s lagged data, outperformance and underperformance often move markets. As a result, the CPI will likely be the most watched data point next week.
- May 12: Producer Price Index (PPI)
With the PPI often leading the CPI, the former is an important component of the inflation story.
- May 13: University of Michigan Consumer Sentiment Index
With consumers dealing with rising mortgage rates and unrelenting inflation, it will be interesting to see how sentiment is holding up.
All in all, economic data releases impact the PMs because they impact monetary policy. Moreover, if we continue to see higher employment and inflation, the Fed should keep its foot on the hawkish accelerator. If that occurs, the outcome is profoundly bearish for the PMs.
Let’s start today’s technical discussion with a quick check on copper prices.
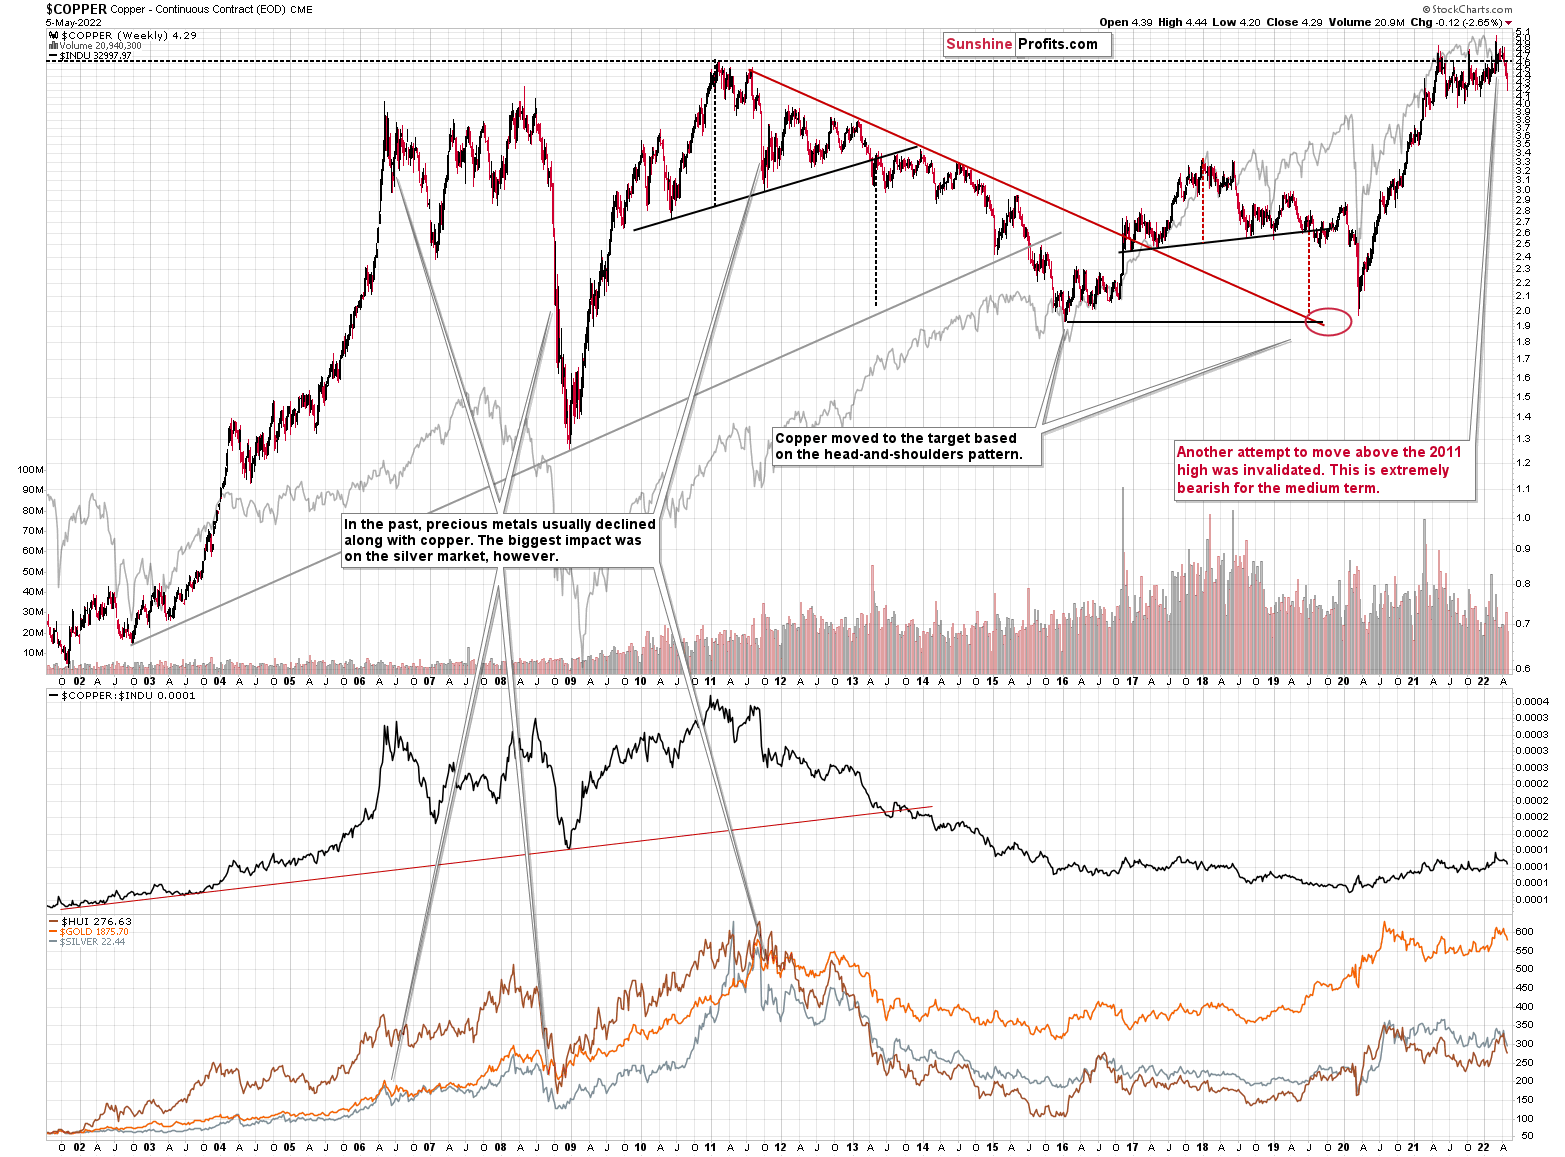
Copper just CLEARLY invalidated another attempt to move above its 2011 high. This is a very strong technical sign that copper (one of the most popular commodities) is heading lower in the medium term.
The interest rates are going up, just like they did before the 2008 slide. What did copper do before the 2008 slide? It failed to break above the previous (2006) high, and it was the failure of the second attempt to break higher that triggered the powerful decline. What happened then? Gold declined, but silver and mining stocks truly plunged. The GDXJ was not trading at the time, so we’ll have to use a different proxy to see what this part of the mining stock sector did.
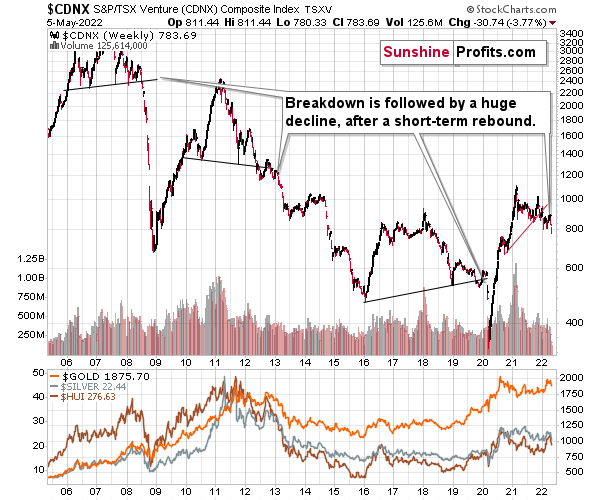
The Toronto Stock Exchange Venture Index includes multiple junior mining stocks. It also includes other companies, but juniors are a large part of it, and they truly plunged in 2008.
In fact, they plunged in a major way after breaking below their medium-term support lines and after an initial corrective upswing. Guess what – this index is after a major medium-term breakdown and a short-term corrective upswing. It’s likely ready to fall – and to fall hard.
So, what’s likely to happen? We’re about to see a huge slide, even if we don’t see it within the next few days.
What has happened recently?
In yesterday’s analysis, I commented on the short-term situation in the precious metals market (gold and GDXJ) in the following way:
The precious metals sector moved higher yesterday, just as I had indicated on the grounds of the triangle-vertex-based technique. The “direct” trigger was provided by the Fed during the press conference. Powell cooled down some of the most hawkish expectations by stating that 0.75% rate hikes are not on the table.
Well, the reality is that the Fed’s comments are not that useful when estimating what’s going to happen. Remember when we heard so many times that inflation was under control and transitory? Exactly.
Still, regardless of whether 0.75% rate hikes will follow or not, the reality is that we saw a rally, and the key question is whether this rally is:
- the beginning of something much bigger,
- nothing special that will be followed by another wave lower soon,
- just a very brief pause within a decline to the previous target level (slightly above $37 in the GDXJ), and this target is going to be reached within the next few days.
Which one is most likely?
In my view, the first point is rather unlikely. The medium-term trend is down, just as the trends in the USD Index, and real interest rates are up.
You know what’s better than knowing the reply to a question about the future? (After all, it’s not possible to have a 100% certain answer to anything regarding the future.)
A strategy! A strategy is a plan for how to act in various future scenarios so that one knows what to do under all circumstances.
If scenario number 3 is going to happen and the target level is reached shortly (today or tomorrow), then the original expectation for PMs to start a counter-trend rally is likely to be realized. In this case, it makes sense to simply keep the current exit orders intact.
If scenario number 2 is going to happen and we’re about to see a bigger decline soon (perhaps to the previous 2022 lows in the GDXJ), then it would be better to move our exit prices much lower – perhaps to the 2022 lows, or even lower.
Here’s where it gets interesting. While it’s not clear at the moment which of the above scenarios will prevail, it will naturally clarify on its own as time passes.
If we get a sharp decline today or tomorrow, it will mean that scenario 3 is being realized, and therefore, we’ll get out of the short positions when the downside targets are reached, and we’ll enter long positions. However, if we don’t get a sharp decline today or tomorrow, it will likely mean that scenario 2 is being implemented and it will make sense to adjust our exit prices.
It's also possible that we will get a decline, but an indecisive one. In this case, I’ll elaborate further in the following analyses, as my preferred action will likely depend on what happens in other markets.
Well, so far, we’ve seen a decline, but not one that’s decisive enough to clarify the situation. Consequently, at this moment, it appears that the scenario from the above paragraph is still being realized (gold is flat in today’s overnight trading at the moment of writing these words – and so are silver, S&P 500 futures, and the USD Index). In other words, the jury is out with regard to the next big move.
If the short-term situation is still unclear, let’s focus on what’s clearer – the medium-term picture.
Let’s keep in mind that between 2020 and now, quite a lot happened, quite a lot of money was printed, and we saw a war breaking out in Europe. Yet, gold failed to rally to new highs.
In fact, it’s trading very close to its 2011 high, which tells you something about the strength of this market. It’s almost absent.
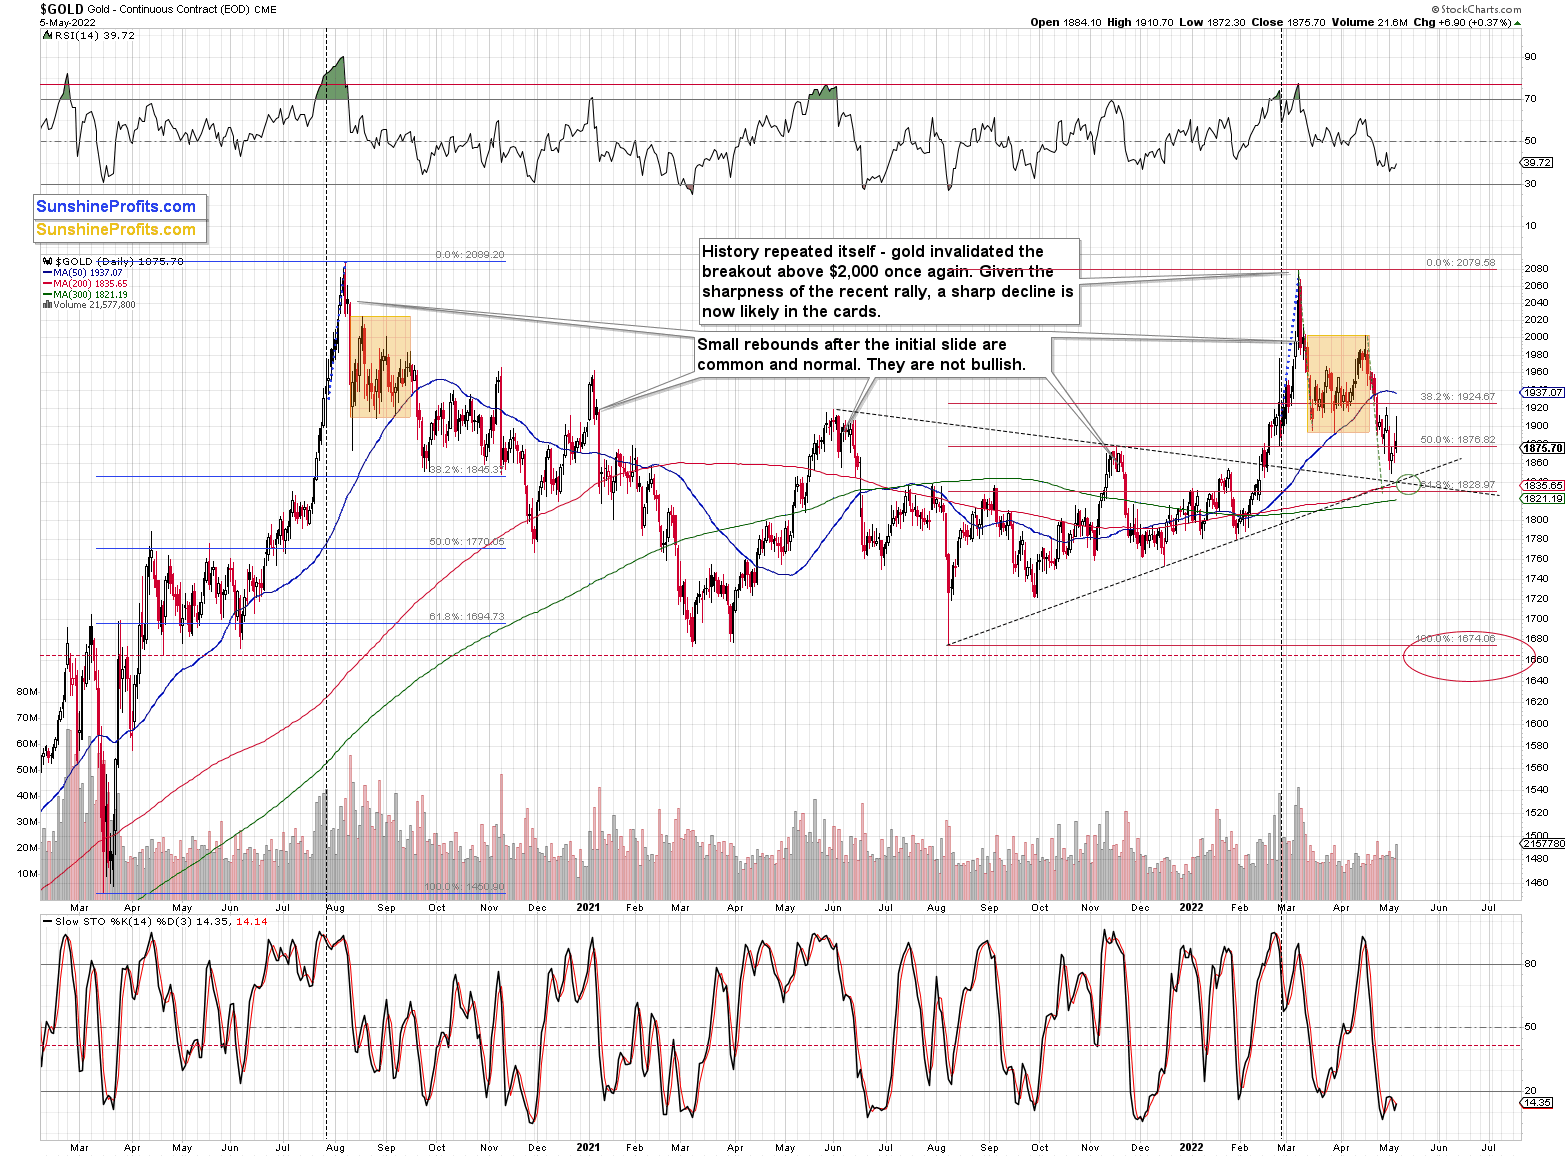
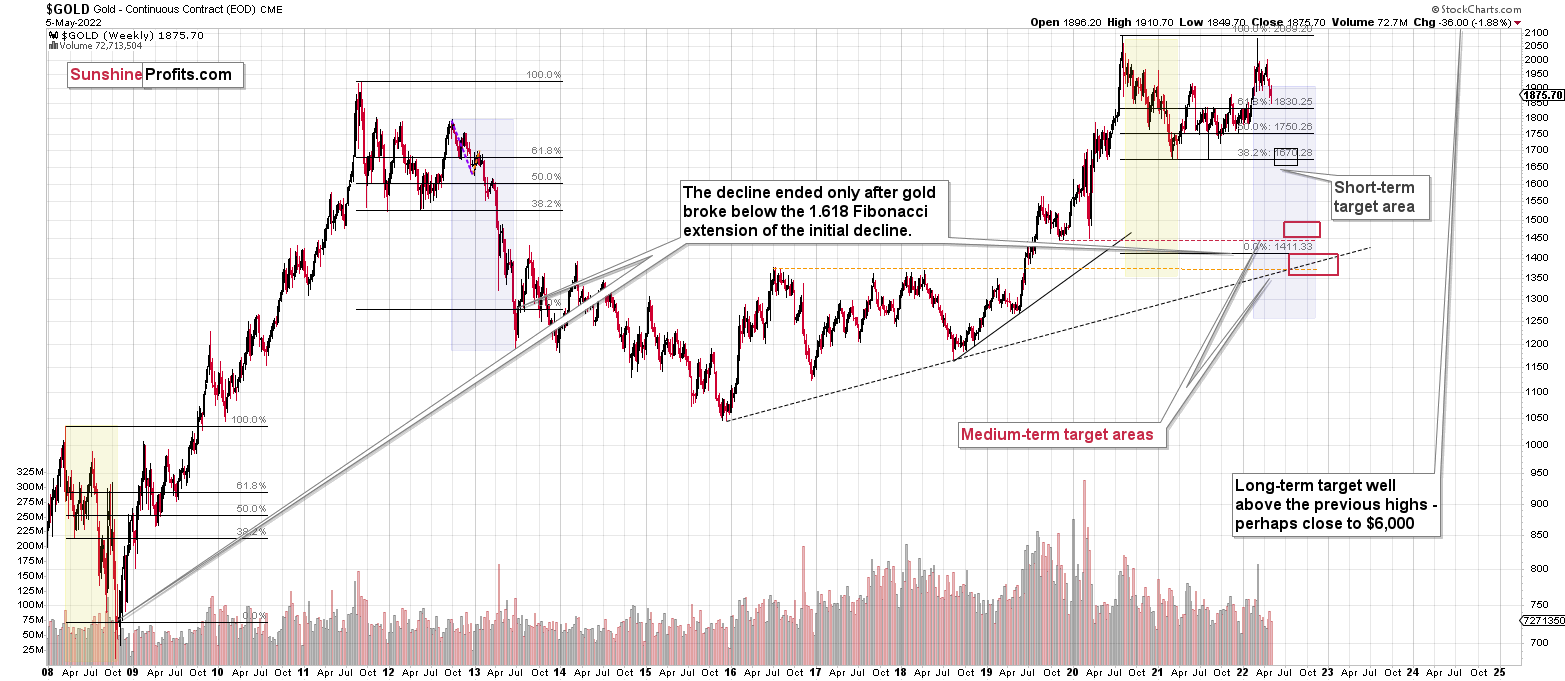
Truth be told, what we see in gold is quite in tune with what we saw after the 2011 top, and in particular, shortly after the 2012 top. The long-term gold price chart below provides details.
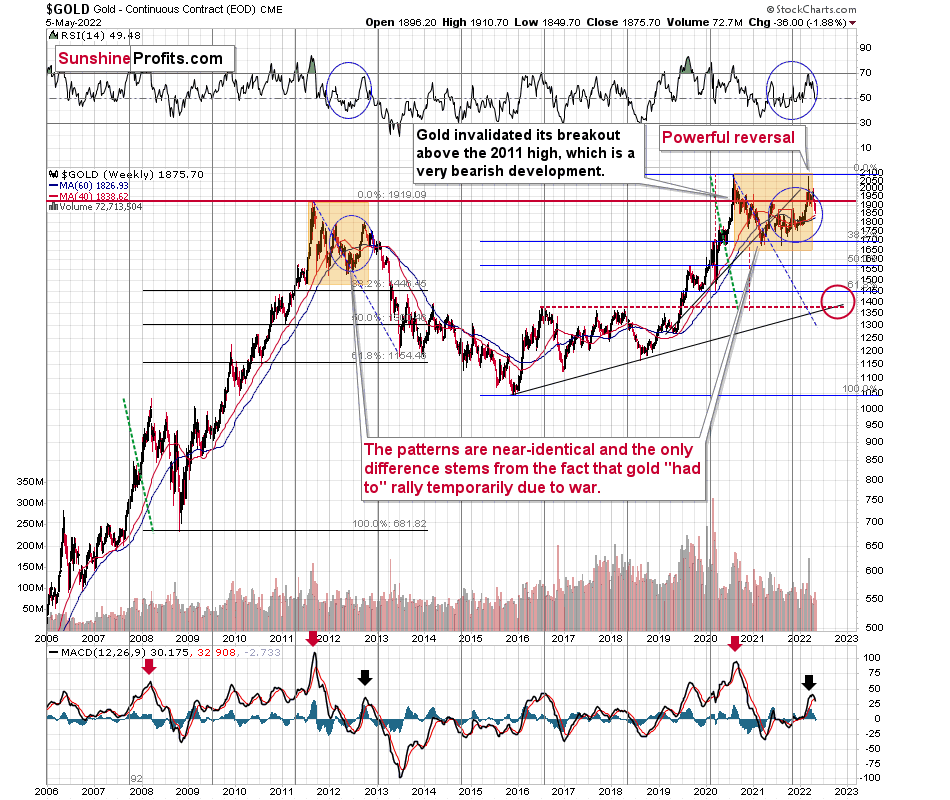
It seems that if it weren’t for the war in Europe, gold wouldn’t have been able to move above $2,000 and instead it would have topped close to its previous highs, which provided strong resistance.
The extraordinary thing about that is that that’s exactly what happened in 2012. Gold moved higher but only until it reached its previous highs, which happened in the second half of 2012.
This time the RSI was a bit higher, but it was close to 70, just like what we saw in 2012.
The moves that we see in the long-term MACD indicator (lower part of the above chart) also confirm the analogy between now and 2012. The indicator is between 25 and 50, and it’s above its previous local top (early 2012 and mid-2021), and this local top formed after a profound decline from the ultimate top.
Yes, this time gold moved back to the previous high, but:
- This happened based on a geopolitical event (war in Europe) and geopolitically-driven rallies are generally unsustainable;
- When gold reached its previous highs, it also formed a profound weekly reversal, which formed on huge volume, and that’s very bearish.
So, the current outlook for gold is very bearish – the recent back and forth movement (the consolidation) appears analogous to the back-and-forth part of the decline that we saw right after the 2012 top. That was the beginning of a huge medium-term downswing.
There are also very interesting short-term takeaways from the above chart.
If the 2012-2013 is currently being replayed (at least to a significant extent), then let’s not forget that this decline initially took the shape of a back-and-forth decline with lower lows and lower highs (but there were notable short-term rallies within the decline).
One of those counter-trend rallies took place when gold touched its 40- and 60-week moving averages (marked with blue and red) in late 2012. The RSI was trading at about 50 at that time, and that’s more or less when we saw the clear sell signal from the MACD indicator (lower part of the above chart).
Let’s see how this applies to the current situation.
The 40- and 60-week moving averages are currently trading at ~$1,827 and ~$1,839, respectively. Consequently, they are quite close to recent short-term lows.
The RSI is at 49.48, so just below 50.
We just saw a clear sell signal from the MACD indicator.
Consequently, seeing a brief rally here or after an additional small decline would not be bullish – it would be a perfectly bearish confirmation of the 2012-now analogy.
It seems that gold is “almost” at its very short-term downside target, and we can see the same thing in the case of the silver market.
Immediately after the Easter holiday, the white metal moved to approximately its previous high, which provided resistance, and then it declined. In other words, silver once again failed to rally above the 50% retracement based on the 2021 decline. Now it’s sliding.
The next strong support for silver is provided by its 2021 lows, a bit below the $22 level.
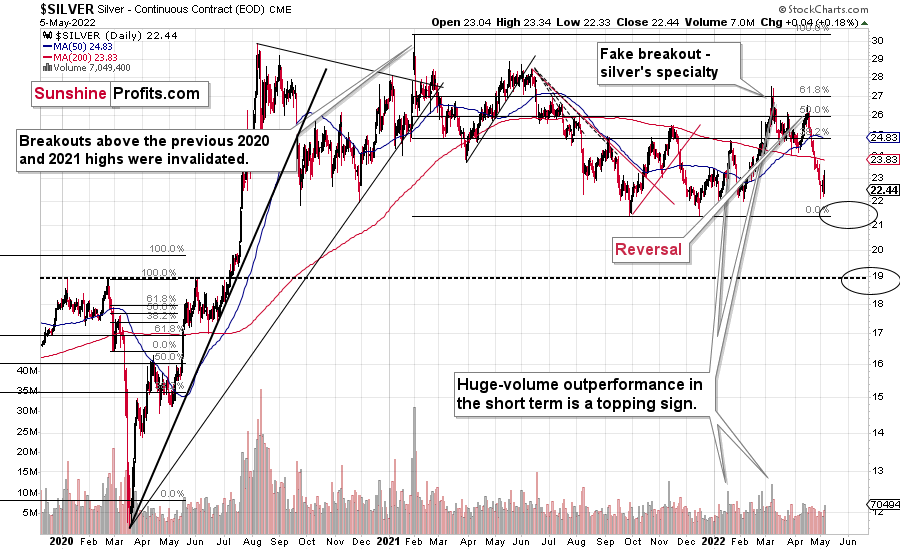
Let’s keep in mind that silver outperformed gold right at the end of the recent rally, which further validates the theory that the rally is already over – silver’s outperformance is what we tend to see in the final parts of a given rally.
This is bearish, and it’s in tune with other indications that we have gotten previously from the price of the white metal.
First of all, when silver got really popular in early 2021, it still failed to hold the breakout above the previous highs. Back then, very few people wanted to listen to this, but I warned that this was the exact wrong moment to buy silver and that better buying opportunities were likely ahead. Well, it turns out that those buying at close to $30 have bought at close to a year+ top. As practically everyone interested had already gotten in, the price declined as there was nobody (of course, that’s just an oversimplification) else who wanted to buy, and the market needs to attract fresh buying power if the price is to rally.
Anyway, after that invalidation, silver never managed to get very close to the $30 level.
Sure, it will likely surpass it, and then the previous all-time high, and then move to three digits, but it doesn’t mean that it has to happen very soon, as well as that silver can’t slide profoundly before that happens.
In fact, gold is not the only precious metal that is repeating its 2012 performance right now, and you can see more details on silver’s long-term chart.
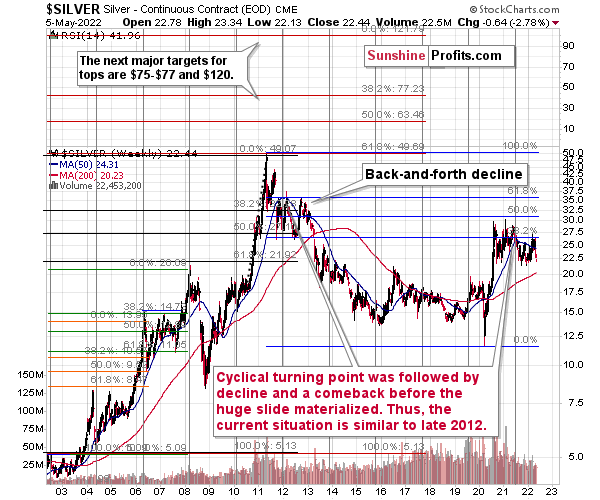
As you can see on the above chart, silver corrected about 50% of the previous downswing, and this correction ended at about $30, a long time ago. Ever since, silver has been declining, and even the outbreak of war in Europe didn’t make silver rally above that level.
On the above chart, you can see how silver first topped in 2011, then declined and formed another top at the cyclical turning point. Next, it declined once again – to the previous lows. After that, silver rallied (in 2012 and 2022), and it topped between its 50-week moving average (marked in blue) and the previous top. Now silver is declining in a back-and-forth manner (you can see it more clearly on the previous short-term silver chart).
Back in 2012, these were just the early days of a gargantuan decline, and the same appears likely to be the case this time. Interest rates are going up after all, and the Fed is determined to quench inflation.
Let’s not forget that rising interest rates are likely to negatively impact not just commodities, but practically all industries. This will likely cause silver’s price to decline profoundly, as silver’s industrial demand could be negatively impacted by lower economic growth (or a decline in economic activity).
Besides, please note that silver didn’t even manage to rally as much as copper (which tried to move to new highs recently) or most other commodities, thus being rather weak.
Consequently, it seems that silver will need to decline profoundly before it rallies (to new all-time highs) once again.
As far as the very near term is concerned, silver confirms the indications coming from the gold market – namely, that it’s close to its support/target level, but not yet at it. Consequently, we might see another quick move lower before we see a short-term rebound.
Having said that, let’s take a look at what happened in junior mining stocks.
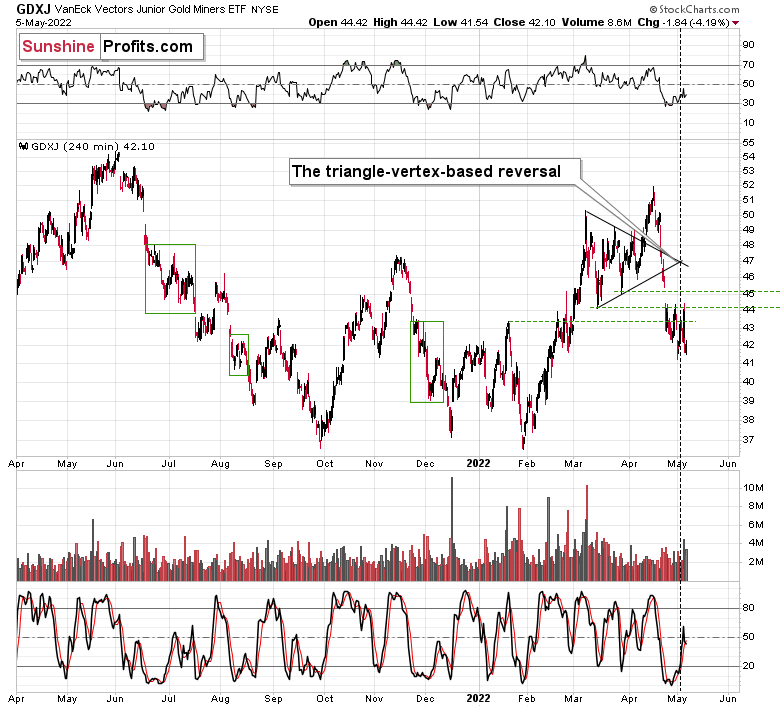
Based on the 4-hour chart, it seems that junior miners are after a brief consolidation and about to break lower. In fact, what we saw in the last couple of days could be described as a “flag pattern”. Flags tend to be followed by moves similar to the ones that preceded them.
In this case, it would imply a decline to more or less the previous 2022 low (~$37).
Still, given what we see on the broader – daily – chart, the counter-trend rally might start sooner than one may think.
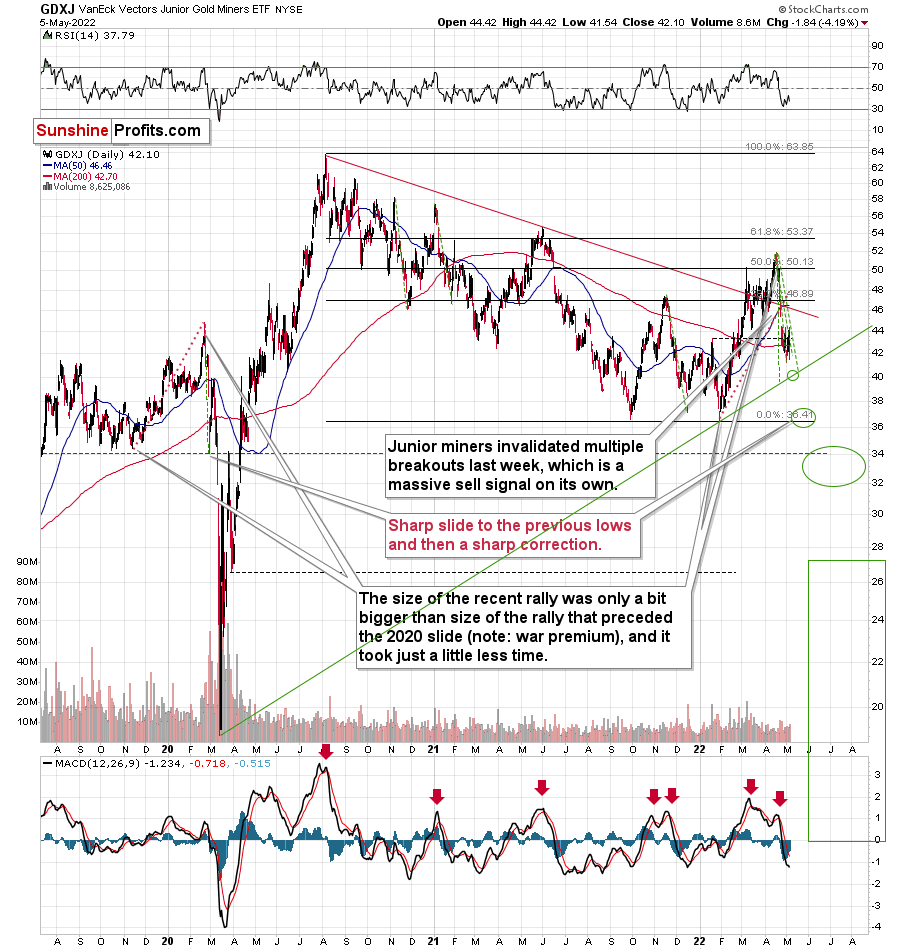
The reasons that we see on the above chart are:
- the proximity of the rising green support line based on the 2020 and 2022 lows – it’s likely to provide support,
- the RSI that’s close to the 30 level, but not yet at it – since this level tends to trigger rallies in the GDXJ, it seems that just after another short-term decline we’ll get this buy signal.
Consequently, it seems that ~$37 might be one of the levels from which the GDXJ corrects but the initial correction could start a bit higher – at about ~$40.
Also, let’s not forget about the forest while looking at individual trees. By that, I mean looking at how gold stocks perform relative to gold. That’s one of the major indications that the current situation is just like what we saw at the 2012 top.
I previously wrote the following:
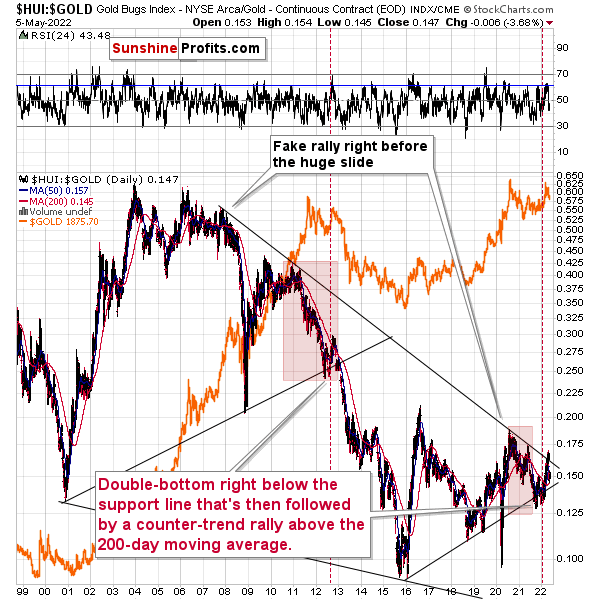
Gold stocks (GDX, GDXJ, and HUI Index) have recently been quite strong relative to gold. OK, but is this necessarily bullish? It might be, until one considers the fact that we saw the same thing at the 2012 top! This changes everything, and it does so, because the links between now and that top are almost everywhere: in gold, in silver, in gold stocks, and even in their ratios.
As it turns out, the gold stocks to gold ratio is behaving almost identically as it was behaving at the 2012 top in the precious metals sector.
In both cases, the ratio moved below the rising medium-term support line, then formed a double-bottom below the line, and invalidated the breakdown, which resulted in a counter-trend rally. The rally ended shortly after the ratio moved above its 200-day moving average (marked in red). That’s what happened recently. What happened next in 2012? The decline not only continued – it accelerated!
Consequently, the recent action in the ratio is not really bullish. In other words, the fact that gold stocks were recently (in the short run only) strong relative to gold doesn’t make the medium-term outlook for the precious metals sector bullish. However, it remains bearish.
Interestingly, the ratio itself moved to its declining resistance line (and it even moved slightly above it, but the move is too small to be viewed as reliable yet), indicating that the corrective upswing might already be over or almost over. We get the same indication from the RSI indicator. It’s not above 70, but in the case of most local tops, the RSI didn’t have to move above 70. It just moved to more or less the same levels – I marked it with a horizontal blue line.
The above is actually a confirmation of the analogy that is visible directly in all three key components of the precious metals sector: gold, silver, and mining stocks.
Indeed – the HUI to gold ratio moved lower recently, clearly invalidating the breakout above its declining resistance line – in line with my previous expectations. The implications are extremely bearish, as it appears that the 2012-2013 decline will now be repeated to a considerable extent.
I already discussed the ones in gold and silver, so let’s take a look at the analogy in the HUI Index – a proxy for gold stocks.
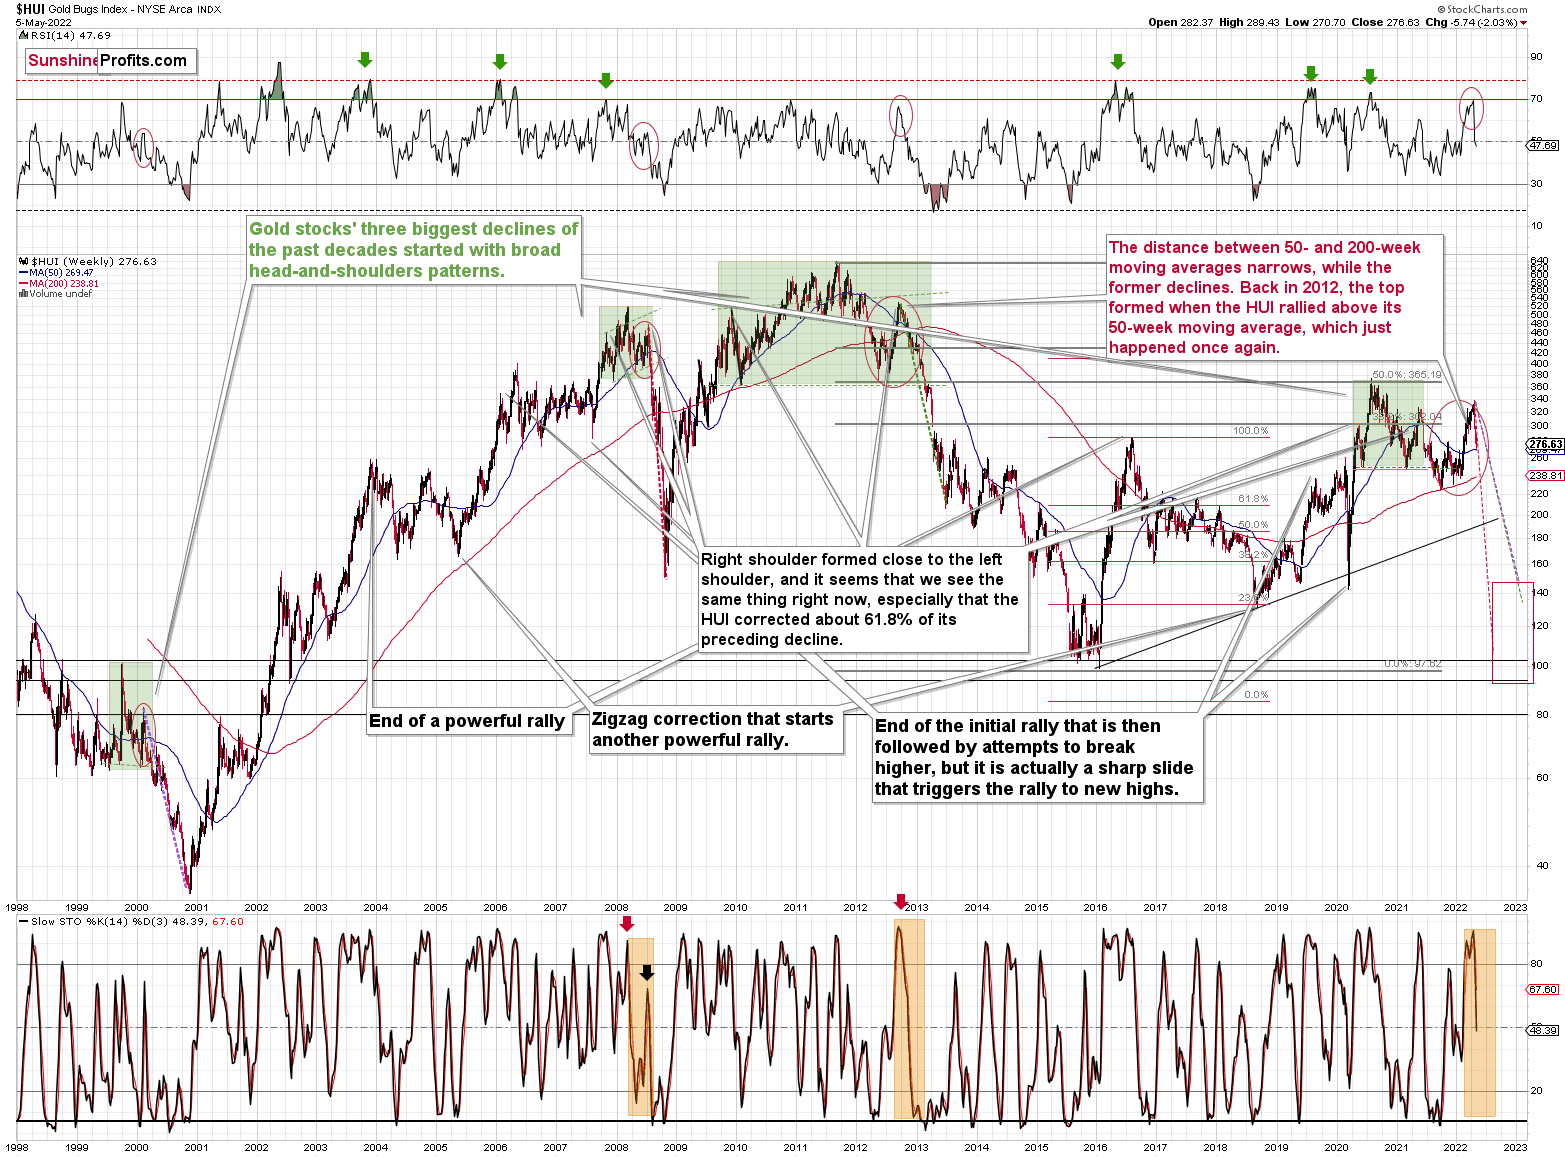
If you look at the areas marked with red circles (especially now, 2012/2013, and 2008), you’ll notice that they are very similar. These are the sizable short-term rallies that we saw after / in the final parts of the broad head-and-shoulders patterns.
The moves were quite sizable – the 2012 rally was even bigger than the current one, even though there was no war in Europe at that time.
Based on how broad the pattern is and the self-similarity present in gold, it seems that the analogy to what happened in 2012 is most important right now.
Looking at the moving averages, we see that the 50-week moving average (blue) and 200-week moving average (red) performed quite specifically in late 2012, and we see the same thing this year.
The distance between 50- and 200-week moving averages is currently narrowing, while the former is declining. Back in 2012, the top formed when the HUI rallied above its 50-week moving average, which just happened once again.
The RSI indicator (above the price chart), based on the HUI Index’s weekly chart, provides us with another confirmation of the analogy, and the same goes for the stochastic indicator (below the price chart). The former was just close to the 70 level – exactly what we saw at the 2012 top, and the latter was above 90 – again, something that we saw at the 2012 top.
As history tends to rhyme, gold stocks are likely to slide, similarly to how they declined in 2012 and 2013.
Still, if the general stock market slides, and that appears likely for the following weeks and months, then we might have a decline that’s actually similar to what happened in 2008. Back then, gold stocks declined profoundly, and they have done so very quickly.
The dashed lines that start from the recent prices are copy-paste versions of the previous declines that started from the final medium-term tops. If the decline is as sharp and as big as what we saw in 2008, gold stocks would be likely to decline sharply, approximately to their 2016 low. If the decline is more moderate, then they could decline “only” to 120-150 or so. Either way, the implications are very, very, very bearish for the following weeks.
Also, we saw a fresh sell signal from the weekly stochastic indicator, which (unlike its 4-hour version) is quite efficient. This is a very bearish development for the medium term. After all, the last two times we saw this signal were at the 2021 and 2020 tops.
Let’s take a brief look at the stock market indices.
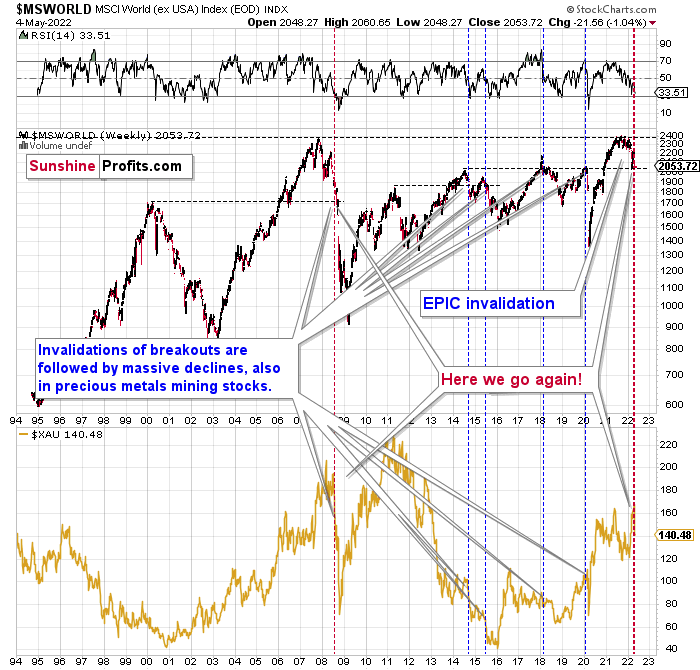
The technical picture in the case of world stocks remains extremely bearish, and my previous comments on it remain up-to-date:
World stocks have already begun their decline, and based on the analogy to the previous invalidations, the decline is not likely to be small. In fact, it’s likely to be huge.
For context, I explained the ominous implications on Nov. 30. I wrote:
Something truly epic is happening in this chart. Namely, world stocks tried to soar above their 2007 high, they managed to do so, and… they failed to hold the ground. Despite a few attempts, the breakout was invalidated. Given that there were a few attempts and that the previous high was the all-time high (so it doesn’t get more important than that), the invalidation is a truly critical development.
It's a strong sell signal for the medium - and quite possibly for the long term.
From our – precious metals investors’ and traders’ – point of view, this is also of critical importance. All previous important invalidations of breakouts in world stocks were followed by massive declines in mining stocks (represented by the XAU Index).
Two of the four similar cases are the 2008 and 2020 declines. In all cases, the declines were huge, and the only reason why they appear “moderate” in the lower part of the above chart is that it has a “linear” and not a “logarithmic” scale. You probably still remember how significant and painful (if you were long, that is) the decline at the beginning of 2020 was.
Now, all those invalidations triggered big declines in the mining stocks, and we have “the mother of all stock market invalidations” at the moment, so the implications are not only bearish, but extremely bearish.
What does it mean? It means that it is time to get out of the short position in mining stocks to get a few extra dollars from immediate-term trades that might be risky. The possibility that the omicron variant of COVID makes vaccination ineffective is too great to be ignored as well. If that happens, we might see 2020 all over again – to some extent. In this environment, it looks like the situation is “pennies to the upside and dollars to the downside” for mining stocks. Perhaps tens of dollars to the downside… You have been warned.
World stocks have declined to their previous highs, and when something similar happened in 2008, it meant that both stocks and gold and silver mining stocks (lower part of the chart) were about to slide much further. In particular, that’s when the corrective upswing in the miners ended and the huge slide started. The implications for mining stocks are extremely bearish.
Let’s take a look at the U.S. stock market.
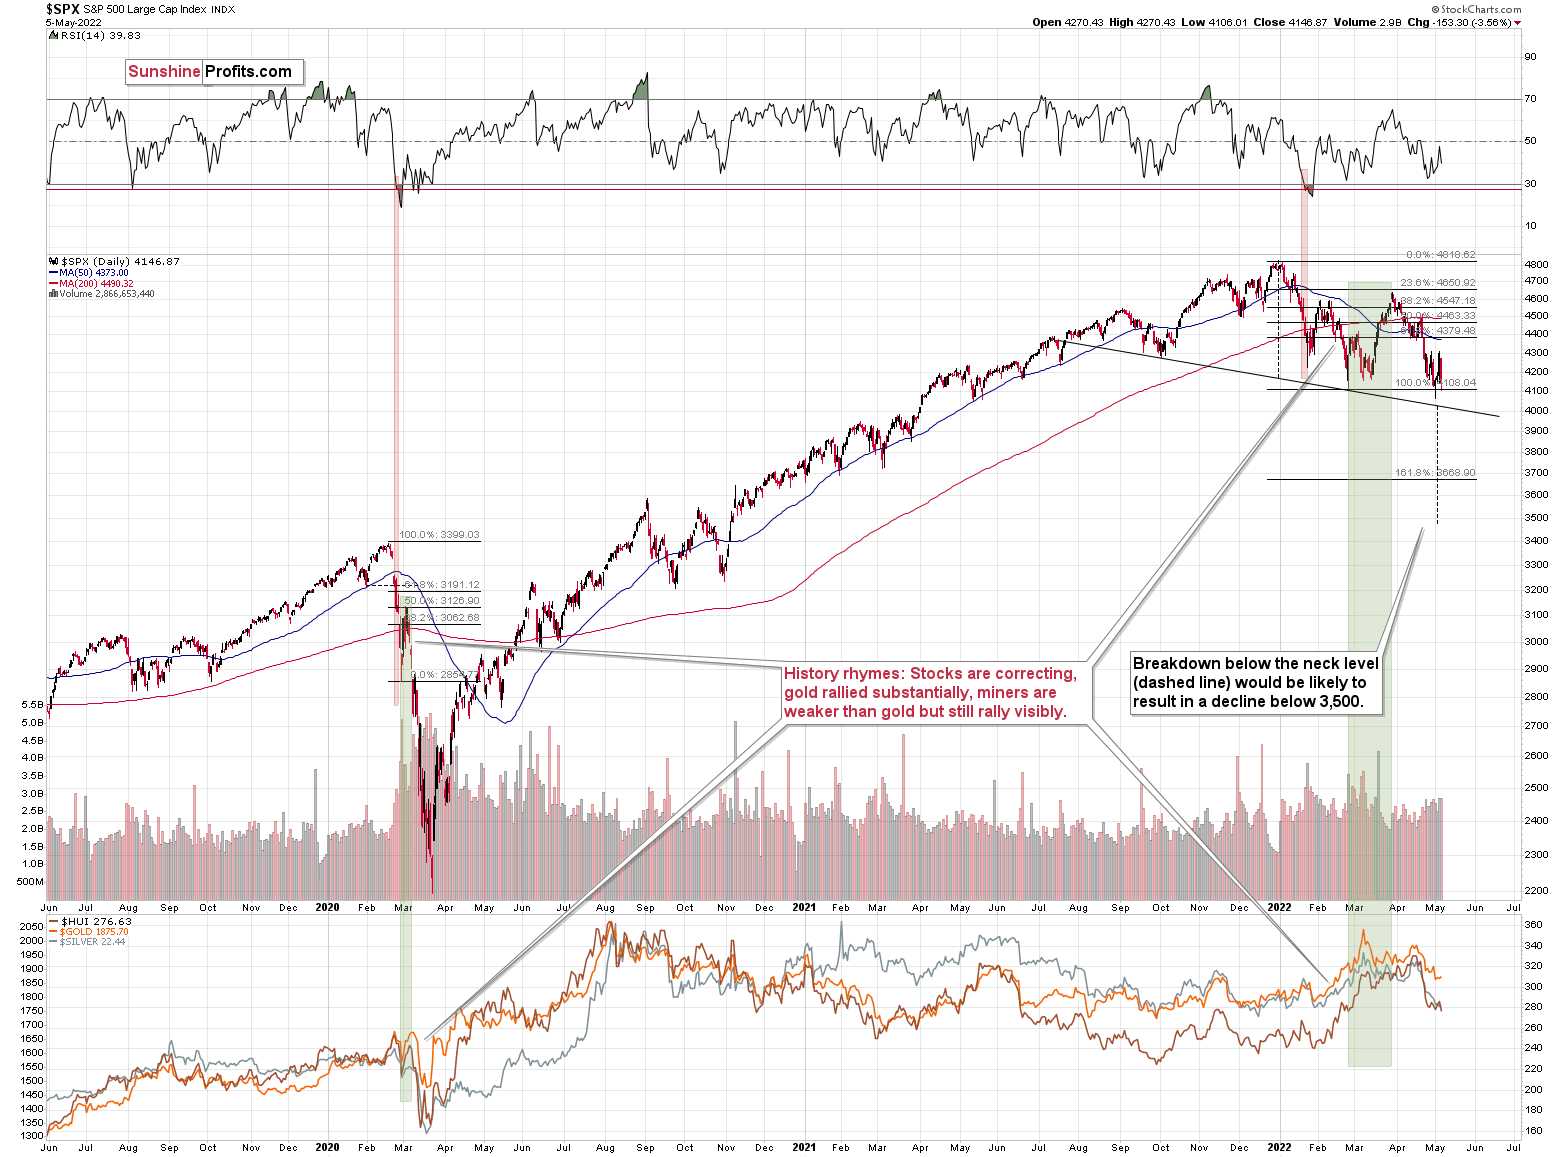
After the immediate “phew-its-not-a-0.75-rate-hike rally”, we saw a “hold-up-rates-are-still-soaring-aaah-decline”. Is the relief rally already over?
That, ladies and gentlemen, is the key question right now.
It could be the case that one rally is over, but it doesn’t mean that another one couldn’t start from just slightly lower levels.
The S&P 500 is currently forming a (potential so far) head and shoulders pattern, and once it moves below its neck level (slightly above 4,000), the formation will be complete, and the next target will be below 3,500. So, yes, I expect the S&P 500 to decline below its 2021 lows in the near future.
Still, it doesn’t mean that we can’t get another brief rally in the meantime. In fact, the head and shoulders formations are often immediately followed by a brief corrective upswing – one that takes the market close to or right back to the previously broken neck level of the H&S pattern. Seeing this kind of rally would perfectly correspond to the scenario in which S&P rallies when the RSI indicator moves to 30, and it would perfectly match other potential price moves that I mentioned earlier today.
In other words, if stocks decline somewhat and then correct, it could translate into the same thing in gold, silver, and mining stocks. Given the stronger link between stocks and silver and miners duo, the latter could correct more visibly.
From a broader point of view, let’s keep in mind what happened in the previous cases when stocks declined profoundly – in early 2020 and in 2008. Miners and silver declined in a truly epic manner, and yes, the same is likely to take place in the following months, as markets wake up to the reality, which is that the USD Index and real interest rates are going up.
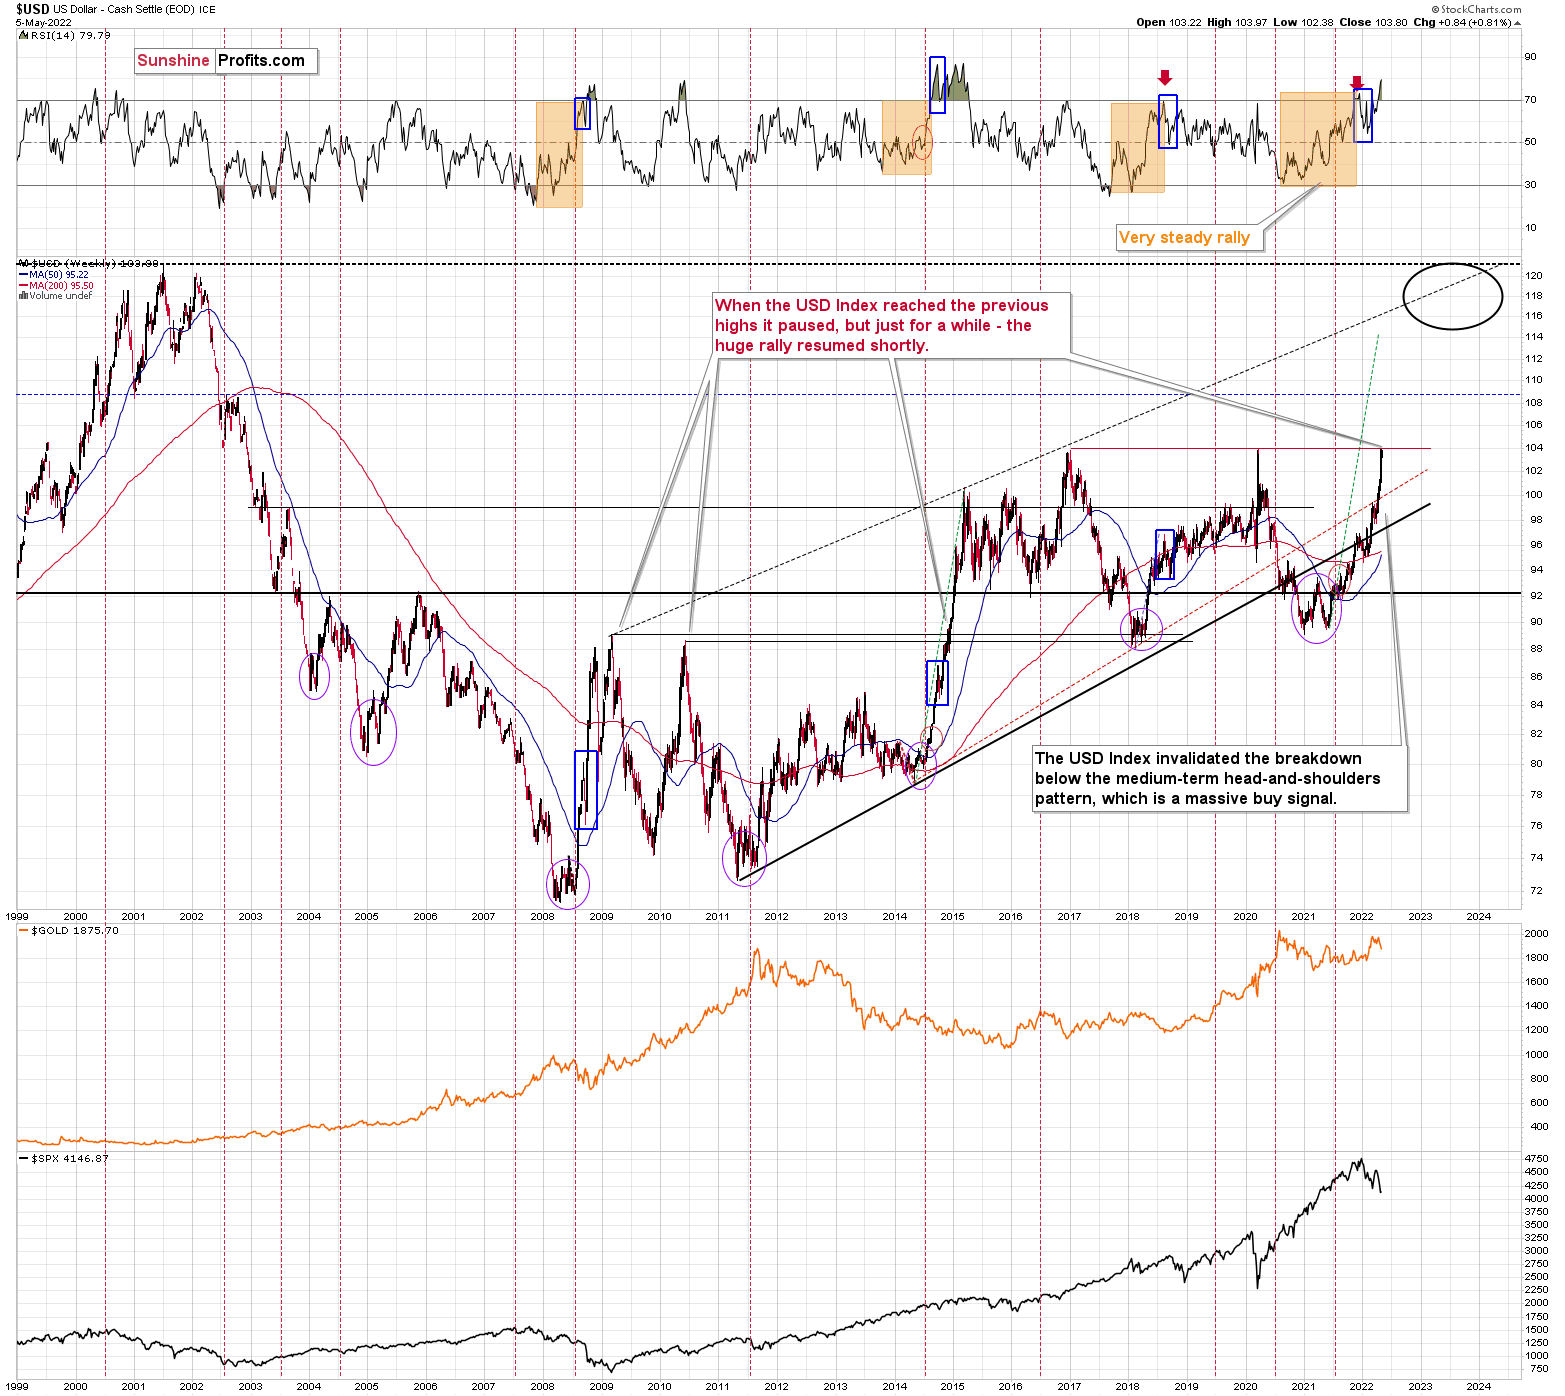
Speaking of the USD Index, after invalidating the breakout below the multi-year head-and-shoulders pattern, the USDX was poised to soar, just like I’ve been expecting it to do for more than a year, and that’s exactly what it did.
The RSI is currently above 70, but since the USDX is in a medium-term rally and is already after a visible correction, it can rally further. Please note that we saw the same thing in 2008 and 2014. I marked the corrections with blue rectangles.
Still, the USD Index is now practically right at its next strong resistance – at about 104.
I previously wrote the following about this target:
It doesn’t mean that the USD Index’s rally is likely to end there. It’s not – but the USDX could take a breather when it reaches 104. Then, after many investors think that the top has been reached as the USDX corrects, the big rally is likely to continue.
The important detail here is that the consolidation close to the 104 level doesn’t have to be really significant (perhaps 1-2 index points of back-and-forth movement?) and it definitely doesn’t have to take long. The interest rates are going higher, and investors appear to have just woken up to this reality – it will take some time before everyone digests what’s going on. Before the late-reality-adopters join in, the USD Index could be trading much, much higher.
Back in 2014, when the USD Index approached its previous highs (close to 89), it consolidated so quickly that it’s almost not visible on the above chart – it took just a bit more than a week (from Dec. 8, 2014 – 89.56 to Dec. 16, 2014 – 87.83).
We could see something similar this time – and as the USD Index corrects for about a week, the same thing could take place in other markets as well: stocks and PMs. If junior miners were after a very sharp slide at that time, they would be likely to correct sharply as well.
I would like to add one important detail. Back in 2014, the USD Index didn’t correct after reaching its previous high. It corrected after moving above it. The higher of the highs was the March 2009 high, at 89.11.
The higher of the recent highs is at 103.96 right now, so if the analogy to 2014 is to remain intact, the USD Index could now top at close to 104.5 or even 105.
On the other hand, let’s keep in mind that history doesn’t have to repeat itself to the letter – it can rhyme. Consequently, this week’s back-and-forth movement could already be the analogy to the correction that took place in late 2014. The USD Index, therefore, doesn’t provide us with a lot of insight into the short-term outlook, but it does tell us that the potential for another huge wave up in the USDX is present, and the same goes for the potential for the enormous decline in the precious metals sector in the next several months.
All in all, the technical picture for mining stocks is extremely bearish for the next few months, even though we might see a short-term correction soon.
Do I plan to trade this correction? It depends on whether we get a sharp decline today. If so, then yes (and the current exit prices for the short position remain up-to-date). If not, then… We’ll see. Unless our downside target levels are reached, I won’t close the current short position today and I won’t enter a long one either. I will then analyze the situation thoroughly before Monday’s analysis, and I’ll let you know what I think then. Having weekly closing prices could provide extra insight.
Naturally, as always, I’ll keep you – my subscribers – informed.
Overview of the Upcoming Part of the Decline
- It seems to me that the post-decline consolidation is now over, and that gold, silver, and mining stocks are now likely to continue their medium-term decline. A brief, short-term rally could materialize soon, anyway.
- It seems that the first ( bigger ) stop for gold will be close to its previous 2021 lows, slightly below $1,800 . Then it will likely correct a bit, but it’s unclear if I want to exit or reverse the current short position based on that – it depends on the number and the nature of the bullish indications that we get at that time.
- After the above-mentioned correction, we’re likely to see a powerful slide, perhaps close to the 2020 low ($1,450 - $1,500).
- If we see a situation where miners slide in a meaningful and volatile way while silver doesn’t (it just declines moderately), I plan to – once again – switch from short positions in miners to short positions in silver. At this time, it’s too early to say at what price levels this could take place, and if we get this kind of opportunity at all – perhaps with gold close to $1,600.
- I plan to exit all remaining short positions once gold shows substantial strength relative to the USD Index while the latter is still rallying. This may be the case with gold close to $1,350 - $1,400. I expect silver to fall the hardest in the final part of the move. This moment (when gold performs very strongly against the rallying USD and miners are strong relative to gold after its substantial decline) is likely to be the best entry point for long-term investments, in my view. This can also happen with gold close to $1,375, but at the moment it’s too early to say with certainty.
- As a confirmation for the above, I will use the (upcoming or perhaps we have already seen it?) top in the general stock market as the starting point for the three-month countdown. The reason is that after the 1929 top, gold miners declined for about three months after the general stock market started to slide. We also saw some confirmations of this theory based on the analogy to 2008. All in all, the precious metals sector is likely to bottom about three months after the general stock market tops.
- The above is based on the information available today, and it might change in the following days/weeks.
You will find my general overview of the outlook for gold on the chart below:
Please note that the above timing details are relatively broad and “for general overview only” – so that you know more or less what I think and how volatile I think the moves are likely to be – on an approximate basis. These time targets are not binding or clear enough for me to think that they should be used for purchasing options, warrants or similar instruments.
Letters to the Editor
Q: Thanks for explaining your outlook with the 3 scenarios in gold prices. My other question would be if the gold price hits your targets by Monday/ Tuesday of next week, would that change your strategy to keep the targets and keep the short strategy?
A: I’m not 100% certain yet. It depends on what happens today. Right now, I’m 60% convinced that I’d leave the targets intact and 40% convinced that I’d skip this correction and focus on the medium-term downtrend. However, again, this could change based on what we see today.
Q: PR, I appreciate the thoroughness of your analyses, as usual. I especially appreciate the alternative scenarios you’ve presented for the PM market and related stocks as it stands now. From the slow stochastic and RSI graphs it looks like the market wants to correct up. My question is whether your target prices have to synchronize. Gold hit $1851 before moving up. That’s past the $1853 target price. Yet JDST and GDXD didn’t reach their targets. I take it those won’t be the target prices for the JDST and GDXD if gold drops to $1,350 or $1,400.
A: The targets for gold, silver, and GDXJ are binding on their own. If any of them is hit, I no longer view a short position in this market as justified (whether a position is in a leveraged instrument or not). If targets for leveraged instruments are reached but the ones for the main instruments (gold, silver, GDXJ) are not, then they are binding only for those leveraged instruments.
Well, since the target for gold was already hit, I’m not mentioning any downside targets for gold right now. Some people might want to re-enter the short position in gold to make some extra gains on another quick move down, but that’s too short-term oriented for me to follow up on this potential trade.
In other words, if the target for silver is not reached, but the target for GDXJ is reached, then it means closing the positions in GDXJ, JDST, and GDXD, but not in silver and leveraged instruments based on it.
Q: I think there must be a typo in today's alert as it seems to say that if GDXJ is going down to slightly above $37 within the next few days, then it makes sense to exit at $40.62, which doesn't make sense to me.
> just a very brief pause within a decline to the previous target level (slightly above $37 in the GDXJ), and this target is going to be reached within the next few days.
> Which one is most likely?
> In my view, the first point is rather unlikely. The medium-term trend is down, just as the trends in the USD Index and real interest rates are up.
> You know what's better than knowing the reply to a question about the future? (After all, it's not possible to have a 100% certain answer to anything regarding the future.)
> A strategy! A strategy is a plan for how to act in various future scenarios so that one knows what to do under all circumstances.
> If scenario number 3 is going to happen and the target level is reached shortly (today or tomorrow), then the original expectation for PMs to start a counter-trend rally is likely to be realized. In this case, it makes sense to simply keep the current exit orders intact.
A: To clarify, the above quote is about possible scenarios, and the follow-up text (after the quote) explains how I plan to handle them. If we see a sharp drop to about $40 (or slightly above) today, then I’ll exit the short position right away, without waiting for the ~$37 target to be reached. However, if we see more back and forth movement or even a slight rally without a move to ~$40 in the near term, then it will likely mean that we won’t see a corrective upswing from about $40, and in this case, I’d move the short-term exit prices to about $37 in the GDXJ.
I hope the above clarifies my position. I also added some extra explanations in the main part of today’s analysis. If it’s still unclear, I’ll be happy to explain further on Monday.
Q: I didn’t find any upside targets; only eventual downside targets. For the small counter-rally that began very recently, are there upside targets for this move?
A: We are not in a long position right now – at least not yet. The very recent upswing that was more or less erased yesterday was not something that I wanted to trade as the decline preceding it wasn’t excessive enough to push the risk to reward ratio into a range that supported switching from a short to a long position. That’s why there are no upside targets, only downside targets.
As for the upcoming upside targets, I’ll provide them (precise ones, that is) after we exit the current short position and enter a long one. However, they will likely be around $1,920 in gold, $23.50 in silver, and $44-$45 in the GDXJ.
Summary
Summing up, it seems that we are about to see a short-term corrective upswing in the precious metals sector, even though the medium-term trend remains clearly down.
The medium-term downtrend is likely to continue shortly (perhaps after a weekly or a few-day long correction). As investors are starting to wake up to the reality, the precious metals sector (particularly junior mining stocks) is declining sharply. Here are the key aspects of the reality that market participants have ignored:
- rising real interest rates,
- rising USD Index values.
Both of the aforementioned are the two most important fundamental drivers of the gold price. Since neither the USD Index nor real interest rates are likely to stop rising anytime soon (especially now that inflation has become highly political), the gold price is likely to fall sooner or later. Given the analogy to 2012 in gold, silver, and mining stocks, “sooner” is the more likely outcome.
It seems that our profits from short positions are going to become truly epic in the coming months.
For now, I’m adjusting the exit price levels. Please note that they are “binding exit prices”, which means that I think that exiting the short positions without an additional (manual) confirmation from me is a good idea. I think that once these short positions are closed, entering long ones (100% of the regular position size) is also a good idea. If one wants to use a leveraged ETF for this long trade, the JNUG might be worth considering. However, it seems that in most cases, simply using the GDXJ would be sufficient (I’m writing about 100% of the regular position size, not 200% or 300% as I am right now in the case of the short positions). Then again, it’s your capital, and you can do with it whatever you want and are comfortable with.
Of course, if you’re not comfortable with such short-term trading, you can ignore this quick trade and focus on the bigger downturn.
After the final sell-off (that takes gold to about $1,350-$1,500), I expect the precious metals to rally significantly. The final part of the decline might take as little as 1-5 weeks, so it's important to stay alert to any changes.
As always, we'll keep you – our subscribers – informed.
To summarize:
Trading capital (supplementary part of the portfolio; our opinion): Full speculative short positions (300% of the full position) in junior mining stocks are justified from the risk to reward point of view with the following binding exit profit-take price levels:
Mining stocks (price levels for the GDXJ ETF): binding profit-take exit price: $40.62; stop-loss: none (the volatility is too big to justify a stop-loss order in case of this particular trade)
Alternatively, if one seeks leverage, we’re providing the binding profit-take levels for the JDST (2x leveraged) and GDXD (3x leveraged – which is not suggested for most traders/investors due to the significant leverage). The binding profit-take level for the JDST: $9.83; stop-loss for the JDST: none (the volatility is too big to justify a SL order in case of this particular trade); binding profit-take level for the GDXD: $12.48; stop-loss for the GDXD: none (the volatility is too big to justify a SL order in case of this particular trade).
For-your-information targets (our opinion; we continue to think that mining stocks are the preferred way of taking advantage of the upcoming price move, but if for whatever reason one wants / has to use silver or gold for this trade, we are providing the details anyway.):
Silver futures downside profit-take exit price: $21.63
SLV profit-take exit price: $20.14
ZSL profit-take exit price: $27.89
Gold futures downside profit-take exit price: no position (the target was already reached)
HGD.TO – alternative (Canadian) inverse 2x leveraged gold stocks ETF – the upside profit-take exit price: $6.79
HZD.TO – alternative (Canadian) inverse 2x leveraged silver ETF – the upside profit-take exit price: $21.47
Long-term capital (core part of the portfolio; our opinion): No positions (in other words: cash
Insurance capital (core part of the portfolio; our opinion): Full position
Whether you already subscribed or not, we encourage you to find out how to make the most of our alerts and read our replies to the most common alert-and-gold-trading-related-questions.
Please note that we describe the situation for the day that the alert is posted in the trading section. In other words, if we are writing about a speculative position, it means that it is up-to-date on the day it was posted. We are also featuring the initial target prices to decide whether keeping a position on a given day is in tune with your approach (some moves are too small for medium-term traders, and some might appear too big for day-traders).
Additionally, you might want to read why our stop-loss orders are usually relatively far from the current price.
Please note that a full position doesn't mean using all of the capital for a given trade. You will find details on our thoughts on gold portfolio structuring in the Key Insights section on our website.
As a reminder - "initial target price" means exactly that - an "initial" one. It's not a price level at which we suggest closing positions. If this becomes the case (like it did in the previous trade), we will refer to these levels as levels of exit orders (exactly as we've done previously). Stop-loss levels, however, are naturally not "initial", but something that, in our opinion, might be entered as an order.
Since it is impossible to synchronize target prices and stop-loss levels for all the ETFs and ETNs with the main markets that we provide these levels for (gold, silver and mining stocks - the GDX ETF), the stop-loss levels and target prices for other ETNs and ETF (among other: UGL, GLL, AGQ, ZSL, NUGT, DUST, JNUG, JDST) are provided as supplementary, and not as "final". This means that if a stop-loss or a target level is reached for any of the "additional instruments" (GLL for instance), but not for the "main instrument" (gold in this case), we will view positions in both gold and GLL as still open and the stop-loss for GLL would have to be moved lower. On the other hand, if gold moves to a stop-loss level but GLL doesn't, then we will view both positions (in gold and GLL) as closed. In other words, since it's not possible to be 100% certain that each related instrument moves to a given level when the underlying instrument does, we can't provide levels that would be binding. The levels that we do provide are our best estimate of the levels that will correspond to the levels in the underlying assets, but it will be the underlying assets that one will need to focus on regarding the signs pointing to closing a given position or keeping it open. We might adjust the levels in the "additional instruments" without adjusting the levels in the "main instruments", which will simply mean that we have improved our estimation of these levels, not that we changed our outlook on the markets. We are already working on a tool that would update these levels daily for the most popular ETFs, ETNs and individual mining stocks.
Our preferred ways to invest in and to trade gold along with the reasoning can be found in the how to buy gold section. Furthermore, our preferred ETFs and ETNs can be found in our Gold & Silver ETF Ranking.
As a reminder, Gold & Silver Trading Alerts are posted before or on each trading day (we usually post them before the opening bell, but we don't promise doing that each day). If there's anything urgent, we will send you an additional small alert before posting the main one.
Thank you.
Przemyslaw Radomski, CFA
Founder, Editor-in-chief

