

Briefly: in our opinion, full (300% of the regular position size) speculative short positions in mining stocks are justified from the risk/reward point of view at the moment of publishing this Alert.
During the past 24 hours, the precious metals market moved higher, but not strongly higher. And it should have moved strongly higher given that the USD Index moved to new yearly lows. Consequently, this serves as yet another bearish sign for the PMs and miners.
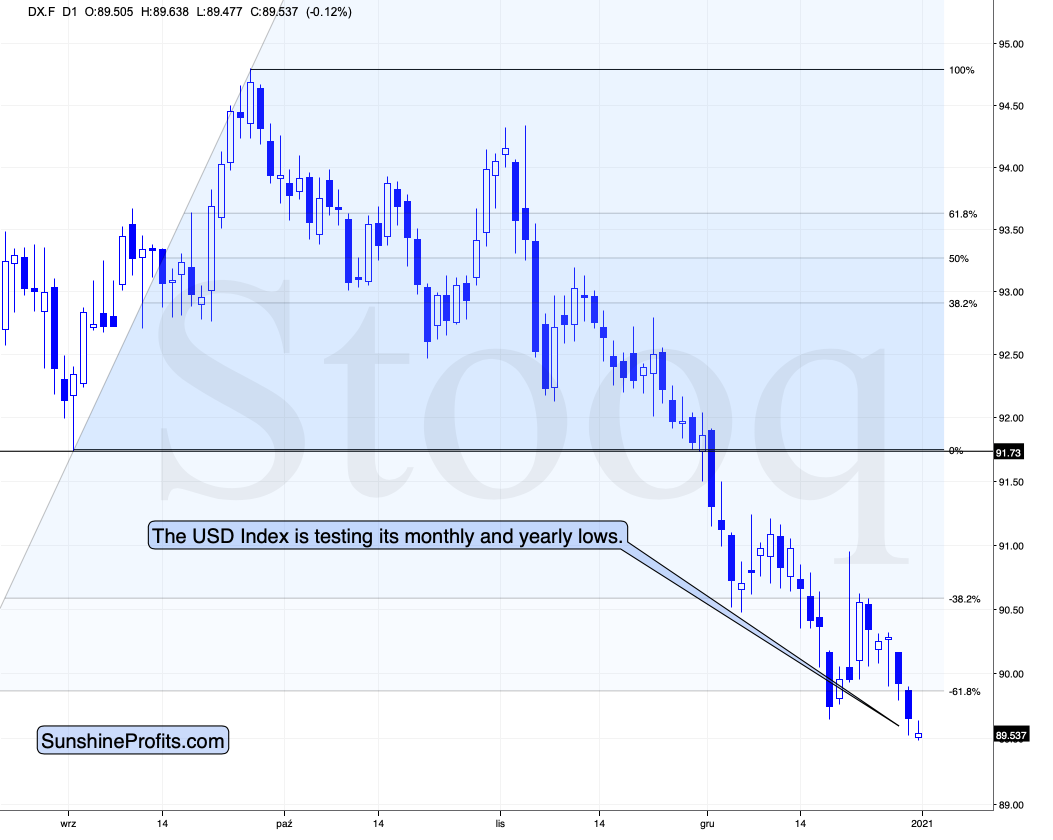
Figure 1 - USD Index
As you can see above, the USDX is at new lows at the moment of writing these words. Before comparing it to gold, please note that the USDX quite often reverses at the turn of the month. This happened in early September and in early November. The most recent move was down, so the above tendency has bullish implications for the U.S. currency.
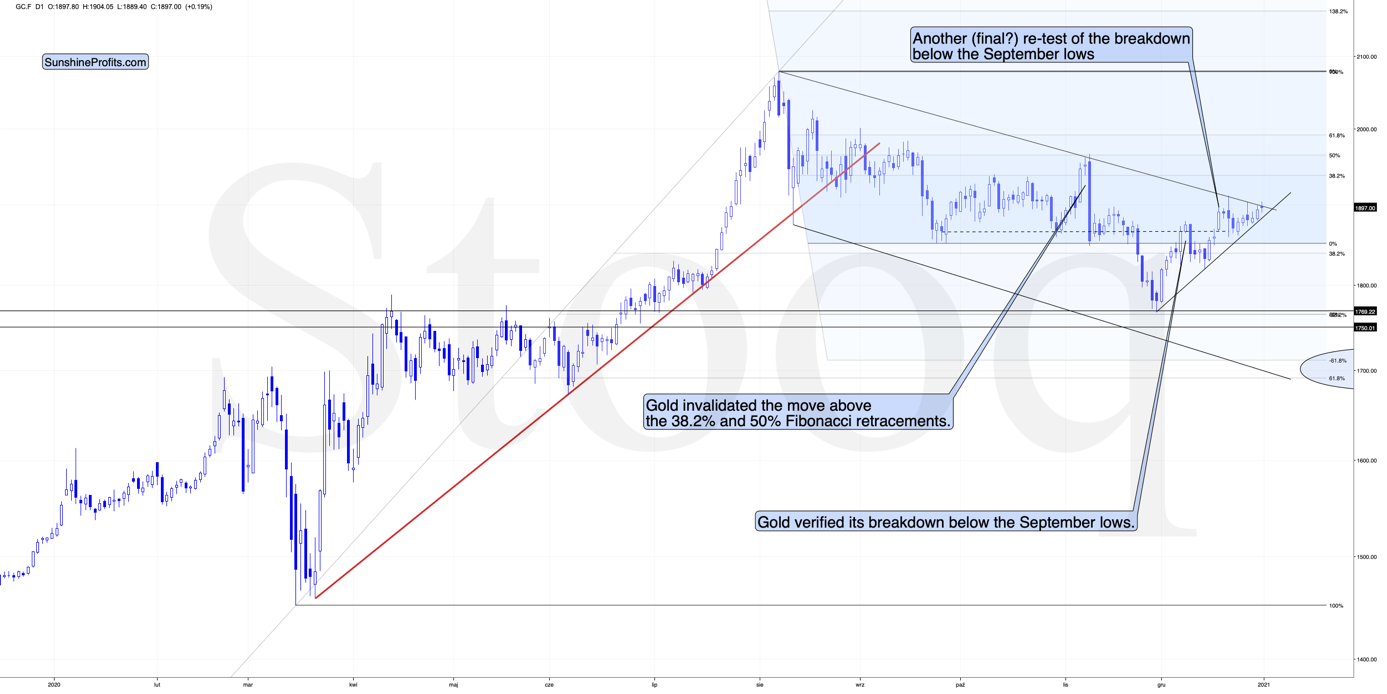
Figure 2 - COMEX Gold Futures
Unlike the USD Index, gold is not at new yearly highs (almost $200 below them, actually), nor is it at new monthly highs.
Moreover, after a temporary breakout, gold is back below its 2011 high. The breakout above the latter was clearly invalidated. The implications for both gold’s relative strength and the invalidation of the breakout above the 2011 high, are bearish.
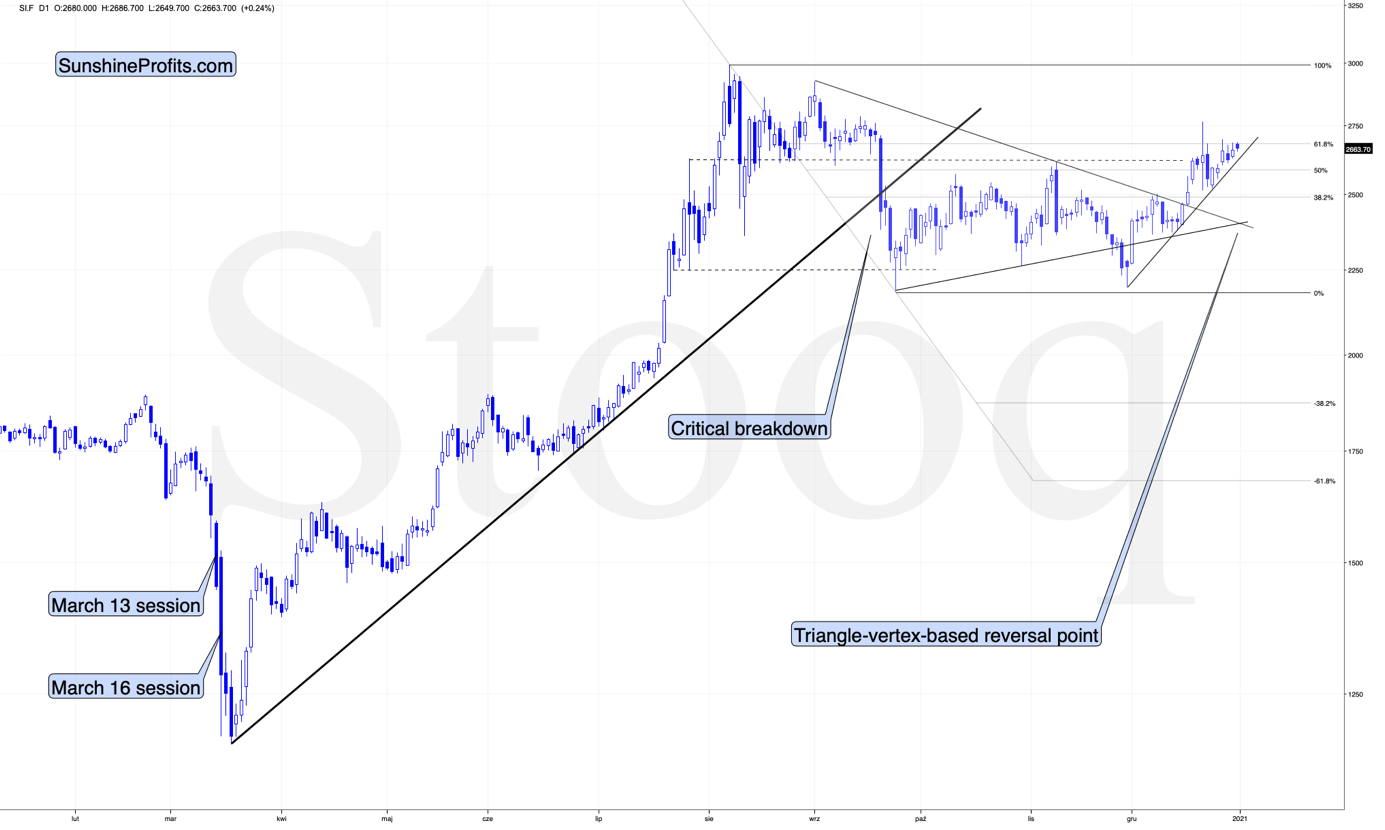
Figure 3 - COMEX Silver Futures
Silver is not even close to its 2011 high, and while it’s relatively strong compared to gold and miners on a short-term basis, it’s not at its December high right now. It’s also a few dollars below its yearly high.
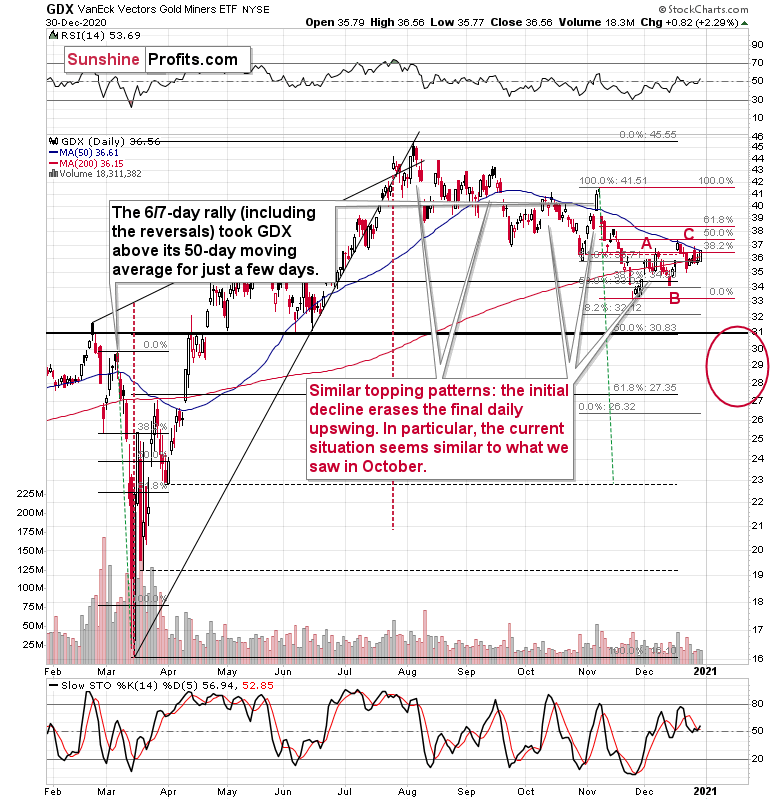
Figure 4 - GDX VanEck Vectors Gold Miners ETF (Feb – Dec 2020)
Miners moved higher yesterday, but not above their December highs, let alone their yearly highs. They continue to be weak relative to practically everything else, including signals from the USD Index, general stock market, gold, and silver. If this was a true rally in gold, miners would have been leading the way higher. That’s clearly not taking place. Instead, miners are weak, which indicates that they are leading the rest of the precious metals sector lower.
Consequently, practically all of this week’s comments on their performance remain up-to-date:
We see that the GDX ETF moved lower once again despite the intraday attempt to rally. During yesterday’s session, miners once again moved back to their 50-day moving average and… Once again verified it as resistance. The implications are bearish.
Let’s get back to silver once again. On its chart, you can see a triangle-vertex-based reversal at the end of the year. Before the price moves close to the reversal, it’s relatively unclear what kind of implications a given reversal is likely to have. Well, including today’s session, there remain only three sessions until the end of the year, so we’re likely to see the reversal shortly.
Based on the likelihood that the next big move is going to be to the downside, it would fit the overall picture more if the upcoming reversal was a top, not a bottom. A bottom would imply a rally in the following days or weeks, and the relative performance (as described above and yesterday) along with other factors (as described yesterday) continues to favor a bigger decline.
This means that we might not see a meaningful decline for a few more days, and we might even see one final move higher before the top is formed. This could be something that takes place in silver only, or something that we see in gold and miners as well. Still, I don’t expect it to be really significant in case of the latter. They are underperforming the metals, after all.
Having said that, let’s discuss the question that you’re probably asking yourself given the time of the year.
Will Gold Soar Shortly, like it Did in Most Januaries?
In a nutshell, gold didn’t just “soar” in previous Januaries, but rather reversed at the end of the year and then moved in the opposite direction in January – canceling the December moves. “New year – new me” sounds cliché, but that’s what gold has actually been adhering to instead of simply soaring.
Let’s take a look at gold’s very long-term chart for details.
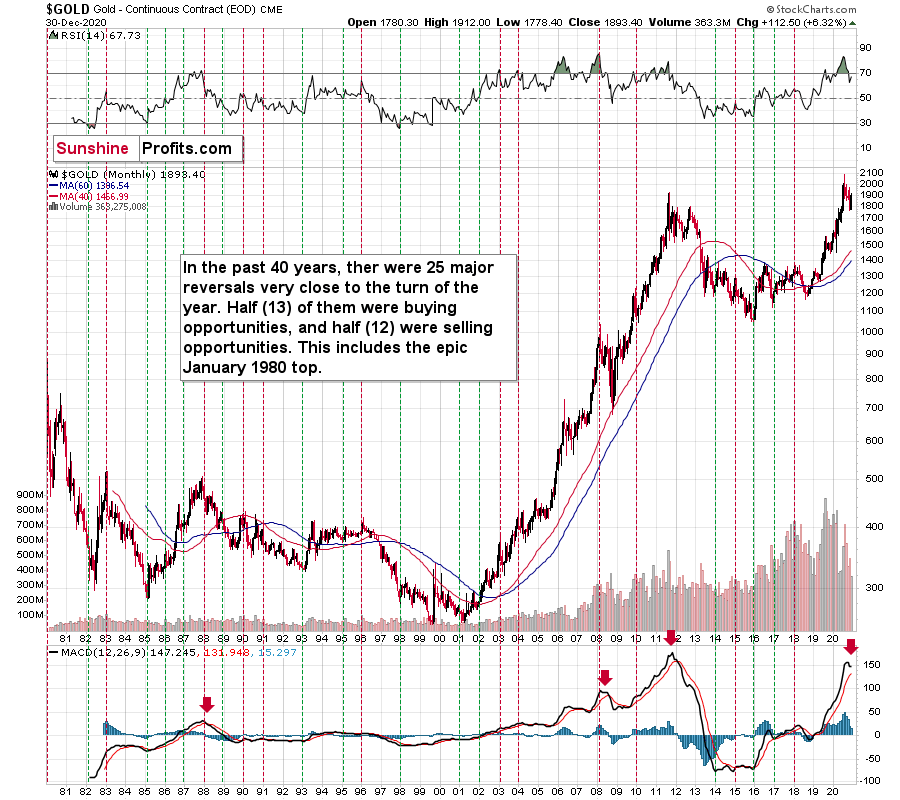
Figure 5 - Gold Continuous Contract Overview
The above chart covers the past 40 years. The green vertical lines represent cases when (approximately) the turn of the year was a great buying opportunity. The red lines represent cases when (approximately) the turn of the year was a great selling opportunity.
There were 25 cases when gold visibly reversed close to the end of the year or the beginning of the new year – so that’s what happens in most cases.
In 13 of the cases, those were buying opportunities.
In 12 of the cases, those were selling opportunities.
Since the number of turning points is not divisible, the 13-12 breakdown is the closest that it can get to 50/50.
So, while it’s true that in most past cases, the turn of the year was positive for gold, it’s also true that the gold price forecast for January 2021 is not necessarily going to be bullish. The context is important, since:
- Gold has been rallying in December 2020
- Gold tends to reverse at the turn of the year
The implications of the 0 becoming a 1 at the end of the date are actually bearish for the yellow metal.
Moreover, please take a look at the lower part of the above chart. It features the MACD indicator based on the monthly gold prices. There were very few cases when this indicator moved up significantly and then clearly declined. This happened only four times in the previous four decades. Once in the late 1980s, once in early 2008, once in 2011, and once recently. In all previous cases, it heralded months of declines.
This does not bode well for the price of the yellow metal at all, especially considering that it recently invalidated its breakout above the 2011 high.
Before summarizing, let’s take a look at the bigger picture.
History in the Making
Yesterday, I highlighted how the behavior of U.S. equity investors mirrors the rampant speculation seen during the dot-com bubble. And with the New Year less than 24 hours away, will 2021 be the reincarnation of 2000?
For starters, there is an old saying on Wall Street that ‘bulls make money, bears make money and pigs get slaughtered.’
And just like on the ranch, the fatter the investing hogs get, the earlier they’re likely to harvest.
Right now, investors are surfing a wave of unlimited liquidity: Central banks keep printing and fiscal deficits are exploding. However, there is a fine line between need and excess. And when the pendulum swings too far to the latter, speculation becomes a drug. Just like addicts experiencing a euphoric high, ever-rising stock prices make investors feel invincible.
Please see the chart below:
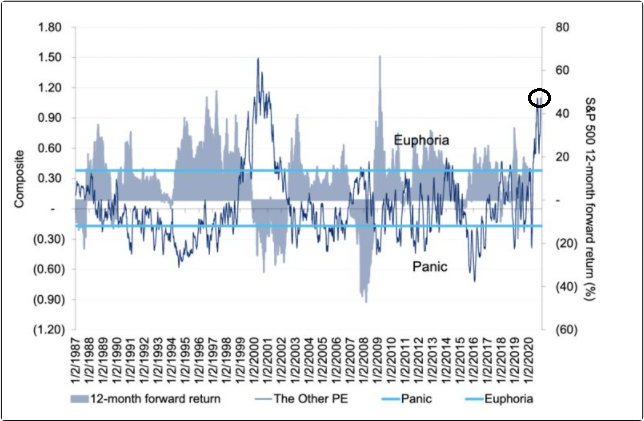
Figure 6 - Panic/Euphoria Model (Source: Citigroup)
With a reading of 1.10, Citigroup’s Panic/Euphoria model is at one of the highest levels in ~33 years. Furthermore, Tobias Levkovich, the bank’s chief U.S. equity strategist, said that the models’ historical patterns imply a “100% probability of losing money in the coming 12 months.”
Adding to the excess, the S&P 500’s trailing Price/Earnings ends 2020 at the third-highest level in the last ~100 years (exceeded only in 1921 and 1999). Moreover, at 25x, the current P/E is 67% higher than its historical average (15).
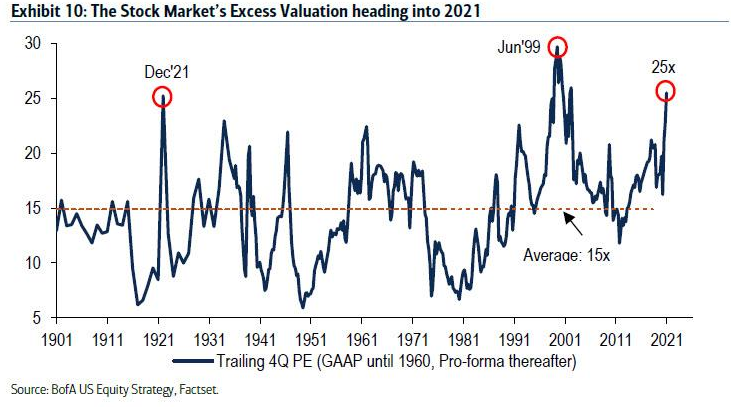
Figure 7 - Stock Market's Excess Valuation for 2021 (Source: BofA US Equity Strategy, Factset)
And why are investors throwing caution to the wind?
Well, believing that policy makers can solve any and all problems, valuation has become an afterthought. And when Jerome Powell – Chairman of the U.S. Federal Reserve – says that P/E multiples are “not as relevant” in a world of low interest rates, investors are happy to follow the bad advice.
In contrast, history shows that this attitude is foolhardy. Analyze the chart: outlandish valuations have never been sustainable. Furthermore, when the music stops, the drawdown is swift.
Ever heard the saying, ‘stairs up, elevator down?’
As a rebuttal, bulls will respond by telling you, “don’t fight the FED.” And while that mantra has worked over the last several years, it was underpinned by strong fundamentals and a rosy economic backdrop (neither of which exist today).
Please see the chart below:
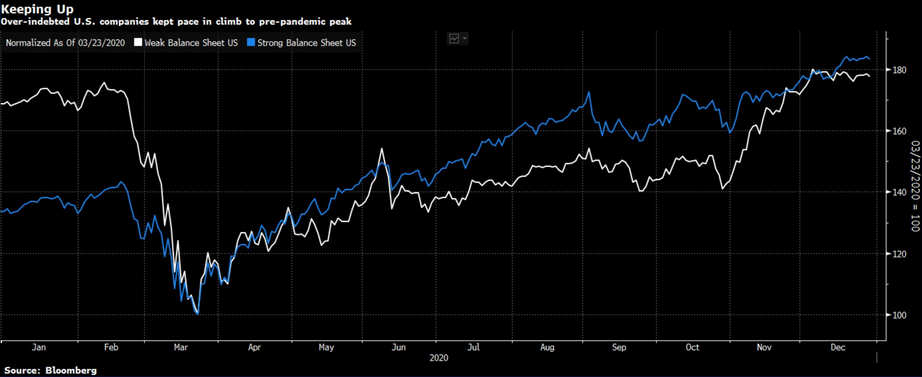
Figure 8 - Over-indebted "Zombie" Companies (Source: Bloomberg)
If you follow the white line, the number of zombie companies are now above their pre-pandemic highs. And as of Dec. 23, nearly one in five large U.S. companies are considered zombies. To explain the term, zombie companies are publicly-traded corporates that have so much debt on their balance sheets, they either can’t, or they earn just enough operating income to pay their interest expenses.
Essentially, if they couldn’t continue borrowing, they would declare bankruptcy.
On the flip side, 2020 has also seen the rich get richer … and then get even richer.
With breadth (the number of stocks participating in the rally) historically anemic, the five-largest companies in the S&P 500 – Facebook, Apple, Alphabet, Amazon and Microsoft – make up nearly 23% of the index (down slightly from a high of 25%).
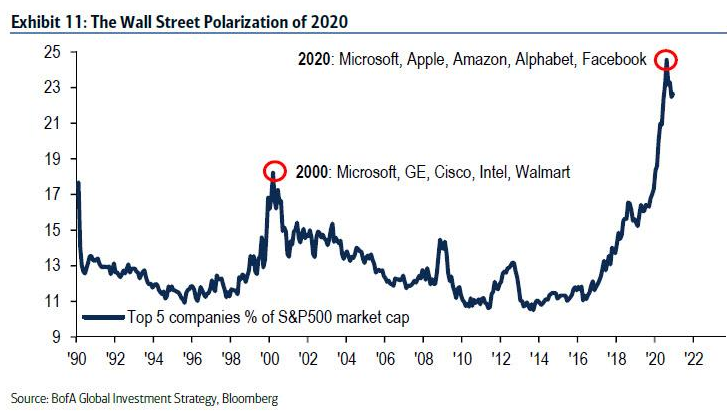
Figure 9 - Five Largest Companies' Percentage of S&P 500 (Source: BofA Global Investment Strategy, Bloomberg)
If you contrast this with the dot-com bubble, even in 2000, the five-largest stocks only accounted for ~19% of the index.
In conclusion, the U.S. equity market remains structurally impaired. Manic sentiment, overheating technicals, deteriorating fundamentals and extreme overconcentration are poised to make 2021 look like Cinderella’s ugly step-sister. And as the dominoes fall, the narrative surrounding equities, commodities and currencies will be vastly different.
So, remember, gravity is undefeated. And ‘what goes up must come down.’
Herd Mentality
Despite bearish sentiment putting the USD Index on its back foot, investor psychology remains the primary force.
Despite what the pundits believe, I noted yesterday that:
- The ECB’s total assets as a percentage of GDP are nearly double that of the U.S. FED.
- Eurozone economic fundamentals are deteriorating at a faster rate than the U.S.
So why do investors ignore this reality?
Well, just like fashion or pop culture, when a narrative becomes an obsession, facts, data and logic are ignored.
Case in point: Please see the chart below:
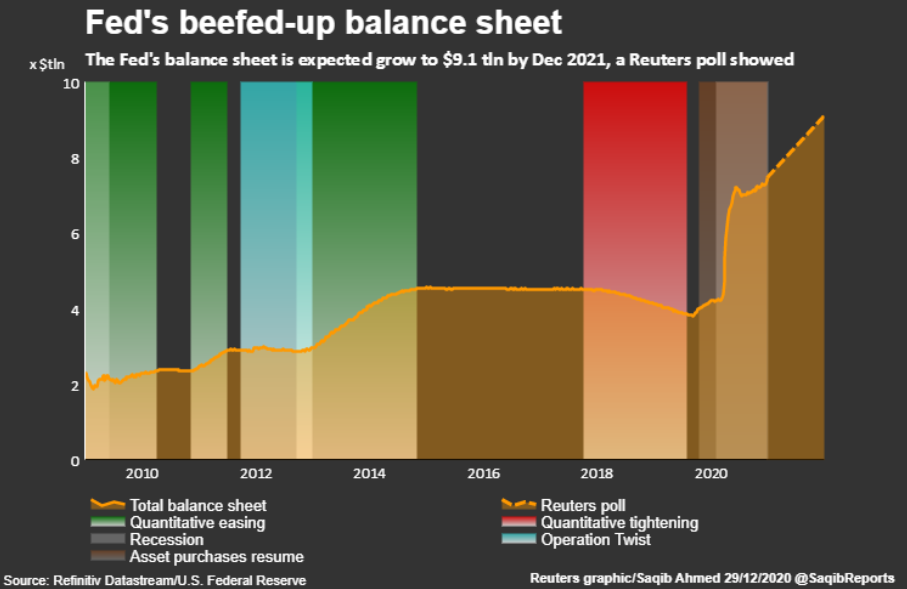
Figure 10 - U.S. Federal Reserve's Balance Sheet Growth Chart
Despite Powell saying earlier this month that buying more long-dated bonds is not “high on our list of possibilities,” Wednesday’s (Dec. 30) Reuters Poll shows economists expect that and more.
If you analyze the orange line (and the area shaded orange), it shows that economists expect the FED’s balance sheet to increase by $1.70 trillion by the end of 2021. However, when looking back at the last 10 years, ask yourself: does the FED’s balance sheet rise linearly?
As you can see, periods of expansion are followed by periods of consolidation. And while 2021 is likely to involve substantial asset purchases, this year’s vertical ascension is more of an outlier than a historical precedent.
The bottom line is: herd mentality causes investors to believe that the most-recent trend will continue into perpetuity. As a result, the U.S. dollar has become the sacrificial lamb. But once investors realize that the printing projections are likely too optimistic, the U.S. dollar should re-price (and rise) to reflect that reality.
Overview of the Upcoming Decline
- As far as the current overview of the upcoming decline is concerned, I think it has already begun.
- During the final part of the slide (which could end within the next 1-10 weeks or so), I expect silver to decline more than miners. That would align with how the markets initially reacted to the COVID-19 threat.
- The impact of all the new rounds of money printing in the U.S. and Europe on the precious metals prices is incredibly positive in the long run, which does not make the short-term decline improbable. Markets can and will get ahead of themselves and decline afterward – sometimes very profoundly – before continuing with their upward climb.
- The plan is to exit the current short positions in miners after they decline far and fast, but at the same time, silver drops just “significantly” (we expect this to happen in 1 – 5 weeks ). In other words, the decline in silver should be severe, but the decline in the miners should look “ridiculous”. That’s what we did in March when we bought practically right at the bottom . It is a soft, but simultaneously broad instruction, so additional confirmations are necessary.
- I expect this confirmation to come from gold, reaching about $1,700 - $1,750 . If – at the same time – gold moves to about $1,700 - $1,750 and miners are already after a ridiculously big drop (say, to $31 - $32 in the GDX ETF – or lower), we will probably exit the short positions in the miners and at the same time enter short positions in silver. However, it could also be the case that we’ll wait for a rebound before re-entering short position in silver – it’s too early to say at this time. It’s also possible that we’ll enter very quick long positions between those short positions.
- The precious metals market's final bottom is likely to take shape when gold shows significant strength relative to the USD Index . It could take the form of a gold’s rally or a bullish reversal, despite the ongoing USD Index rally.
Summary
With silver being almost right at its triangle-vertex-based turning point and given the tendency for the markets to reverse at the end of the year (gold) and month (USDX), it seems that the decline in PMs could start shortly.
The divergent price action signals that the next move lower in the precious metals market is already underway. It will likely take another 1-10 weeks to play out (or perhaps even longer), with gold falling to or below $1,700 and with a substantial decline in silver (downside target is unclear) and miners ($1,700 in gold is likely to correspond to about $31 in GDX).
Remember, the recent upswing is a relatively normal bounce within a bigger decline. And after last week’s drawdown, this corrective upswing might have already ended.
Despite a recent decline, it seems that the USD Index is going to move higher in the following months and weeks, in turn causing gold to decline. At some point gold is likely to stop responding to dollar’s bearish indications, and based on the above analysis, it seems that this is already taking place.
Naturally, everyone's trading is their responsibility. But in our opinion, if there ever was a time to either enter a short position in the miners or increase its size if it was not already sizable, it's now. We made money on the March decline, and on the March rebound, with another massive slide already underway.
After the sell-off (that takes gold to about$1,700 or lower), we expect the precious metals to rally significantly. The final decline might take as little as 1-5 weeks, so it's important to stay alert to any changes.
Most importantly, please stay healthy and safe. We made a lot of money on the March decline and the subsequent rebound (its initial part) price moves (and we'll likely earn much more in the following weeks and months), but you have to be healthy to enjoy the results.
As always, we'll keep you - our subscribers - informed.
To summarize:
Trading capital (supplementary part of the portfolio; our opinion): Full speculative short positions (300% of the full position) in mining stocks is justified from the risk to reward point of view with the following binding exit profit-take price levels:
Senior mining stocks (price levels for the GDX ETF): binding profit-take exit price: $32.02; stop-loss: none (the volatility is too big to justify a SL order in case of this particular trade); binding profit-take level for the DUST ETF: $28.73; stop-loss for the DUST ETF: none (the volatility is too big to justify a SL order in case of this particular trade)
Junior mining stocks (price levels for the GDXJ ETF): binding profit-take exit price: $42.72; stop-loss: none (the volatility is too big to justify a SL order in case of this particular trade); binding profit-take level for the JDST ETF: $21.22; stop-loss for the JDST ETF: none (the volatility is too big to justify a SL order in case of this particular trade)
For-your-information targets (our opinion; we continue to think that mining stocks are the preferred way of taking advantage of the upcoming price move, but if for whatever reason one wants / has to use silver or gold for this trade, we are providing the details anyway. In our view, silver has greater potential than gold does):
Silver futures downside profit-take exit price: unclear at this time - initially, it might be a good idea to exit, when gold moves to $1,703.
Gold futures downside profit-take exit price: $1,703
Long-term capital (core part of the portfolio; our opinion): No positions (in other words: cash
Insurance capital (core part of the portfolio; our opinion): Full position
Whether you already subscribed or not, we encourage you to find out how to make the most of our alerts and read our replies to the most common alert-and-gold-trading-related-questions.
Please note that we describe the situation for the day that the alert is posted in the trading section. In other words, if we are writing about a speculative position, it means that it is up-to-date on the day it was posted. We are also featuring the initial target prices to decide whether keeping a position on a given day is in tune with your approach (some moves are too small for medium-term traders, and some might appear too big for day-traders).
Additionally, you might want to read why our stop-loss orders are usually relatively far from the current price.
Please note that a full position doesn't mean using all of the capital for a given trade. You will find details on our thoughts on gold portfolio structuring in the Key Insights section on our website.
As a reminder - "initial target price" means exactly that - an "initial" one. It's not a price level at which we suggest closing positions. If this becomes the case (like it did in the previous trade), we will refer to these levels as levels of exit orders (exactly as we've done previously). Stop-loss levels, however, are naturally not "initial", but something that, in our opinion, might be entered as an order.
Since it is impossible to synchronize target prices and stop-loss levels for all the ETFs and ETNs with the main markets that we provide these levels for (gold, silver and mining stocks - the GDX ETF), the stop-loss levels and target prices for other ETNs and ETF (among other: UGL, GLL, AGQ, ZSL, NUGT, DUST, JNUG, JDST) are provided as supplementary, and not as "final". This means that if a stop-loss or a target level is reached for any of the "additional instruments" (GLL for instance), but not for the "main instrument" (gold in this case), we will view positions in both gold and GLL as still open and the stop-loss for GLL would have to be moved lower. On the other hand, if gold moves to a stop-loss level but GLL doesn't, then we will view both positions (in gold and GLL) as closed. In other words, since it's not possible to be 100% certain that each related instrument moves to a given level when the underlying instrument does, we can't provide levels that would be binding. The levels that we do provide are our best estimate of the levels that will correspond to the levels in the underlying assets, but it will be the underlying assets that one will need to focus on regarding the signs pointing to closing a given position or keeping it open. We might adjust the levels in the "additional instruments" without adjusting the levels in the "main instruments", which will simply mean that we have improved our estimation of these levels, not that we changed our outlook on the markets. We are already working on a tool that would update these levels daily for the most popular ETFs, ETNs and individual mining stocks.
Our preferred ways to invest in and to trade gold along with the reasoning can be found in the how to buy gold section. Furthermore, our preferred ETFs and ETNs can be found in our Gold & Silver ETF Ranking.
As a reminder, Gold & Silver Trading Alerts are posted before or on each trading day (we usually post them before the opening bell, but we don't promise doing that each day). If there's anything urgent, we will send you an additional small alert before posting the main one.

Thank you for being with us in 2020. On behalf of the entire Sunshine Profits Team, I wish you all the best in the New Year.
Przemyslaw Radomski, CFA
Founder, Editor-in-chief

