

Briefly: in our opinion, full (200% of the regular size of the position) speculative short positions in gold, silver and mining stocks are justified from the risk/reward perspective at the moment of publishing this alert.
Last week ended with a specific twist – the USD Index took a dive, while the Japanese yen, gold, silver, and mining stocks all moved visibly higher. The reversal right before the end of the week appears to be a very bullish phenomenon for the PMs, but is it really one?
We doubt it, and if it is, then the rally is likely almost over. In other words, it doesn’t seem to be anything that one should be concerned with. Let’s take a look why, starting with the Japanese yen, as that’s currently the most interesting (from the PM investors' point of view) part of the USD Index (chart courtesy of http://stockcharts.com).
Yen Verification
In Friday’s Gold & Silver Trading Alert, we wrote the following on the situation in the Japanese currency:
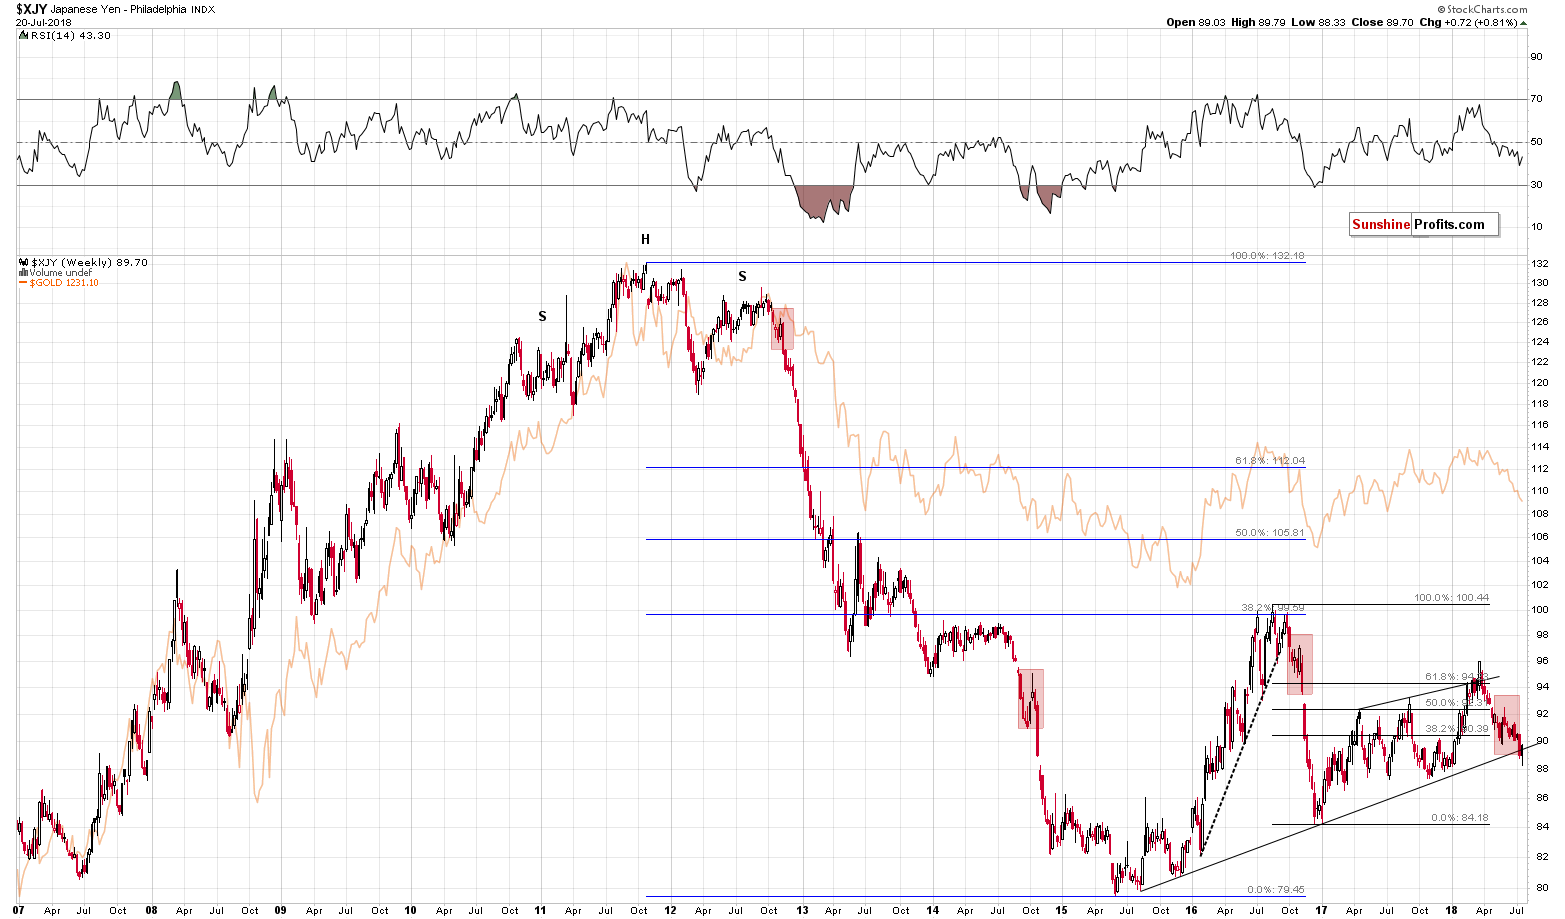
The Japanese yen (USD/JPY) has recently broken below a key long-term support line and its now verifying this breakdown. Consequently, the currency could move higher in the very short term, but the rising long-term support/resistance line marks the likely end of the decline.
Why is an invalidation unlikely? Because of the similarity of the preceding action to the three cases from the past few years – they were all followed by sharp declines without meaningful upswings beforehand. We marked them with red rectangles.
When using charts based on the logarithmic scale (as the one above), the mentioned long-term support/resistance line is at about 89.5.
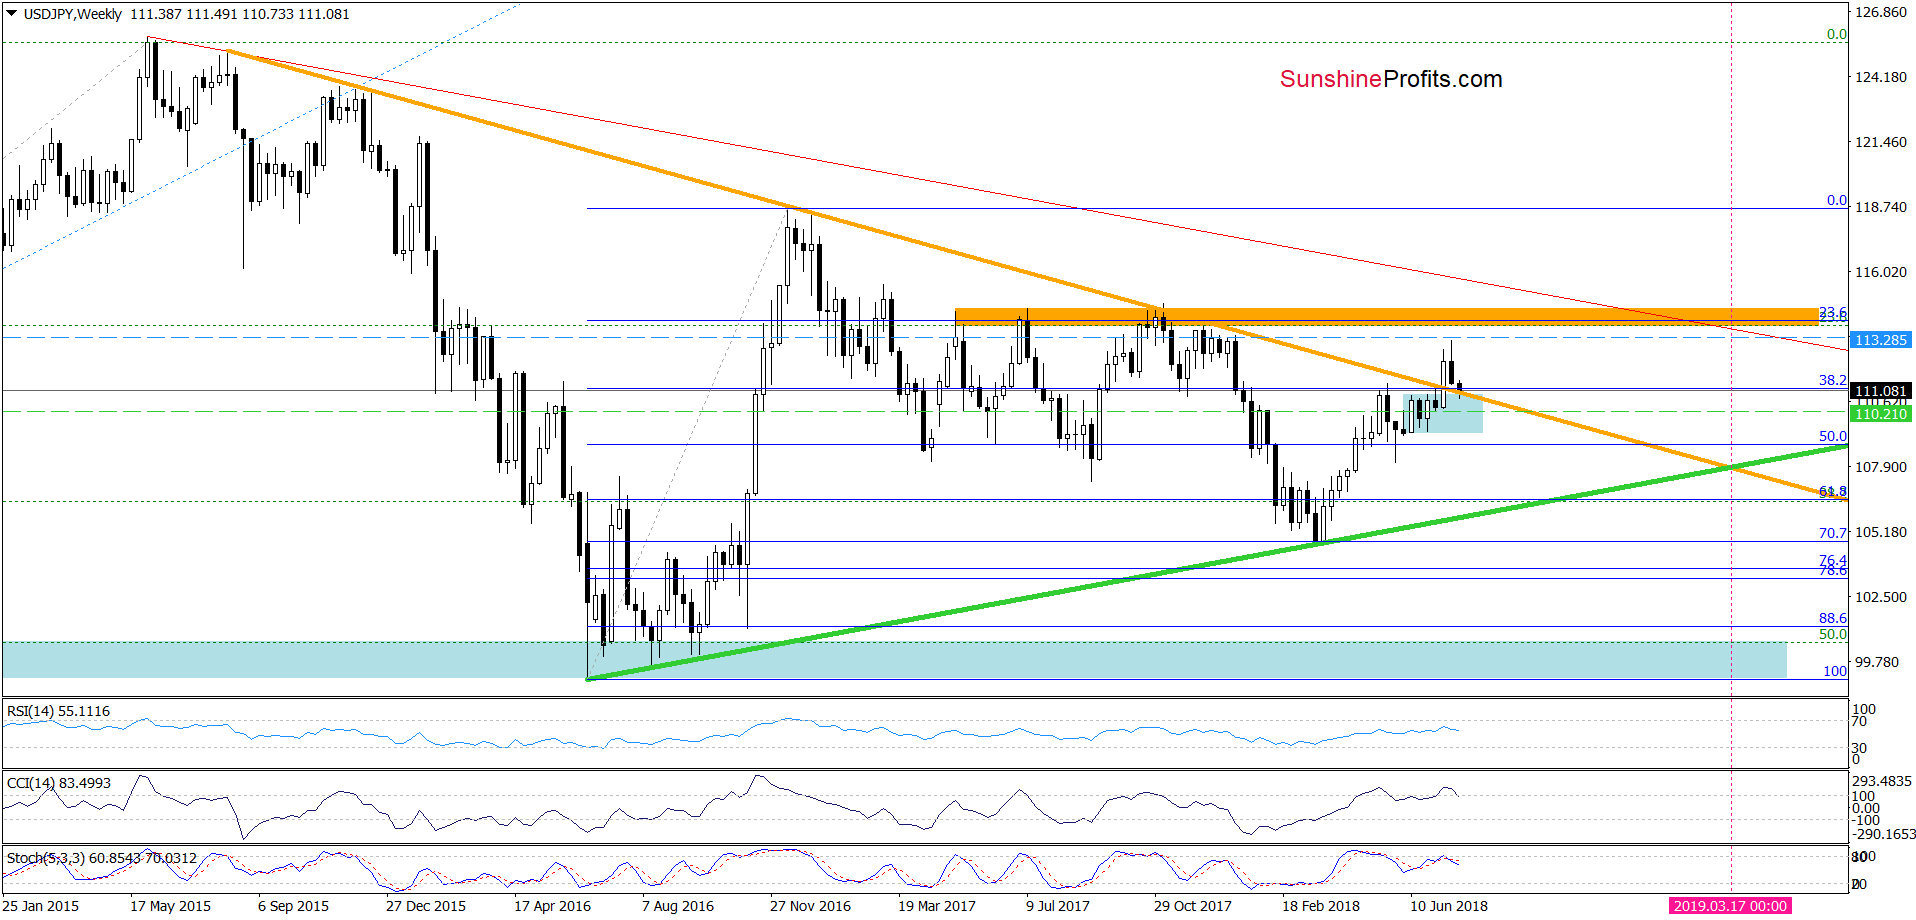
But, when using the linear scale, this line (marked with orange) is still relatively far. We could see a bit more than a repeat of yesterday’s intraday action before the correction is over.
By the way, the above chart is inverted, because it features the same currency exchange rate from the other perspective (JPY/USD, while the previous chart featured USD/JPY). We are generally using USD/JPY in the Gold & Silver Trading Alerts, because it’s easier to compare the currency’s price with the one of gold if they move in the same direction; and we are using the USD/JPY pair in our Forex Trading Alerts as that’s how this currency exchange rate is usually traded on its own.
So, on average, we might – at best – expect another daily move that’s a bit bigger than what we saw yesterday. It may be a lot in the case of short-term oriented forex trades, but when discussing the possible impact on the precious metals sector, it doesn’t seem that significant, because of all the other factors that point to much lower PM prices in the following weeks and months.
In the previous Alerts, we emphasized that based on the proximity to the apex of the triangle, we might see a short-term reversal and that it’s unlikely to be a big deal. So far, we’re seeing exactly that.
In short, that’s exactly what happened. The Japanese yen indeed moved higher, but the rally was stopped by the rising long-term support/resistance line. To be precise: the line on the logarithmic chart was insignificantly broken, while the one based on the linear scale was not touched on Friday and we saw a small move below it today (the most recent candlestick on the above chart is this week), which was invalidated. Therefore, it doesn’t seem that the outlook changed. Conversely, it seems that one of the most common post-breakdown patterns took place and since there was no clear invalidation, the outlook remains bearish. Moreover, it seems that the rally in the Japanese yen is over or very close to being over.
This means that the medium-term implications for the precious metals market are as bearish as they were previously, but the short-term implications are more bearish than they were before.
Keeping the above in mind, let’s take a look at Friday’s action in gold, silver and mining stocks.
Gold’s Clear Reversal
On Friday, we wrote the following:
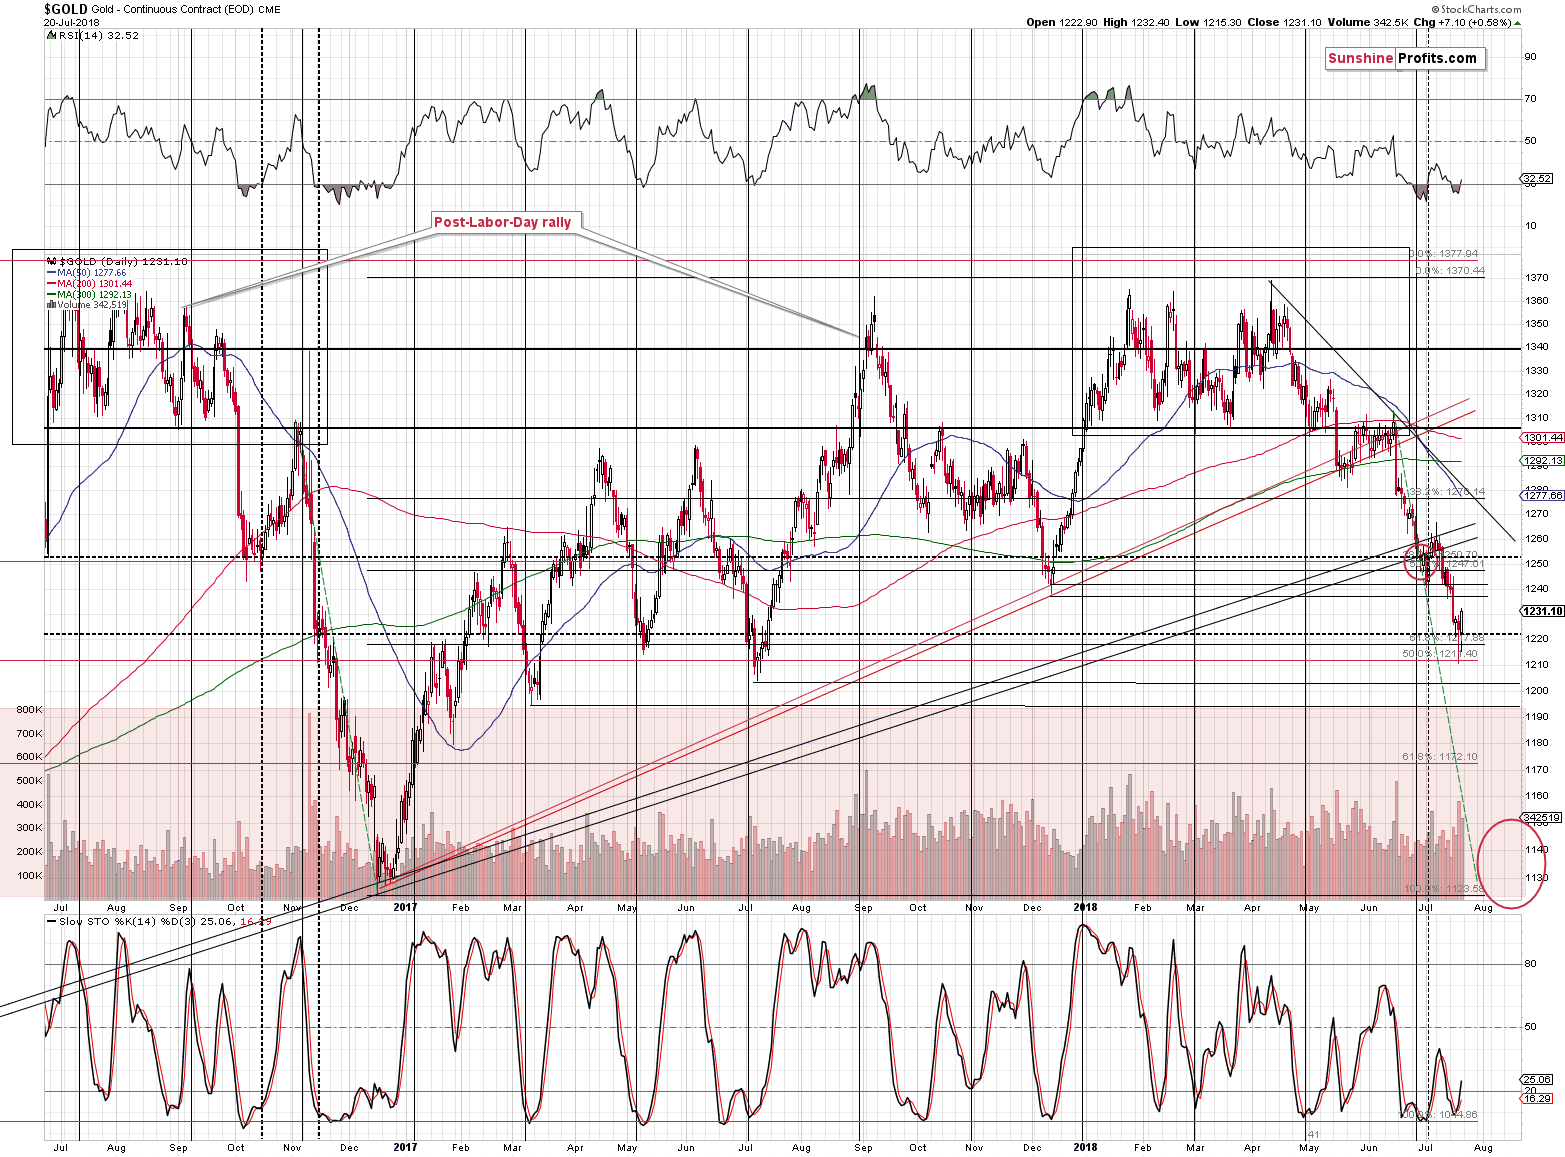
Gold reversed on significant volume after moving temporarily to two Fibonacci retracements and the May and July 2017 lows. That’s a classic buy signal.
Let’s assume, for a minute, that we’re going to get a rally from here. How high would it be likely to take gold? If the yen might – at most – move by as much as it did yesterday on an intraday basis and then a bit more, then perhaps we might see something similar in gold.
Given the nearby resistance levels, this means that gold could simply move back to the early July 2018 bottom or the December 2017 bottom – to about $1,240. A bit more above this level if we focus on the analogy to the yen, and a bit less if we consider the fact that during the previous (early July) corrective upswing the initial rally (which took place on July 3rd) was actually most of the entire corrective upswing in gold.
Is a $15 upswing really worth taking the risk of missing out on profits from a huge slide in prices (below $1,200, perhaps even to $1,130)? No. That’s why we’ll stick to the current short position despite the classic buy signal. This is a technical blasphemy, but taking the bigger picture into account, it seems to be a justified one.
The yen moved to its very short-term target and gold wasn’t even able to use this bullish factor and rally in a similar way. Gold managed to move a mere $7 higher, less than half of what it could have easily gained given the action in the Japanese yen. If this had been a turning point for gold and the beginning of a major rally, gold should have rallied strongly, and miners should have soared. Nothing like that happened. Conversely, gold rallied insignificantly, while the miners’ performance was disappointing.
There’s more to the above chart than just that. The factor that’s been in place for many weeks (remaining below most investors’ radars) is the similarity to what happened in the second half of 2016. The similarity begins with the areas that we marked with black rectangles – several tops that are followed by an initial breakdown and a move back to the previous lows. There is also a correction from about $1,250 in both cases. During the 2016 rally it was the same move that started from $1,250 and took gold back to the previous lows and during the most recent decline, these were separate corrections.
The remarkable similarity is that both rallies from $1,250 started when the RSI first moved below 30. Gold corrected in both cases, and in both cases, it was not the end of the decline. Once gold moved below the initial (October 2016, early July 2018) bottom it continued lower to about $1,220 and then moved a bit higher. In both cases the RSI moved a bit higher and stayed close to the 30 level. Many investors thought that the RSI close to 30 was a buy signal back then and many people are incorrectly (it’s not the case during medium-term downtrends) assuming that now.
Since the self-similar pattern in gold has been in place for so long, one can expect it to continue at least in the near term. What does it tell us? That one should prepare for numerous fake reversals that will be followed by declines. That’s exactly what we saw in November and December 2016 until gold’s slide below $1,130. If the pace of decline is similar this time, we might see gold at this level in a month or so. But, if the USD Index soars as the Japanese yen slides (which seems quite likely), gold may slide in a more decisive manner.
Long story short, the implications of the above gold’s chart are bearish.
Mining Stocks’ Weakness
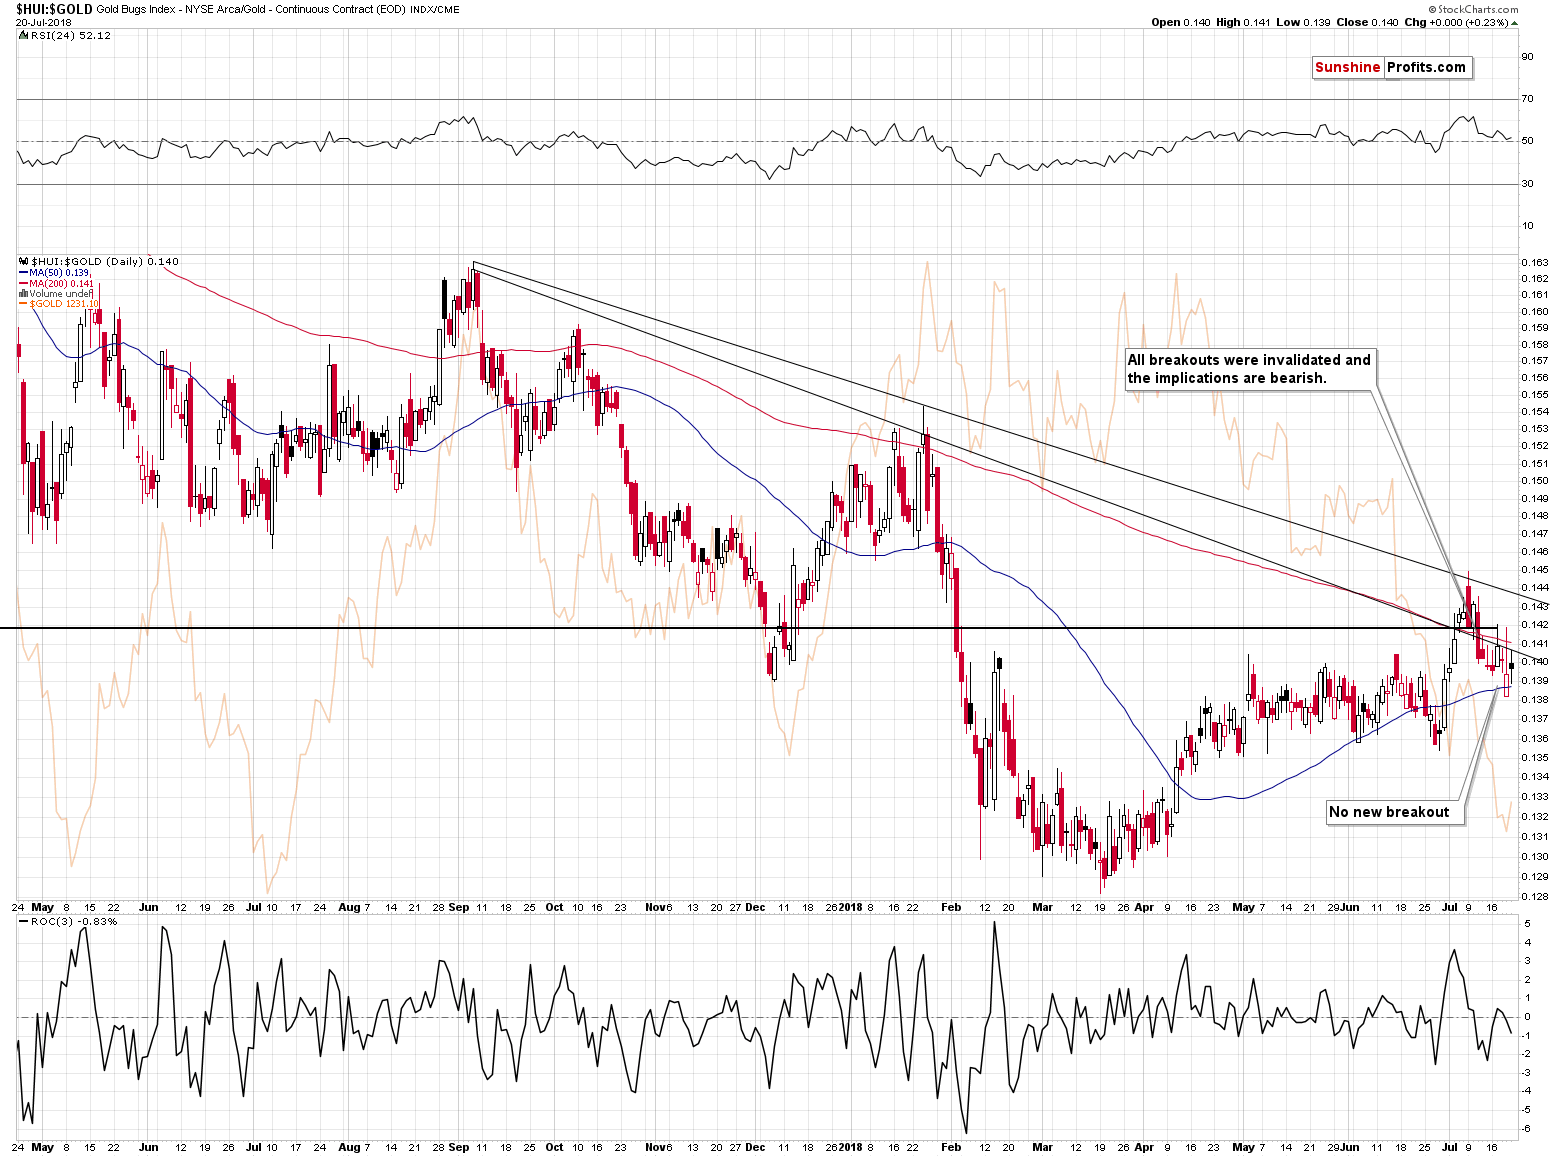
In Friday’s Alert, we wrote that strong performance of mining stocks is not likely to be seen due to the situation in their ratio to gold and this remains to be the case. The ratio moved back below the previous resistance levels, invalidating all temporary breakouts. This has bearish, not bullish implications and it seems that we already saw the results last week.
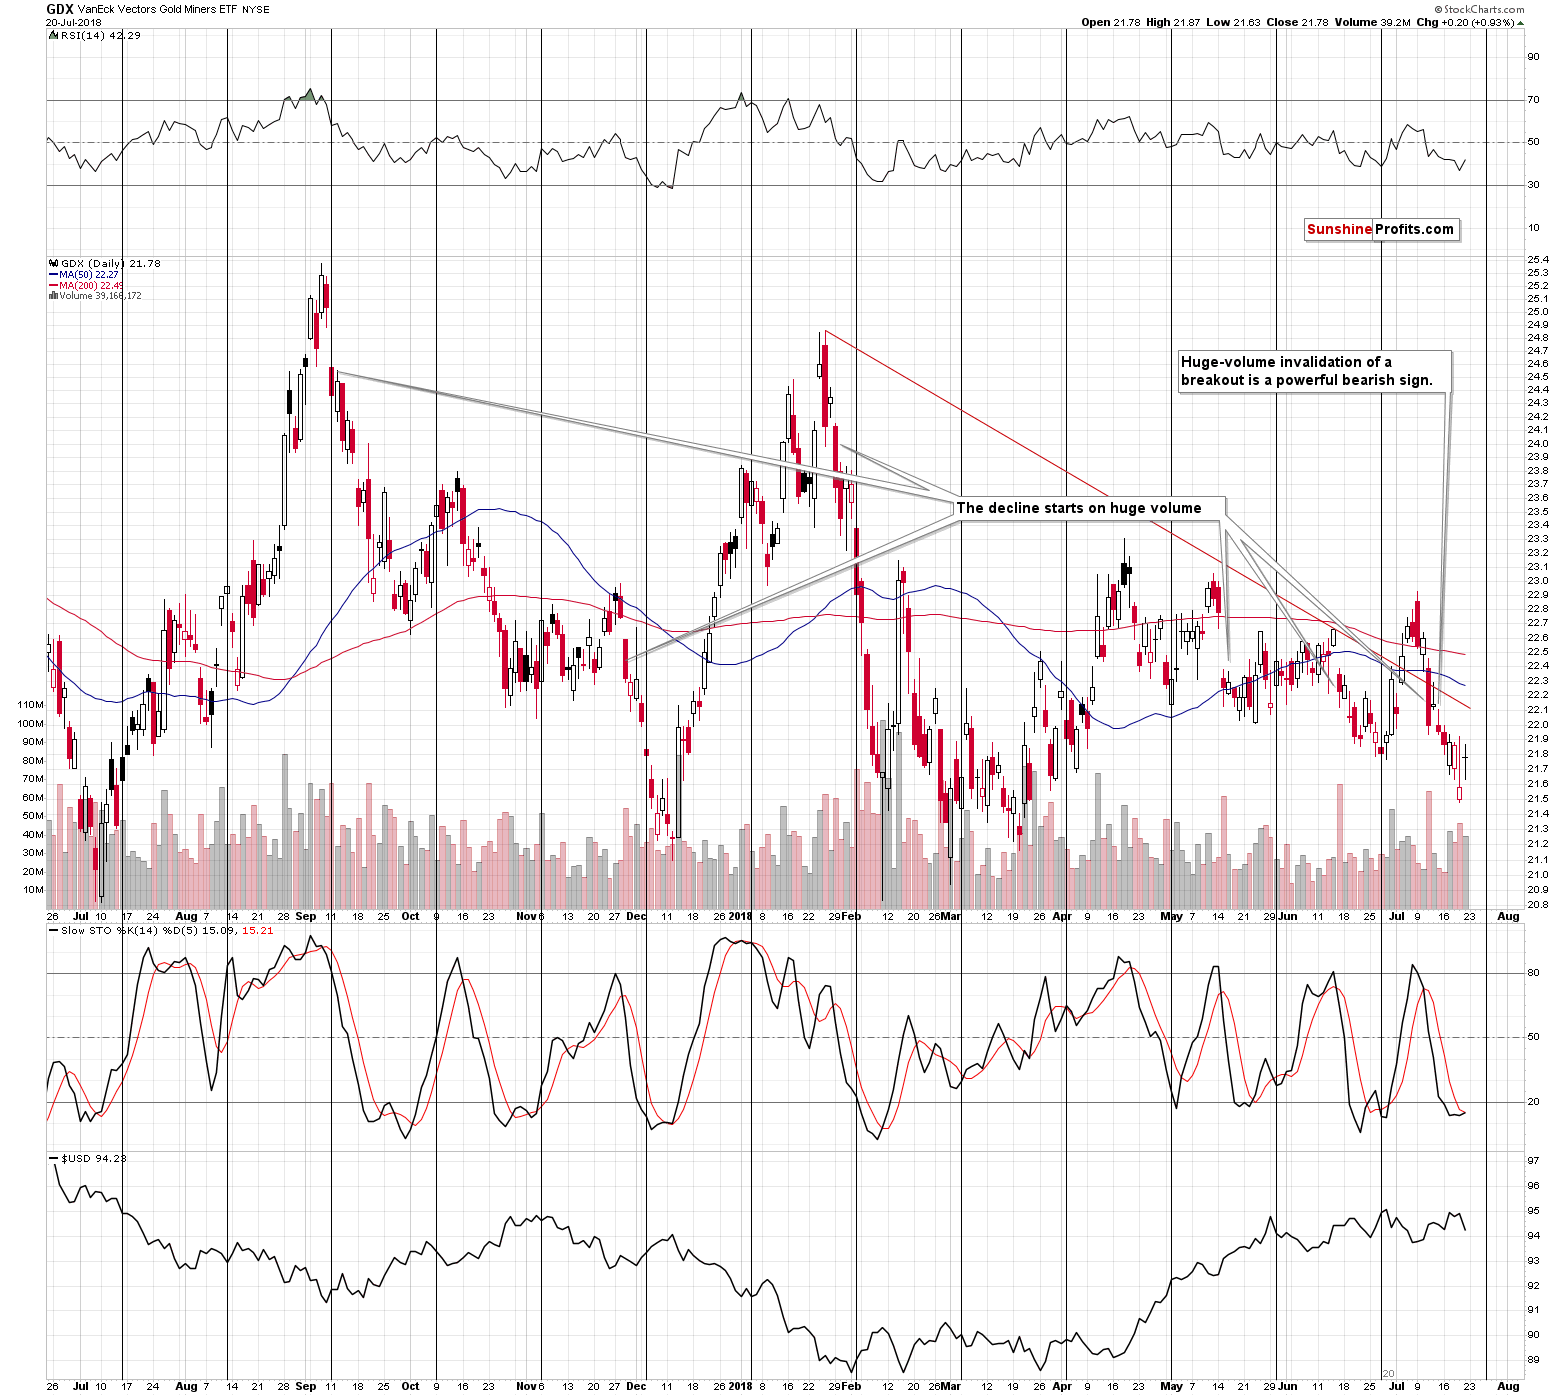
Miners moved higher on Friday, but they did so on volume that was lower than what we had seen during Thursday’s decline. That’s the less important bearish sign. The more important bearish sign is that – unlike gold – miners were unable to erase Thursday’s decline in terms of the daily closing prices. In other words, taking the last two trading days into account, miners are still down, while gold is up. That’s bearish, not bullish.
Also, let’s keep in mind the way in which miners performed on Thursday:
Miners declined along with gold and then they moved higher along with it – even moving above the previous day’s closing price. And just as most traders thought that the outlook for the PMs reversed… It all changed. Gold declined a few dollars and mining stocks gave up most of the entire intraday upswing. It looked as if the buyers run out of capital or simply gave up, giving in to the overwhelming power of the sellers.
The last two days, therefore, has bearish implications, not bullish ones.
But silver invalidated the breakdown below the 2017 low!
Silver’s Invalidation and Verification
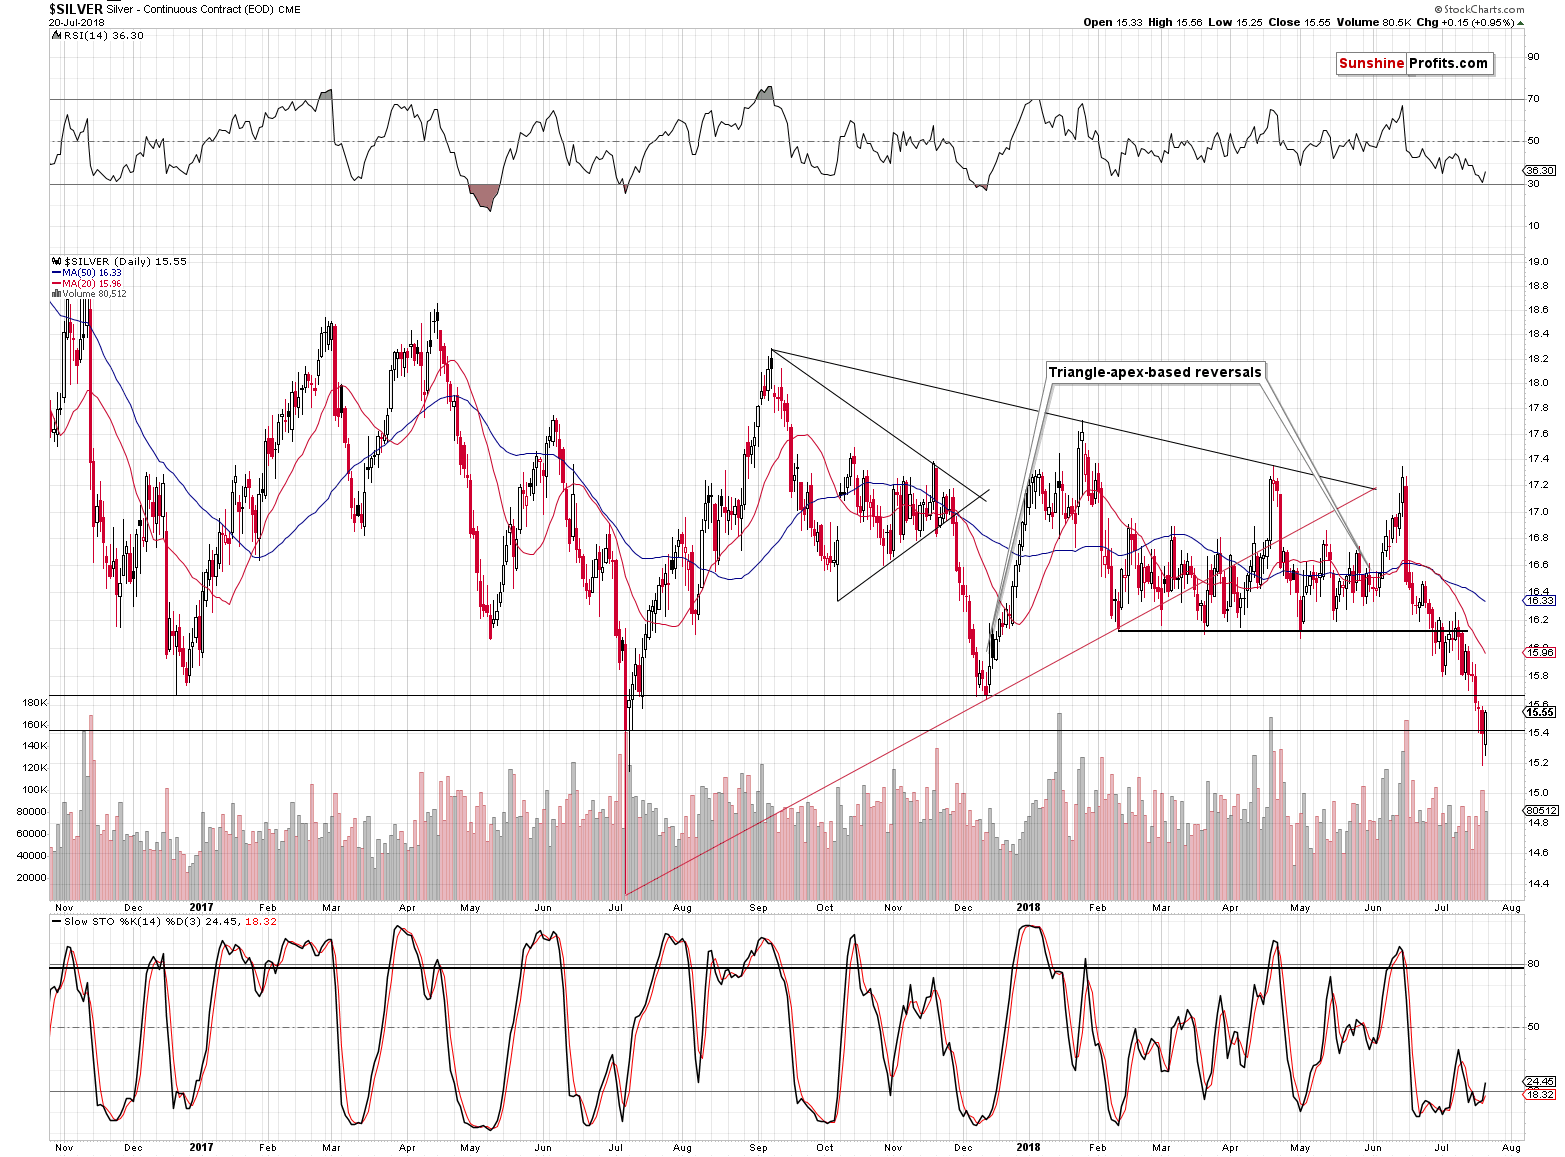
It did. But at the same time, it confirmed (by a weekly close) the breakdown below the December 2016 and December 2017 bottoms, so we have one bullish sign related to the breakdowns and two bearish ones.
Let’s discuss the bullish one, though. The USD Index declined by 0.72, which was a huge daily move and thus silver was practically forced to move higher. A sizable daily decline in the USDX should have triggered a quite big comeback in gold and silver given that they are already after a sizable rally. But silver moved higher by a mere 15 cents. That’s a weak move, not a strong one and the volume that accompanied the “comeback” seems to confirm it – it was lower than what had accompanied silver’s decline on Thursday.
Overall, we don’t think that the outlook for silver improved.
Platinum’s Breakdown
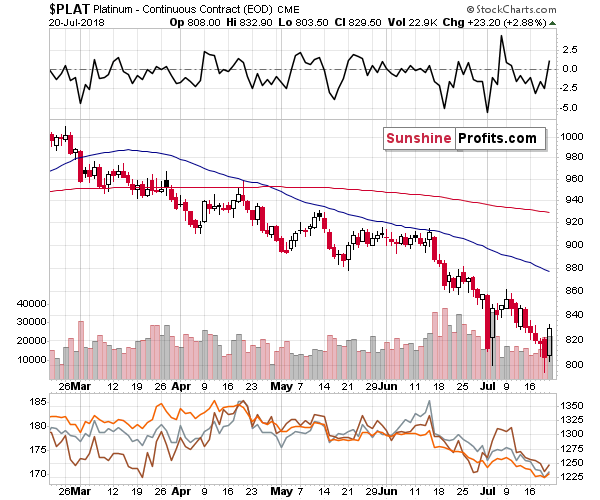
In Friday’s Alert, we commented on the breakdown in platinum in the following way:
When platinum plunged more than two weeks ago, it did so on significant volume and based on geopolitical news (we commented on it extensively in the July 3rd Alert) it looked very unstable and a corrective rally was extremely likely. And we saw it. But the rally that was likely to happen based on it has already taken place and platinum returned to its medium-term downtrend.
During yesterday’s session it moved (and closed) below the previous lows. This time, it was rather quiet – the volume was average and there was no direct news that would cause the decline. This makes us think that this time the breakdown will be successful. Naturally, we would prefer to wait for additional two daily closes below the previous lows and a weekly close, but the mentioned circumstances make a confirmation of the breakdown quite likely.
A slide in platinum – and one would likely follow a confirmation of the breakdown’s – is likely to translate into declines in the rest of the precious metals sector.
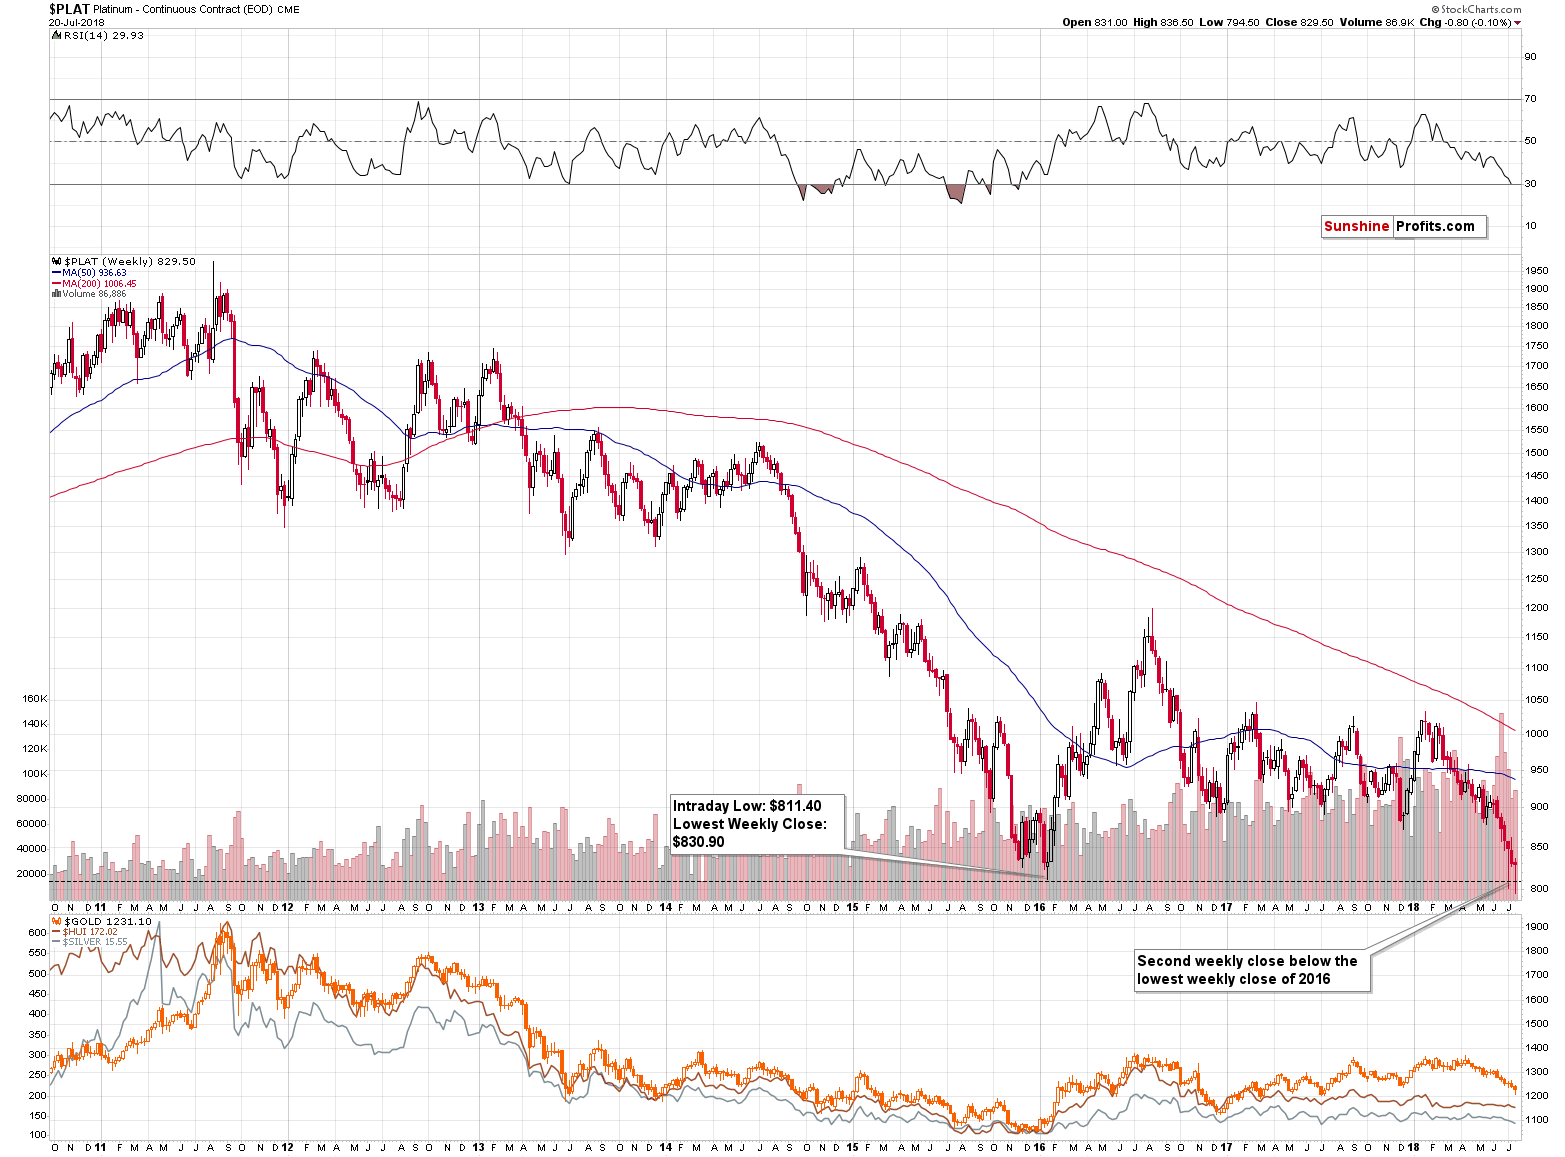
Since platinum moved back up on Friday, you might be wondering, if this changed the outlook for the less popular white precious metal.
In short, the outlook improved, but remains bearish anyway. Friday’s comeback was less profound than the early-July one and – most importantly – it didn’t cause platinum to invalidate the breakdown in terms of the weekly closing prices. In other words, platinum just closed below the previously lowest weekly close of 2016 for the second week in a row.
So, while on a short-term basis, we saw a reversal, from the bigger point of view, we are seeing a verification of the breakdown.
In early July the implications of platinum’s reversal for the rest of the precious metals sector were bullish, but it’s not the case this time.
Summary
Summing up, the outlook for the precious metals is extremely bearish for the following weeks and months, and it’s not bullish enough for the short term to justify adjusting the current short positions.
The extra-large short positions in gold, silver, and mining stocks are definitely justified from the risk to reward point of view. It’s likely that the profits on the short position that we opened only several days ago will increase much more before this trade is over, even if they correct temporarily first. There are signs that the small corrective upswing is already over, though.
As always, we will keep you – our subscribers – informed.
To summarize:
Trading capital (supplementary part of the portfolio; our opinion): Full short positions (200% of the full position) in gold, silver and mining stocks are justified from the risk/reward perspective with the following stop-loss orders and initial target price levels:
- Gold: initial target price: $1,142; stop-loss: $1,272; initial target price for the DGLD ETN: $63.96; stop-loss for the DGLD ETN $46.38
- Silver: initial target price: $14.42; stop-loss: $16.46; initial target price for the DSLV ETN: $32.97; stop-loss for the DSLV ETN $24.07
- Mining stocks (price levels for the GDX ETF): initial target price: $19.12; stop-loss: $23.64; initial target price for the DUST ETF: $37.97; stop-loss for the DUST ETF $20.87
In case one wants to bet on junior mining stocks’ prices (we do not suggest doing so – we think senior mining stocks are more predictable in the case of short-term trades – if one wants to do it anyway, we provide the details), here are the stop-loss details and initial target prices:
- GDXJ ETF: initial target price: $28.10; stop-loss: $34.82
- JDST ETF: initial target price: $74.83 stop-loss: $42.78
Long-term capital (core part of the portfolio; our opinion): No positions (in other words: cash)
Insurance capital (core part of the portfolio; our opinion): Full position
Important Details for New Subscribers
Whether you already subscribed or not, we encourage you to find out how to make the most of our alerts and read our replies to the most common alert-and-gold-trading-related-questions.
Please note that the in the trading section we describe the situation for the day that the alert is posted. In other words, it we are writing about a speculative position, it means that it is up-to-date on the day it was posted. We are also featuring the initial target prices, so that you can decide whether keeping a position on a given day is something that is in tune with your approach (some moves are too small for medium-term traders and some might appear too big for day-traders).
Plus, you might want to read why our stop-loss orders are usually relatively far from the current price.
Please note that a full position doesn’t mean using all of the capital for a given trade. You will find details on our thoughts on gold portfolio structuring in the Key Insights section on our website.
As a reminder – “initial target price” means exactly that – an “initial” one, it’s not a price level at which we suggest closing positions. If this becomes the case (like it did in the previous trade) we will refer to these levels as levels of exit orders (exactly as we’ve done previously). Stop-loss levels, however, are naturally not “initial”, but something that, in our opinion, might be entered as an order.
Since it is impossible to synchronize target prices and stop-loss levels for all the ETFs and ETNs with the main markets that we provide these levels for (gold, silver and mining stocks – the GDX ETF), the stop-loss levels and target prices for other ETNs and ETF (among other: UGLD, DGLD, USLV, DSLV, NUGT, DUST, JNUG, JDST) are provided as supplementary, and not as “final”. This means that if a stop-loss or a target level is reached for any of the “additional instruments” (DGLD for instance), but not for the “main instrument” (gold in this case), we will view positions in both gold and DGLD as still open and the stop-loss for DGLD would have to be moved lower. On the other hand, if gold moves to a stop-loss level but DGLD doesn’t, then we will view both positions (in gold and DGLD) as closed. In other words, since it’s not possible to be 100% certain that each related instrument moves to a given level when the underlying instrument does, we can’t provide levels that would be binding. The levels that we do provide are our best estimate of the levels that will correspond to the levels in the underlying assets, but it will be the underlying assets that one will need to focus on regarding the signs pointing to closing a given position or keeping it open. We might adjust the levels in the “additional instruments” without adjusting the levels in the “main instruments”, which will simply mean that we have improved our estimation of these levels, not that we changed our outlook on the markets. We are already working on a tool that would update these levels on a daily basis for the most popular ETFs, ETNs and individual mining stocks.
Our preferred ways to invest in and to trade gold along with the reasoning can be found in the how to buy gold section. Additionally, our preferred ETFs and ETNs can be found in our Gold & Silver ETF Ranking.
As a reminder, Gold & Silver Trading Alerts are posted before or on each trading day (we usually post them before the opening bell, but we don't promise doing that each day). If there's anything urgent, we will send you an additional small alert before posting the main one.
=====
Hand-picked precious-metals-related links:
PRECIOUS-Gold slips towards one-year lows as dollar revives
=====
In other news:
Stocks Slip as Investors Mull Growth; Yen Climbs: Markets Wrap
Japan starts speculating: Which route of stimulus-reduction will BOJ take?
Italy's League Pushes for Challenge to EU Budget Rules
Bitcoin Hits 2-Month High as G20 Ministers See No Urgency to Further Regulate Cryptocurrencies
Oil higher on Middle East, North Sea supply worries
=====
Thank you.
Sincerely,
Przemyslaw Radomski, CFA
Founder, Editor-in-chief, Gold & Silver Fund Manager
Gold & Silver Trading Alerts
Forex Trading Alerts
Oil Investment Updates
Oil Trading Alerts

