

Briefly: At the moment of publishing this Alert, in our opinion, full (200% of the regular position size) speculative short positions in mining stocks are justified from the risk/reward point of view. We are decreasing the size of the current position, based on the USDX action, but we expect this to be temporary.
In yesterday's analysis, we've indicated two key short-term factors for the precious metals market outlook, and we'll begin today's analysis with a follow-up to their (USDX and GDX) analysis. Subsequently, we'll move to two critical details from the forex market that can tell us what the USD Index - on its own - can't achieve.
Yesterday, we made a few comments regarding the mining stocks:
(...) the second thing that we previously wrote about, was the triangle-vertex-based reversal in the mining stocks. Based on the daily chart, it appeared that the reversal should have already taken place, but if we zoom in and look at the GDX ETF in terms of the 4-hour candlesticks, it becomes obvious that the reversal point based on this technique wasn't really scheduled for Monday, but - actually - for Tuesday.
And indeed, that's when the GDX ETF formed the intraday high. The implications are bearish, and the same goes for the fact that miners moved back below the early-September high shortly after trying to rally above it.
During yesterday's session, GDX moved higher initially (not above Tuesday's high), but then declined before the end of the day, practically repeating Tuesday's performance.
So, what exactly happened yesterday?
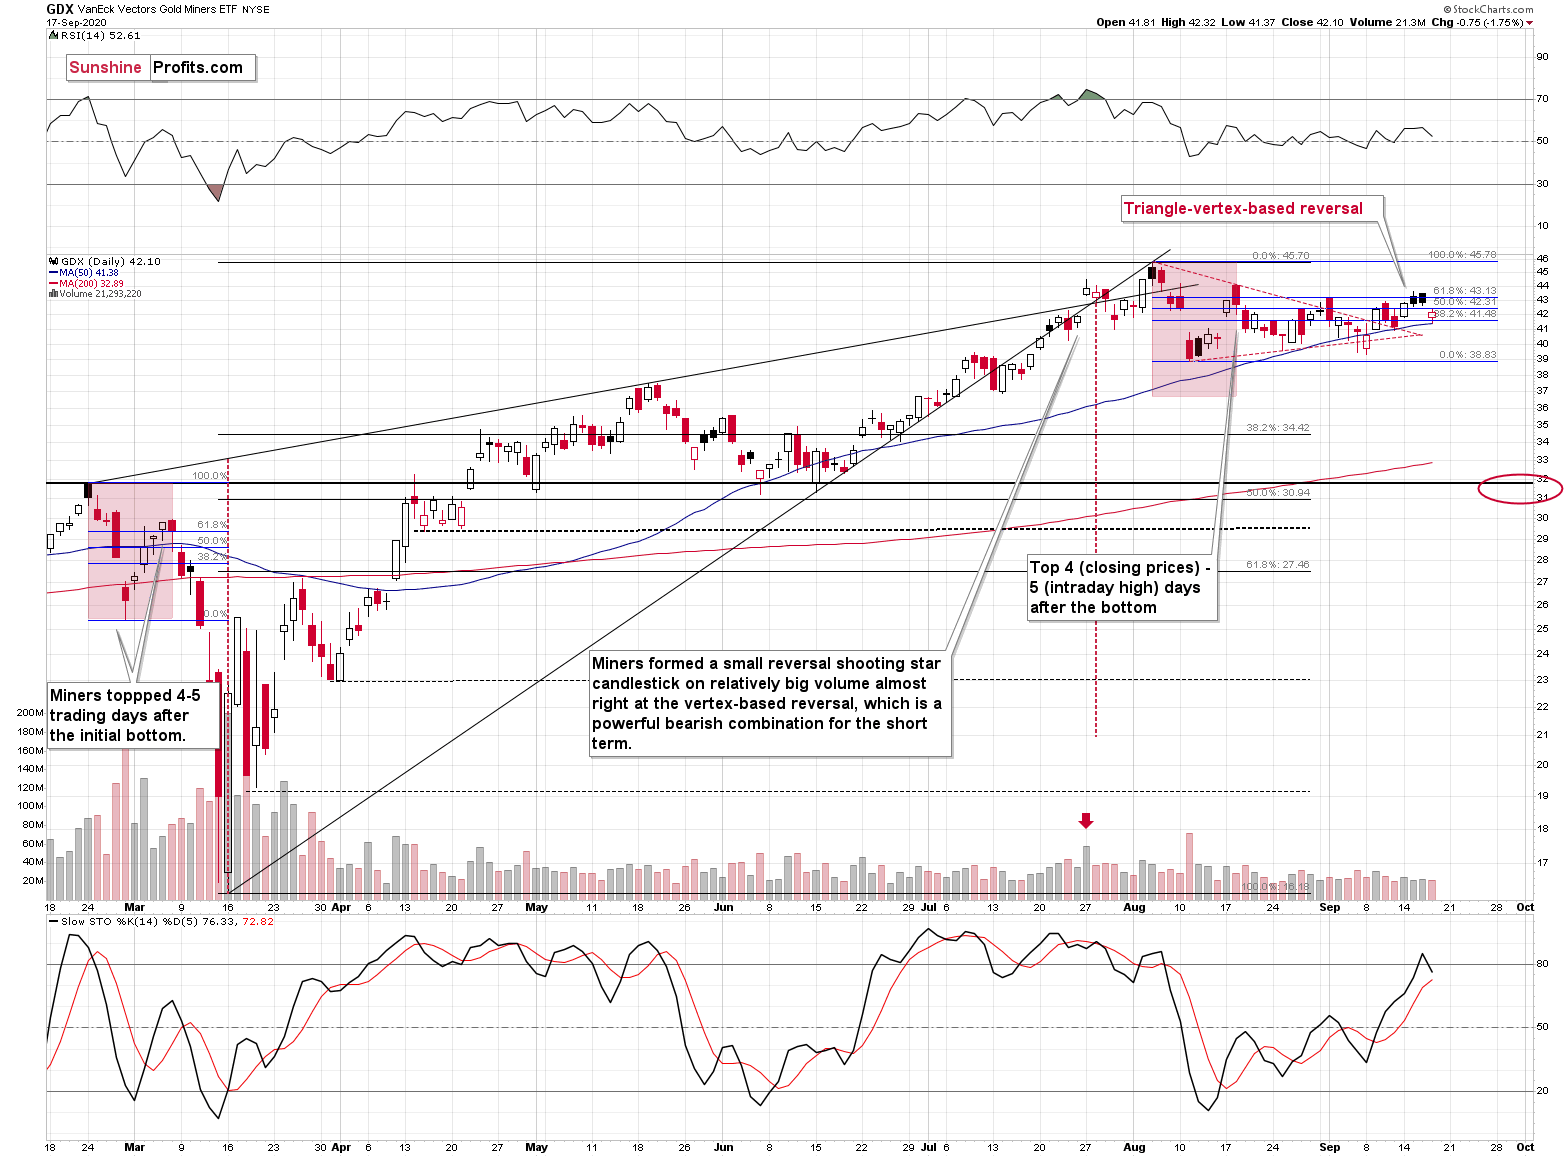
Miners declined, just like they were inclined to.
This decline is not yet something to call home about, but it's an excellent start and another confirmation of the advantages of triangle-vertex-based reversal technique. Based on the chart above, the outlook for the miners remains bearish.
In the global financial world, with a highly interconnected economic dependence, commodities, energy, materials, and in particular, currencies play a pivotal role in the stock market's heterogeneity and connectivity. This applies to gold as well as the world's busiest precious metal marketplace.
Under normal conditions, gold and the US dollar are in an inverse relationship. Due to its worldwide denomination in USD, any USD weakness pushes gold prices up, and vice versa. Therefore, as far as the USD Index piece of the puzzle is concerned, the situation is not what it appears to be at initially, as we've witnessed something genuinely perplexing.
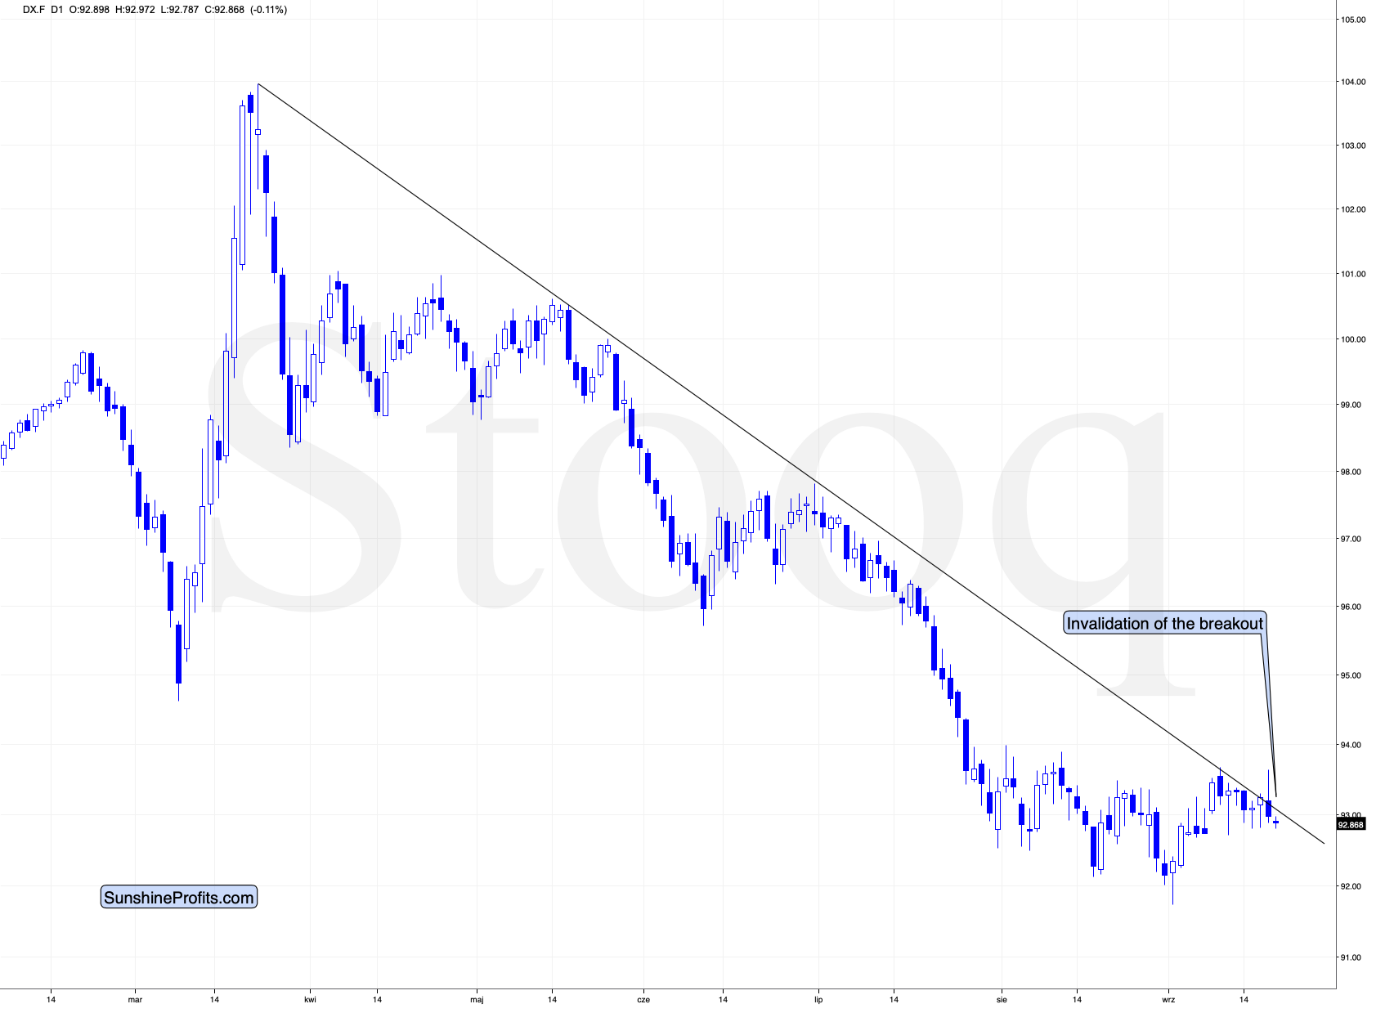
Namely, the index invalidated its breakout, which is a bearish sign. The USDX was quite visibly above the declining resistance line, but it failed to hold these gains. In July, a failure to rally above its resistance meant another significant downturn, causing higher gold prices.
So, does the USD Index and gold await the same faith soon?
Not necessarily.
The USD Index is a weighted average of several currency exchange rates. The biggest weight (over 50%) is attributed to the euro exchange rate, and the second biggest weight is attributed to the yen exchange rate. So, let's see how the situation looks like in both currencies.
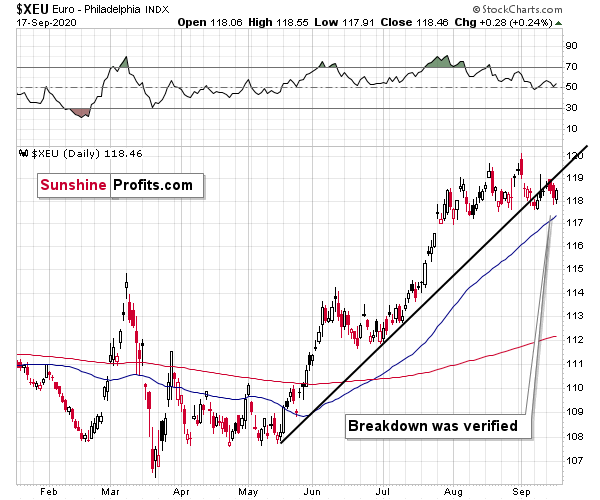
The euro is after a breakdown and a verification thereof. This is a very bearish situation, but bullish for the USD Index. Because of that, the situation with the euro is bearish for gold, at least in the short run.
And what about the Japanese yen?
Well, the situation is not that different as far as the implications are concerned, but the direct reason for it is.
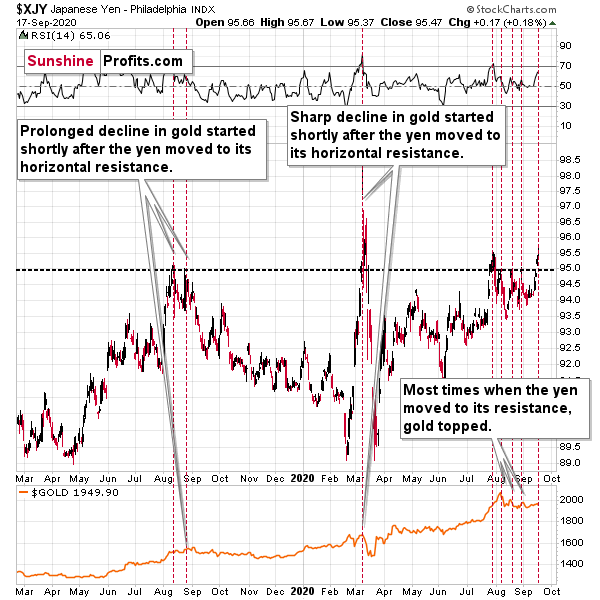
As you can see on the Japanese yen index chart above, in the past 1.5 years, whenever the yen tried to rally above the 95 levels, it topped briefly and reversed its course.
In the mid-2019, this resulted in a prolonged gold decline, and by early 2020, it resulted in a sharp and deeper decline.
In recent weeks, we've detected the signal above (the yen index trying to break above 95) 4 times: once it was just before the final top in gold, and in all the remaining (3) cases, these were local tops in gold.
The implications of the current yen situation are bearish for gold, and they are bullish for the USD Index, as the Japanese currency is likely to have invalidated the breakout once again. History tends to repeat itself, after all.
Given the tips that the individual currency exchange rates give us, should we really expect a USD Index's breakout invalidation to lead towards lower values? Definitely not. The respective currency exchange rates are more "basic", and their outlooks outweigh the index chart that is essentially based on them.
This means that the legitimacy of USDX's invalidation's bearish implications is suspicious, to put it mildly.
In other words, the bearish outlook for gold didn't really change at all, even though we admit that it is not as bearish as it was before the USDX's breakout's invalidation. While we continue to predict lower gold prices, in the next several weeks (possibly months), based on the USDX action, we agree that the outlook is slightly less bearish than it was in the previous days.
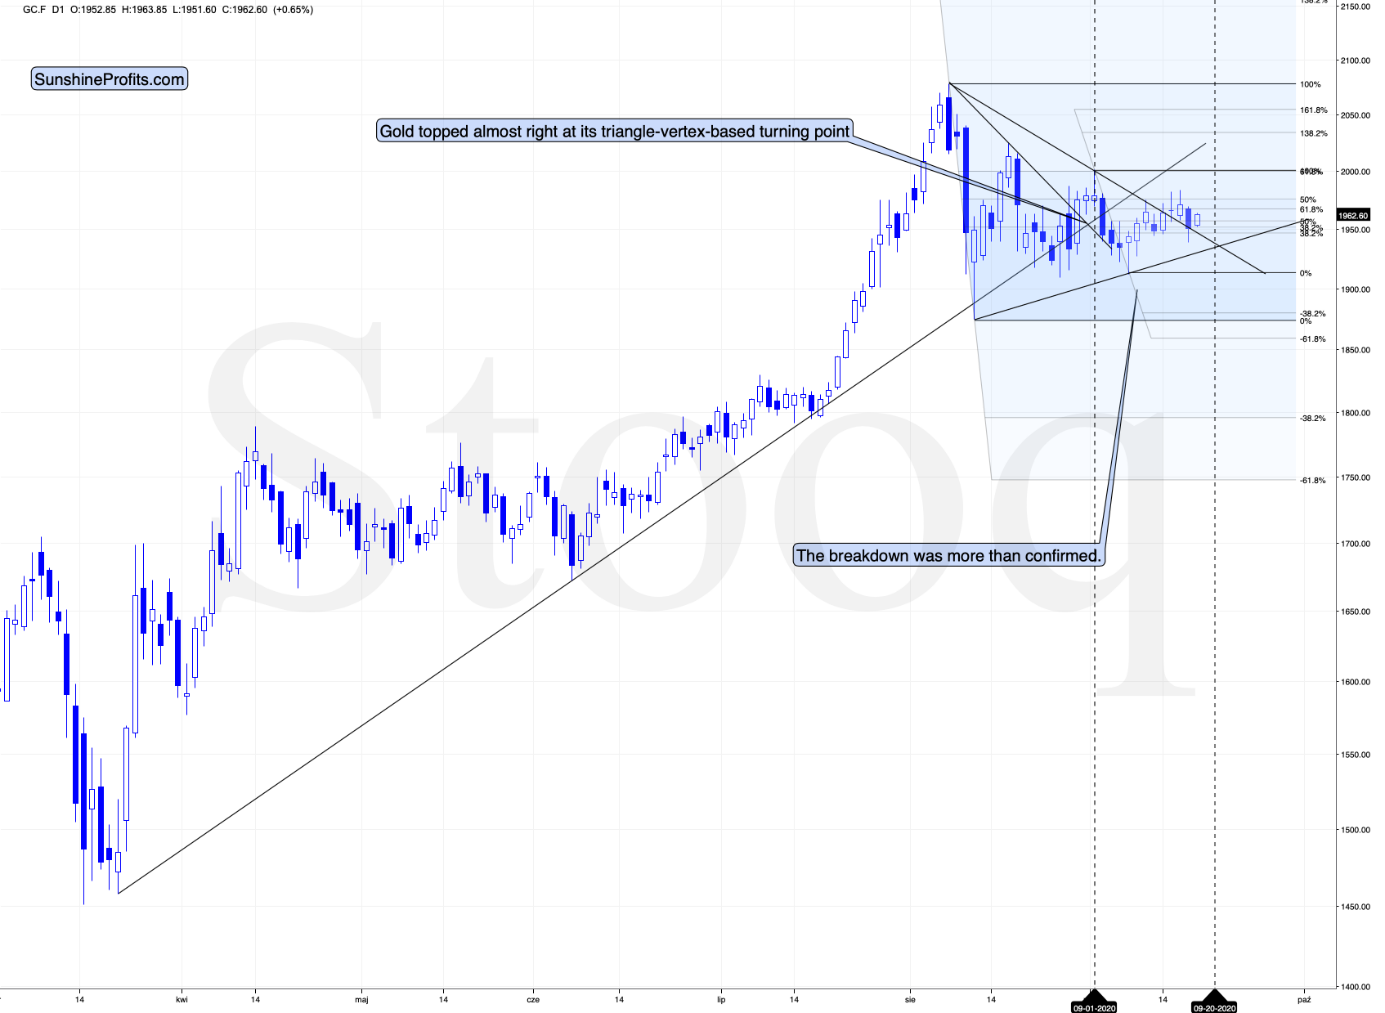
Please note that gold has yet another triangle-vertex-based reversal that is just a few days away. Perhaps the yellow metal will move slightly higher once again and then start its plunge on Tuesday or Wednesday. During this time, the USD Index could regain its strength and attempt to break above its declining resistance line once more. Only this time, the breakout would be successful.
All in all, the outlook for the precious metals market remains bearish.
Overview of the Upcoming Decline
As far as the upcoming decline's current overview is concerned, I believe that it has already begun, at least regarding mining stocks. It's still relatively unclear if gold will make another attempt to move to new highs before plunging below $1,800, but for now, it appears more likely that it won't.
We expect silver to decline more than miners during the final stage of the slide (which could end slightly later than in 6 weeks, perhaps remarkably close to the end of the year - just like what happened in 2015). That would be in accordance with how the markets initially reacted to the Covid-19 threat.
The impact of all the new rounds of money printing in the U.S. and Europe on the precious metals' prices can be incredibly positive in the long run, but it doesn't make the short-term decline unlikely. Soon, markets can and will get ahead of themselves right before they need to decline - sometimes very profoundly - before continuing their upward march.
The plan is to exit the current positions in miners after they decline far and fast, but simultaneously, when just a "significant" silver decline occurs (we expect this to happen in 0 - 6 weeks). In other words, the decline in silver should be severe, but the decline in the miners should look "ridiculous".
That's exactly what we did in March when we bought practically right at the bottom. It is an exceptionally soft and broad instruction, and therefore, additional confirmations are necessary. I expect this confirmation to come from gold, reaching about $1,800. If at the same time, gold moves towards $1,800 and miners are already after a ridiculously huge drop (say, to $31 - $32 in the GDX ETF - or lower), we will probably exit the short positions in the miners and, at the same time enter short positions in silver. It will be tempting to wait for opening the short position in silver until the entire sector rebounds, but such a rebound could last only a couple of hours. Therefore, it would be complicated to execute such an approach successfully.
Summary
Summing up, it seems that after reversing $4 above our upside target, gold has finally topped and it formed the second top from the double-top pattern in mid-August. The USD Index appears to be forming a broad bottom, just like it did back in 2008, 2011, and 2018. While the USDX just moved slightly below its recent lows, it's worth keeping in mind that gold didn't move to its recent highs. This relative underperformance, along with the specific juncture at which the USD Index currently is, creates quite a bearish environment for the precious metals market, especially for mining stocks. Once the general stock market finally moves down, the decline in the latter is likely to accelerate.
The self-similar pattern in gold makes the outlook even more bearish, adding to the already bearish outlook for the next several weeks.
Naturally, everyone's trading is their responsibility, but in our opinion, if there ever was a time to either enter a short position in the miners or to increase its size if it wasn't already sizable, it's now. We made money on the March decline and on the March rebound, and it seems that another massive slide is about to start. When everyone is on one side of the boat, it's always a good idea to be on the other side, and the Gold Miners Bullish Percent Index literally indicates that this applies to mining stocks.
After the sell-off (that takes gold to about $1,700 or lower), we expect the precious metals to rally significantly. The final decline might take as little as 1-6 weeks, so it's imperative to remain vigilant to any changes.
Most importantly, please stay healthy and safe. We made a lot of money on the March decline and the subsequent rebound (its initial part) price moves (and we'll likely earn much more profits in the following weeks and months), but you have to be healthy and in good spirit to reap and enjoy the results.
As always, we'll keep you - our subscribers - informed.
To summarize:
Trading capital (supplementary part of the portfolio; our opinion): Full speculative short positions (200% of the full position) in mining stocks is justified from the risk to reward point of view with the following binding exit profit-take price levels:
Senior mining stocks (price levels for the GDX ETF): binding profit-take exit price: $32.02; stop-loss: none (the volatility is too big to justify a SL order in case of this particular trade); binding profit-take level for the DUST ETF: $28.73; stop-loss for the DUST ETF: none (the volatility is too big to justify a SL order in case of this particular trade)
Junior mining stocks (price levels for the GDXJ ETF): binding profit-take exit price: $42.72; stop-loss: none (the volatility is too big to justify a SL order in case of this particular trade); binding profit-take level for the JDST ETF: $21.22; stop-loss for the JDST ETF: none (the volatility is too big to justify a SL order in case of this particular trade)
For-your-information targets (our opinion; we continue to think that mining stocks are the preferred way of taking advantage of the upcoming price move, but if for whatever reason one wants / has to use silver or gold for this trade, we are providing the details anyway. In our view, silver has greater potential than gold does):
Silver futures downside profit-take exit price: unclear at this time - initially, it might be a good idea to exit, when gold moves to $1,703.
Gold futures downside profit-take exit price: $1,703
Long-term capital (core part of the portfolio; our opinion): No positions (in other words: cash
Insurance capital (core part of the portfolio; our opinion): Full position
Whether you already subscribed or not, we encourage you to learn exactly how you can make the most of our alerts and read our replies to the most common alert-and-gold-trading-related-questions.
Please note that the in the trading section we describe a situation for the day that the alert is posted. In other words, if we are writing about a speculative position, it means that it applies on the day it was posted. We are also featuring the initial target prices, so that you can decide whether keeping a position on a given day is something that is in tune with your approach (some moves are too small for medium-term traders and some might appear too big for day-traders).
Additionally, you might want to read why our stop-loss orders are usually relatively far from the current price.
Please note that a full position doesn't mean using all of the capital for a given trade. You will find more details on our thoughts about gold portfolio structuring in the Key Insights section on our website.
As a reminder - "initial target price" means exactly that - an "initial" one. It's not a price level at which we suggest closing positions. If this becomes the case (like it did in the previous trade) we will refer to these levels as exit orders levels (exactly as we've done previously). Stop-loss levels, however, are naturally not "initial" ones, but something that, in our opinion, might be entered as an order.
Since it is impossible to synchronize target prices and stop-loss levels for all the ETFs and ETNs with the main markets that we provide these levels for (gold, silver and mining stocks - the GDX ETF), the stop-loss levels and target prices for other ETNs and ETF (among other: UGLD, DGLD, USLV, DSLV, NUGT, DUST, JNUG, JDST) are provided as supplementary, and not as "final". This means that if a stop-loss or a target level is reached for any of the "additional instruments" (DGLD for instance), but not for the "main instrument" (gold in this case), we will view positions in both gold and DGLD as still open and the stop-loss for DGLD would have to be moved lower. On the other hand, if gold moves to a stop-loss level but DGLD doesn't, then we will view both positions (in gold and DGLD) as closed. In other words, since it's not possible to be 100% certain that each related instrument moves to a given level when the underlying instrument does, we can't provide levels that would be binding. The levels that we do provide are our best estimate of the levels that will correspond to the levels in the underlying assets, but it will be the underlying assets that one will need to focus on regarding the signs pointing to closing a given position or keeping it open. We might adjust the levels in the "additional instruments" without adjusting the levels in the "main instruments", which will simply mean that we have improved our estimation of these levels, not that we changed our outlook on the markets. We are already working on a tool that would update these levels on a daily basis for the most popular ETFs, ETNs and individual mining stocks.
Our preferred ways to invest in and to trade gold along with the reasoning can be found in the how to buy gold section. Additionally, our preferred ETFs and ETNs can be found in our Gold & Silver ETF Ranking.
As a reminder, Gold & Silver Trading Alerts are posted before or on each trading day (we usually post them before the opening bell, but we don't promise doing that each day). If there's anything urgent, we will send you an additional small alert before posting the main one.
Thank you.
Sincerely,
Przemyslaw Radomski, CFA
Editor-in-chief, Gold & Silver Fund Manager

