

Briefly: In our opinion, full (150% of the regular full position) speculative short positions in gold, silver and mining stocks are justified from the risk/reward perspective at the moment of publishing this alert.
Last week all eyes were once again on the USD Index as its decline continued. The USD even reached the 93 level even though it was at 100 only a few months ago. Gold responded by moving higher and so did mining stocks and silver. Are there any signs of an upcoming reversal or is the USD truly doomed?
There are signs for a reversal in the USD Index and there are even more such signs for the precious metals market. Let’s start with the former (chart courtesy of http://stockcharts.com).
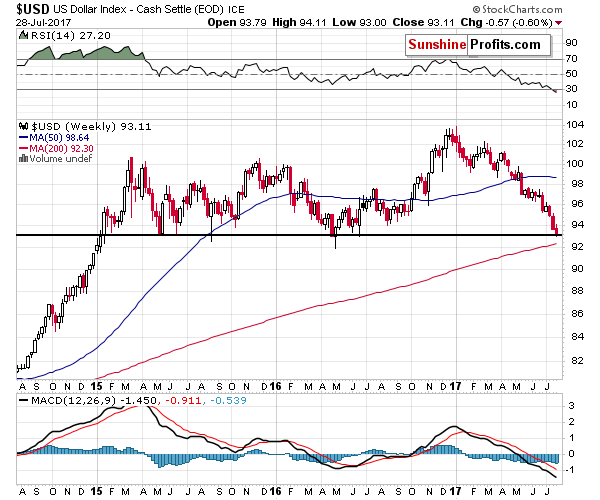
The USD Index closed the week in tune with the 2015 and 2016 bottoms. Both previous bottoms took place close to the middle of the year, so the timing for the current move lower also supports that reversal theory.
The USD Index reached the previous weekly bottoms and it suggests that the bottom is in – in weekly terms. In other words, this week’s closing price is very likely to be higher than 93.11. What the above does not say is how the USD Index will perform before the end of the week – even if we saw a temporary downswing to about 92 and then a big comeback (just like the one we saw in 2016 after the weekly bottom), it would still not invalidate the bullish implications or the analogy in general.
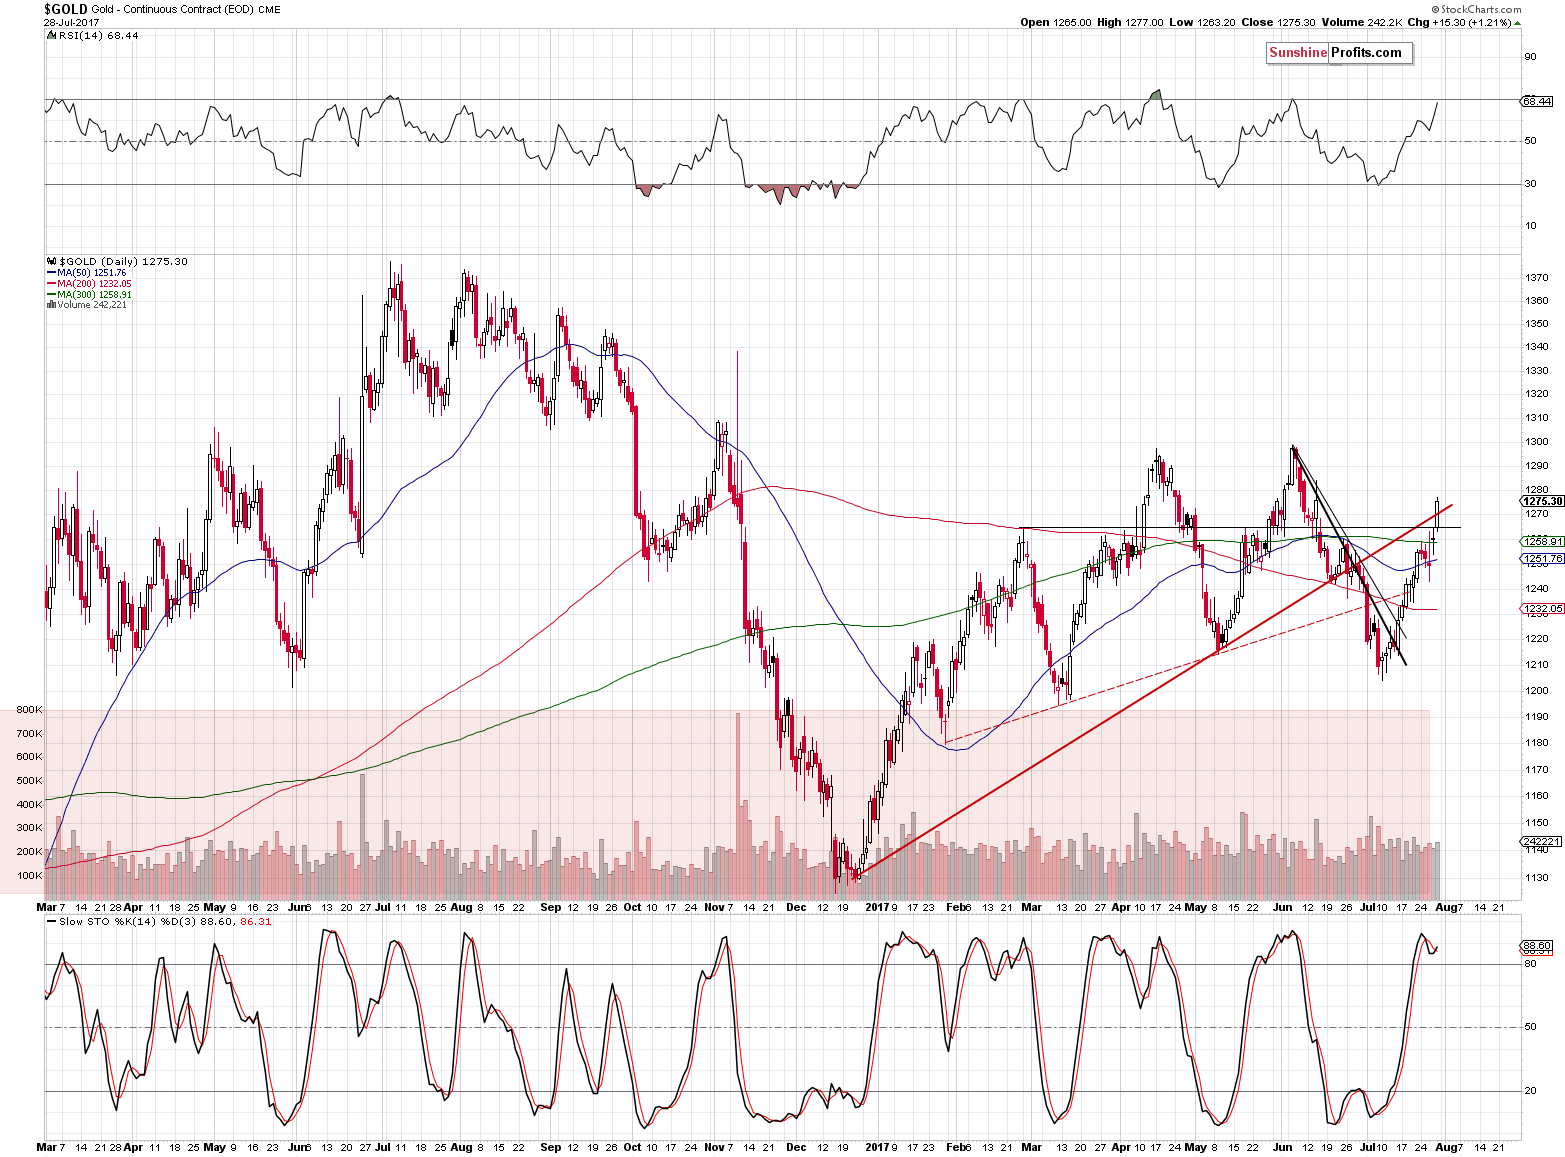
As far as gold is concerned, the first thing that we need to note is that there seems to be an error in the Stockcharts gold closing price – the price reported by kitco.com is about $1,269 and as you can see on the above chart, it would have been at the rising red resistance line, not above it. Consequently, what we wrote previously remains up-to-date:
Still – as we wrote yesterday - gold could move to about $1,270 and reverse after that as the rising red resistance line is now higher than when we wrote the above. Silver could move just a bit higher as well, but it doesn’t mean that it has to. Given the situation in the USD Index and the mining stocks’ underperformance (on Wednesday, we saw only one session that was an exception to the above rule) it seems that the surprising move (remember the flash crash in silver earlier this month?) could be to the downside, so adjusting the position based on the possibility of seeing a small upswing doesn’t seem justified.
The change regarding the data also has implications for the gold ratios. Approximately, one could say that Friday’s rally was about half of what is being reported by the charts. Consequently, the tiny breakouts that you will see below are actually moves to the resistance lines – not breakouts.
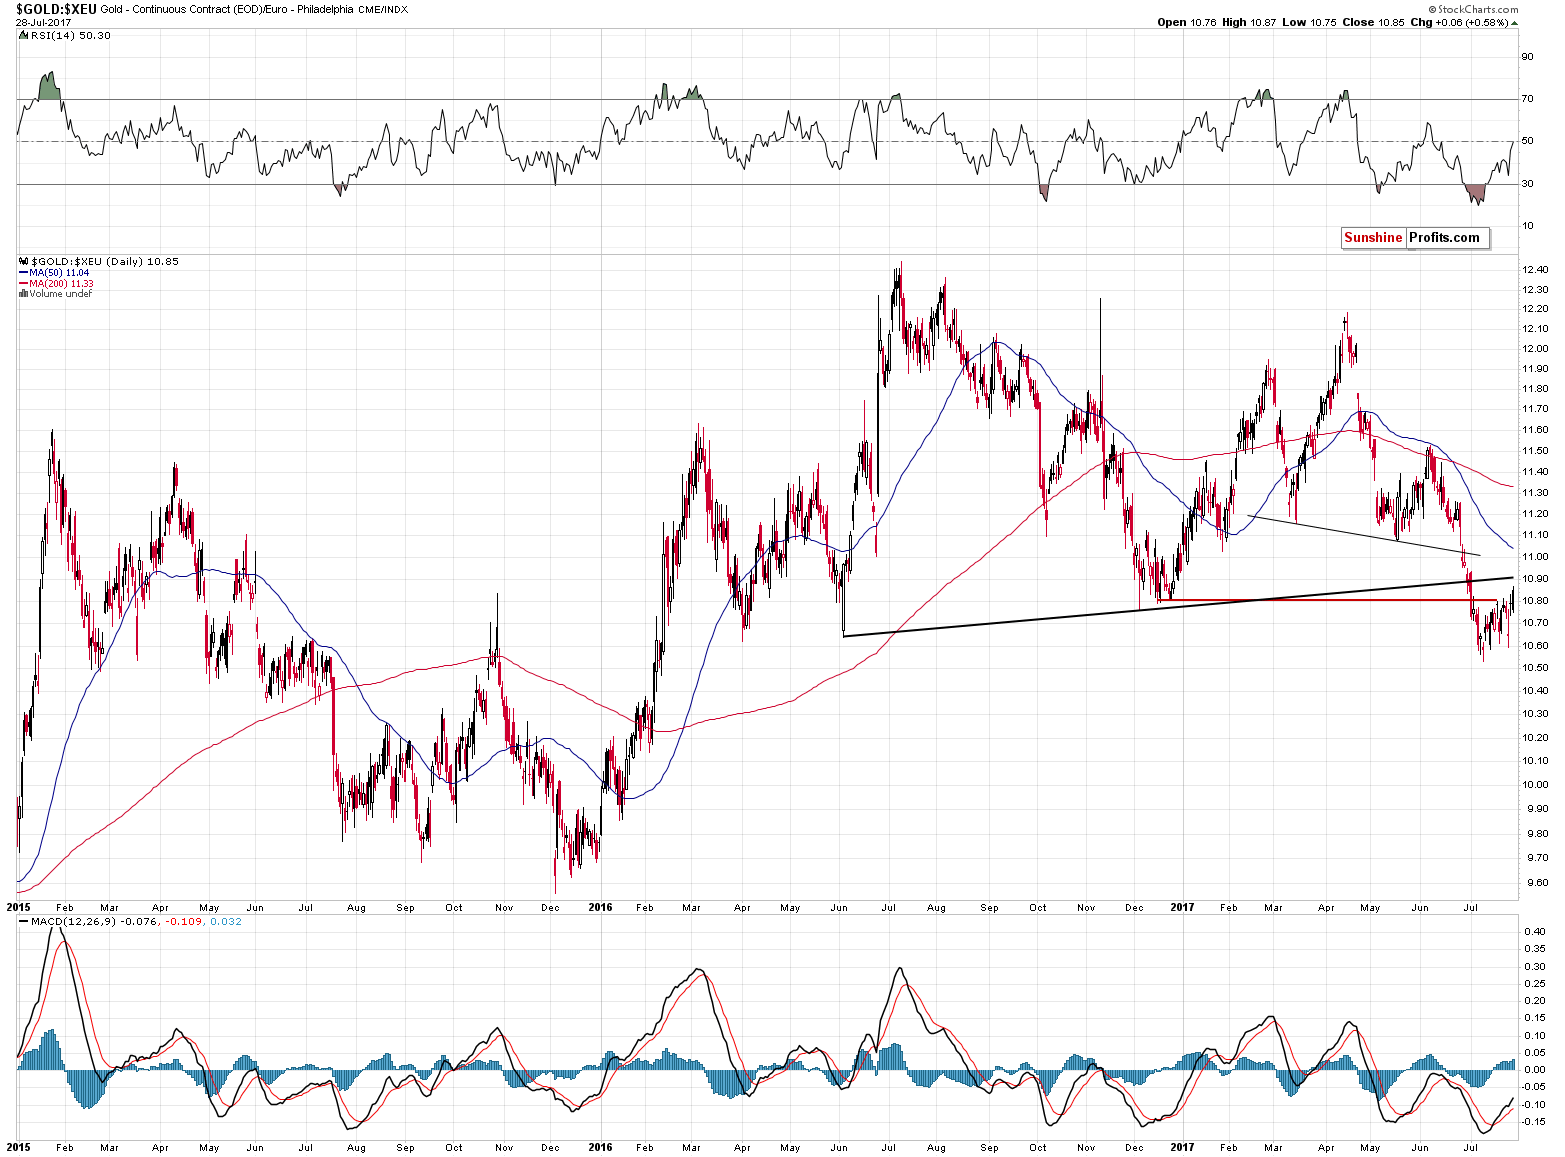
Gold priced in terms of the euro actually reached the December 2016 bottom once again – it didn’t break above it.
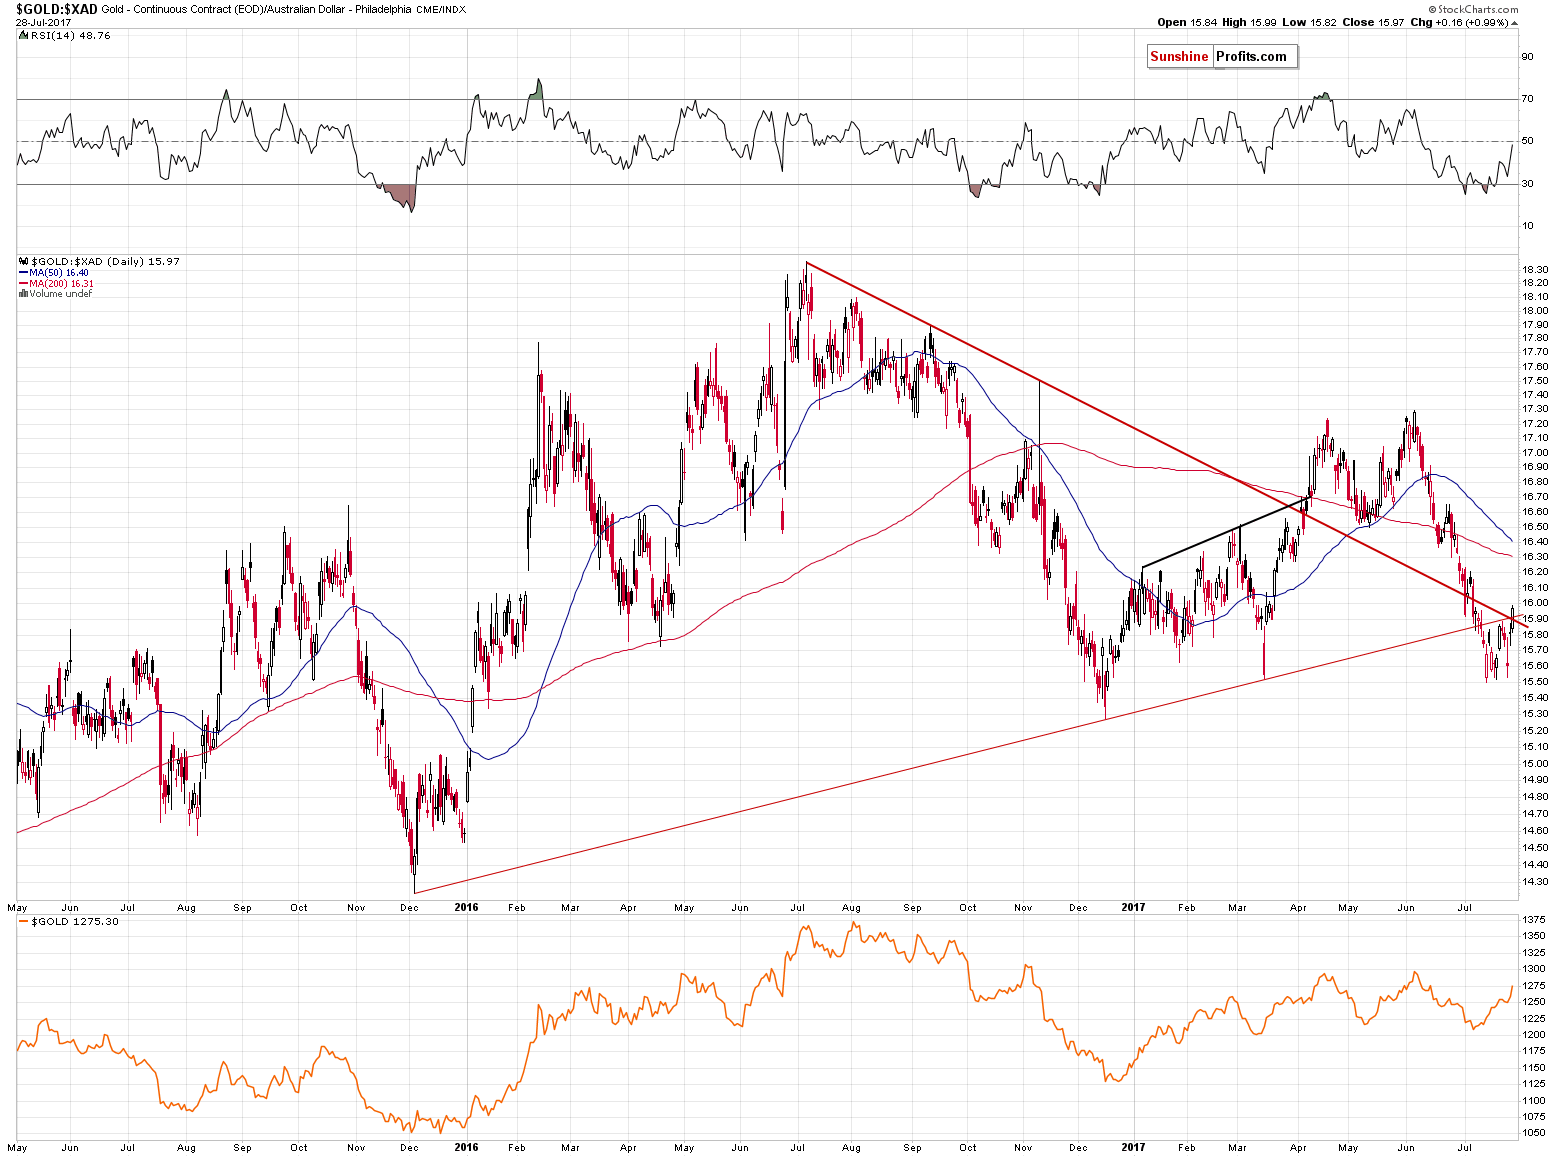
Gold priced in the Australian dollar moved to the combination of resistance lines – not above them.
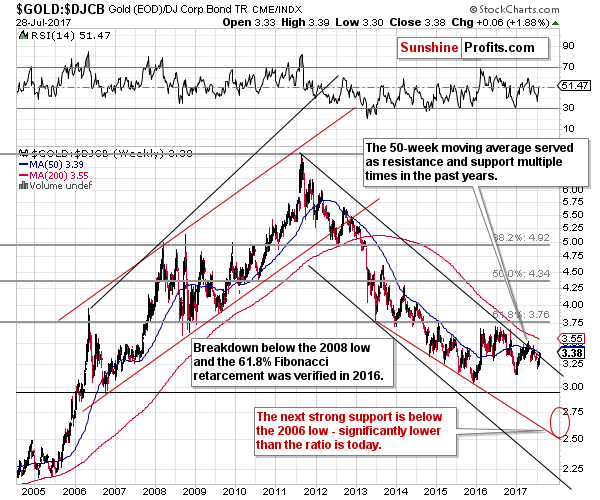
The gold to bonds ratio seems to have moved to the declining resistance line, not slightly above it. Still, if it had moved above it, it would not be significant yet as tiny breakouts were seen previously and they actually marked the final tops.
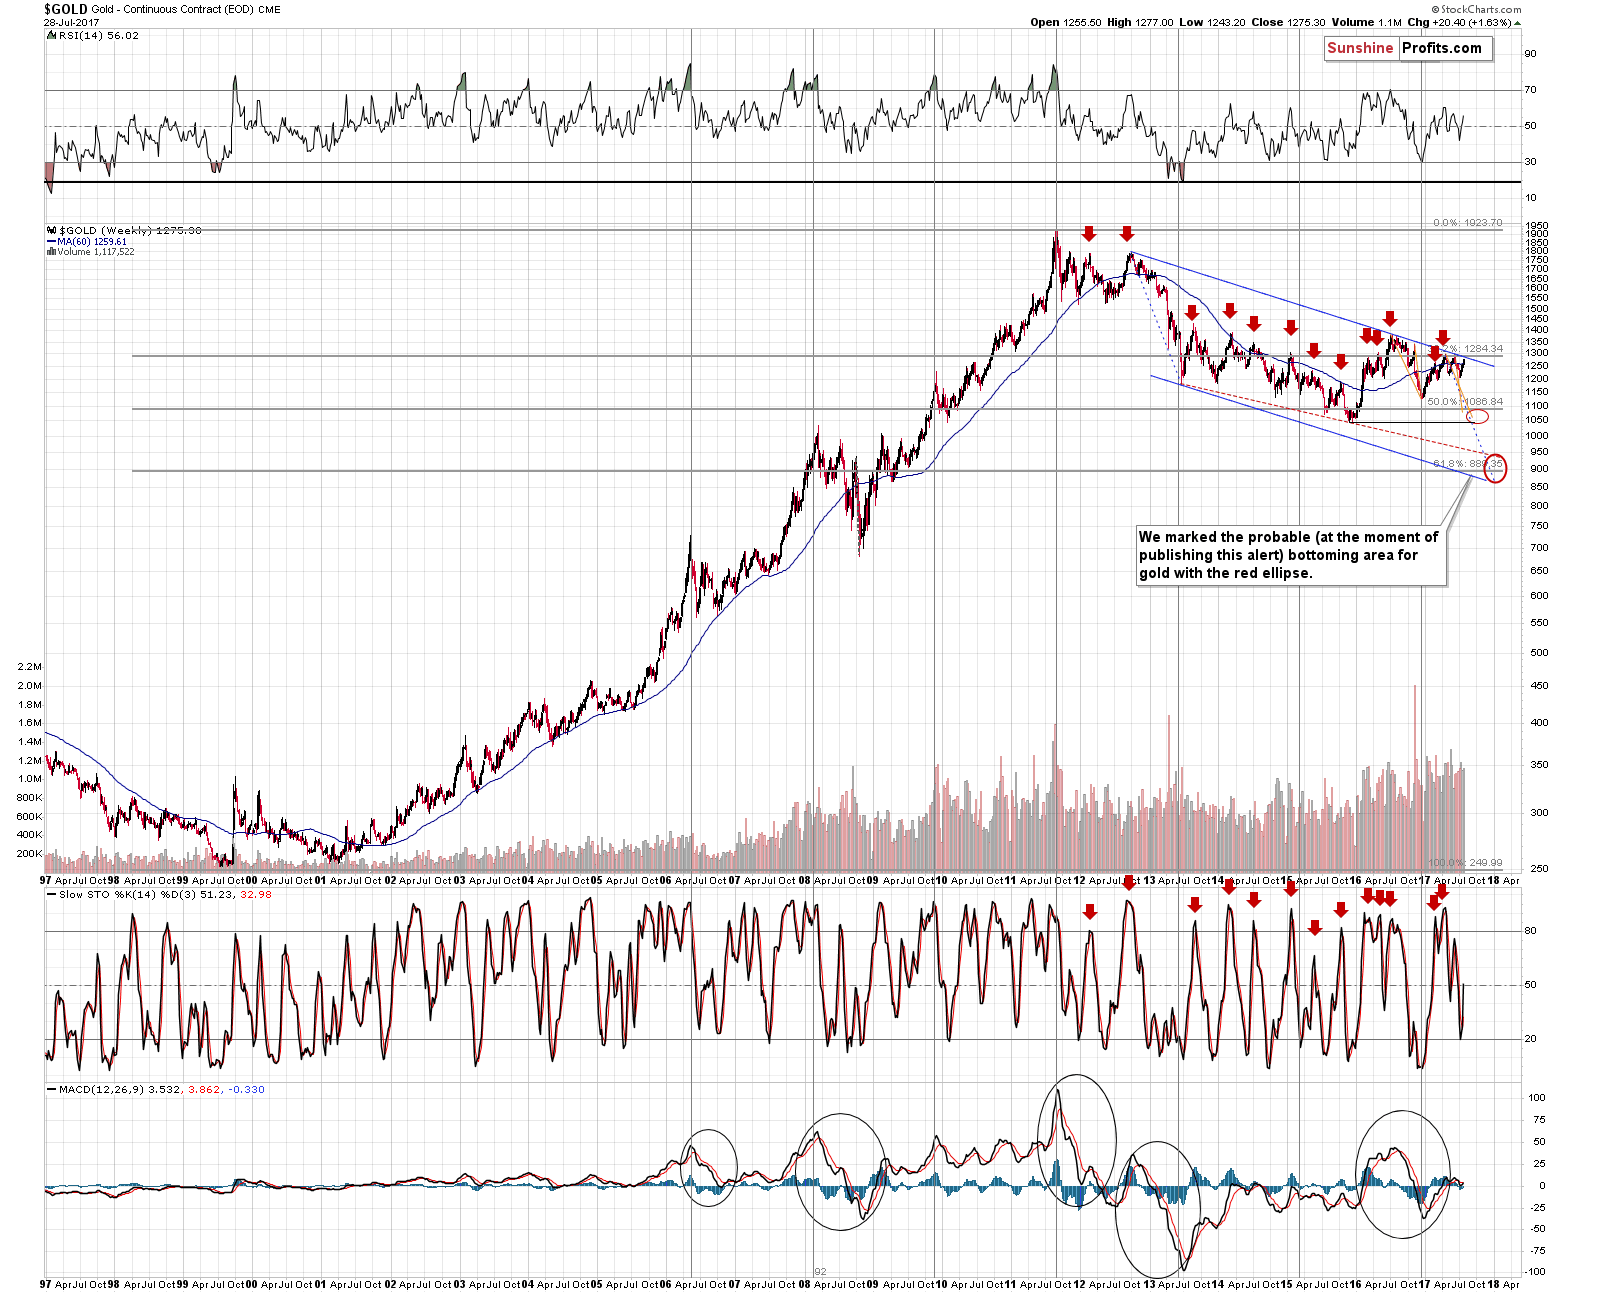
From the long-term perspective, we see that gold still has additional $10-$15 or so to rally before significantly changing the outlook – the long-term declining resistance line (based on the 2012 and 2016 tops) is at about $1,280 now, which is where gold could temporarily move if the USD temporarily spikes downward before reversing this week.
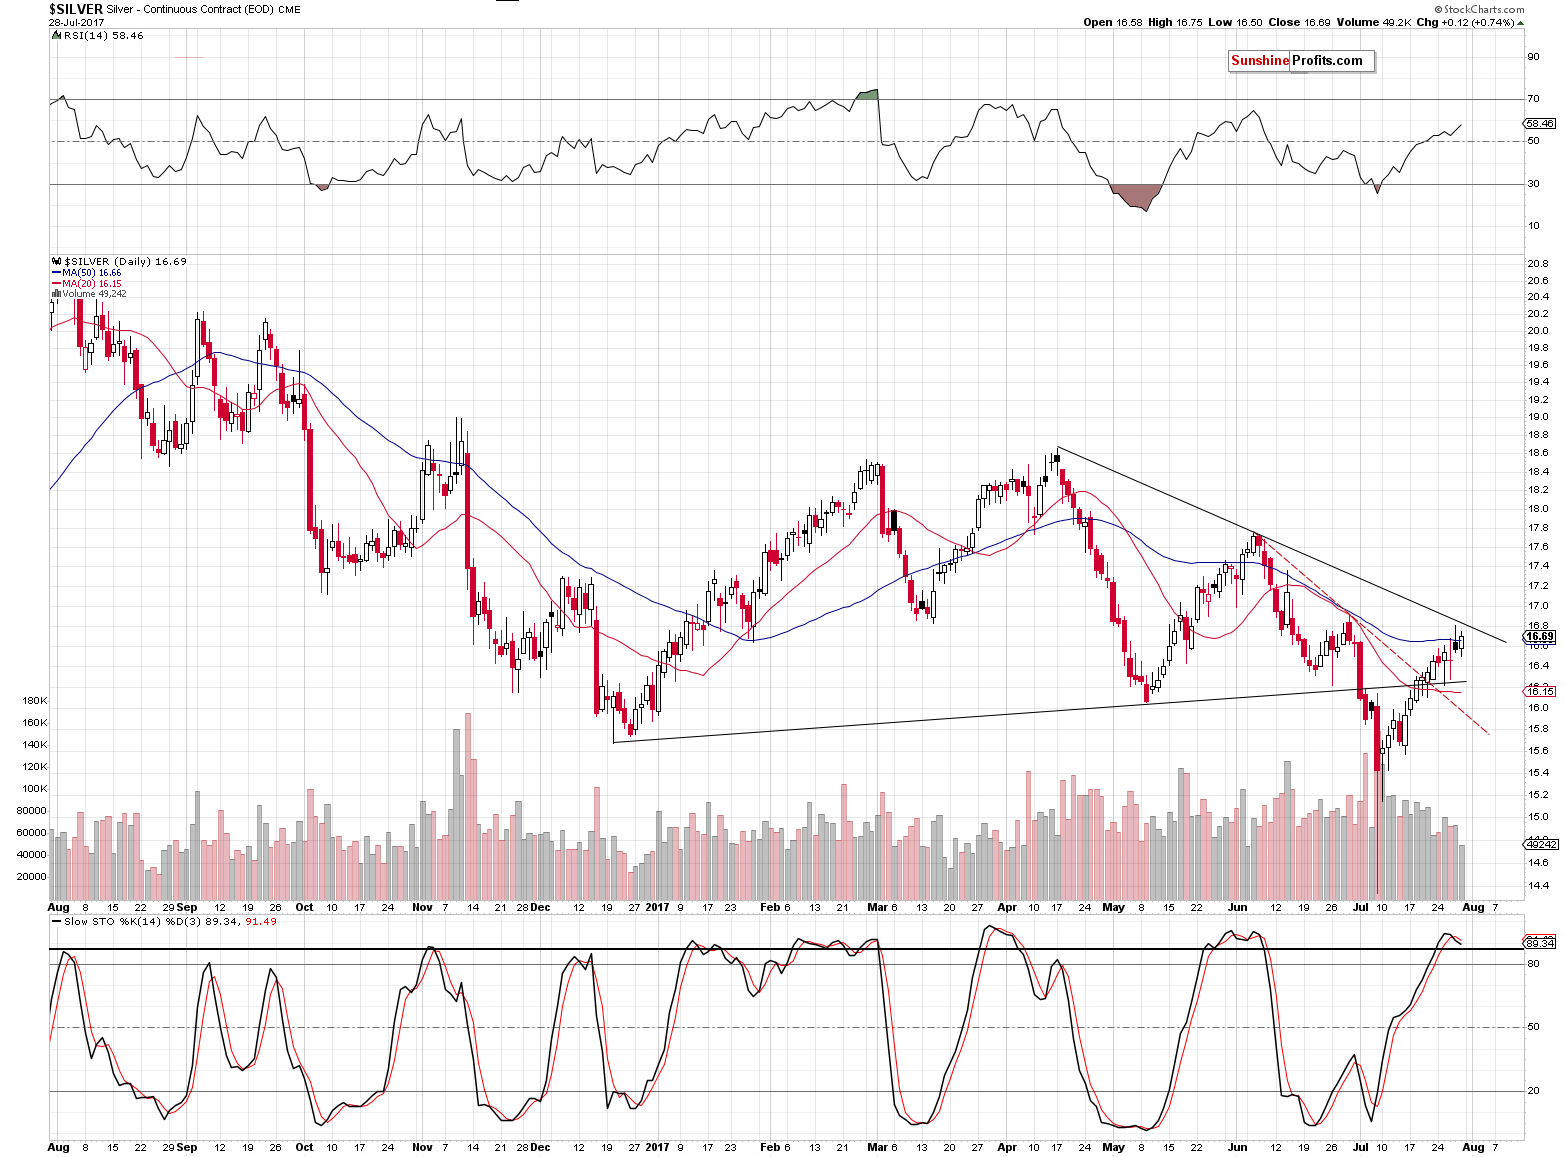
Silver also has some room tom move higher – to about 16.80 or so. The volume was very low during Friday’s upswing and please note that we saw the same thing in early June – that was one day before the top.
We certainly could be one or two days away from the top, especially that the bearish implications of the looming turning point remain in place.
Namely, silver’s turning point is just around the corner and in all three previous cases, the major top (followed by a sharp decline) was seen right before the turning point. Consequently, seeing a top shortly appears very likely.
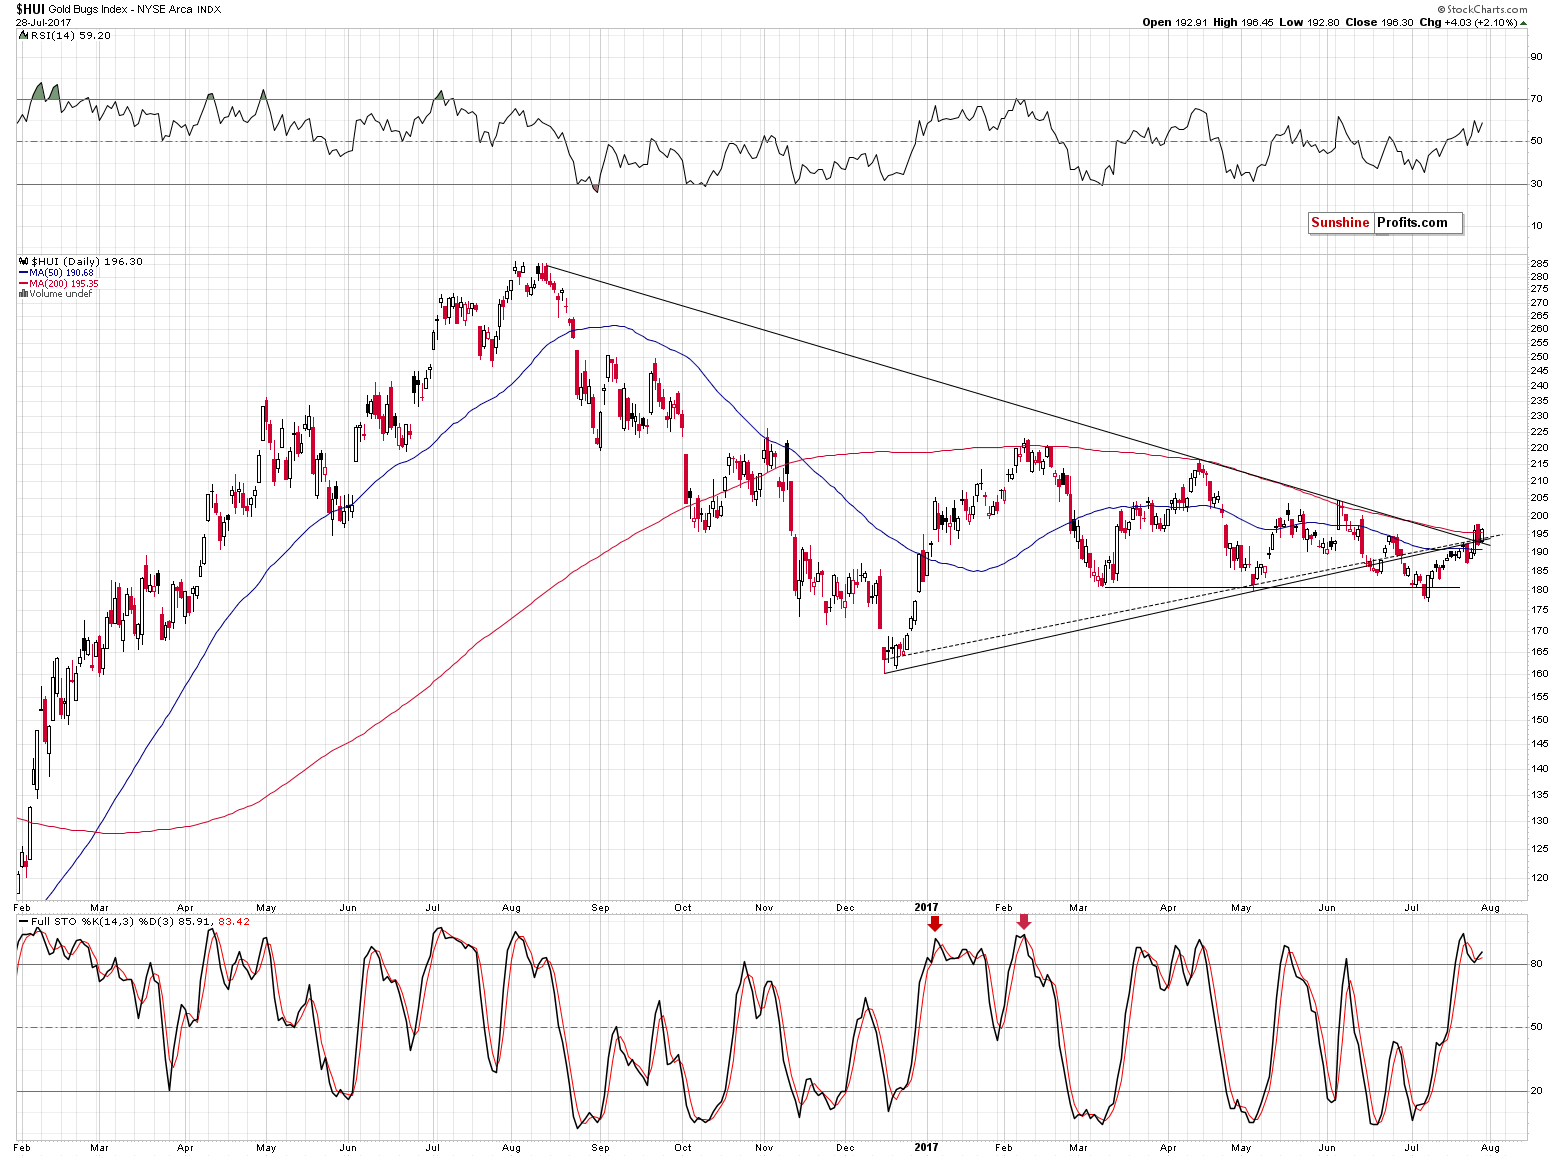
Gold stocks once again moved above the combination of resistance lines and once again the breakout is not confirmed, so there are little bullish implications so far. Interestingly, the HUI Index moved to the 200-day moving average – something that has kept the rallies in check for the entire 2017. In fact, all three previous important tops were formed only after the HUI moved to this moving average.
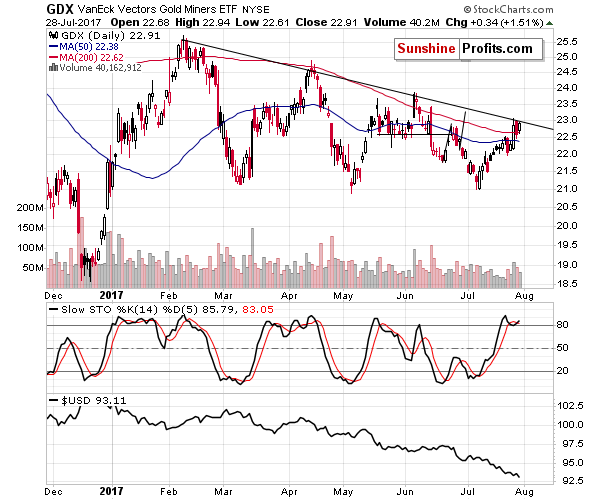
Moreover, in the case of another proxy for the precious metals sector – the GDX ETF – the price moved to the declining resistance line based on the previous tops (closing prices), so the small breakout in the case of the HUI Index is definitely not confirmed.
Summing up, one of the most important downside targets for the USD Index was reached and the upside targets for gold and silver were reached and almost reached, respectively, and this, combined with the confirmed (not invalidated) breakdowns in gold in terms of currencies other than the U.S. dollar, silver’s turning point and the resistance levels reached in mining stocks, paints a bearish picture for the precious metals sector for the following weeks. The medium-term outlook remains bearish and any strength here – if we see it at all – is likely to be only temporary.
As always, we will keep you – our subscribers – informed.
To summarize:
Trading capital (supplementary part of the portfolio; our opinion): Short positions (150% of the full position) in gold, silver and mining stocks are justified from the risk/reward perspective with the following stop-loss orders and initial target price levels / profit-take orders:
- Gold: initial target price level: $1,063; stop-loss: $1,317; initial target price for the DGLD ETN: $81.88; stop-loss for the DGLD ETN $44.57
- Silver: initial target price: $13.12; stop-loss: $19.22; initial target price for the DSLV ETN: $46.18; stop-loss for the DSLV ETN $17.93
- Mining stocks (price levels for the GDX ETF): initial target price: $9.34; stop-loss: $26.34; initial target price for the DUST ETF: $143.56; stop-loss for the DUST ETF $21.37
In case one wants to bet on junior mining stocks' prices (we do not suggest doing so – we think senior mining stocks are more predictable in the case of short-term trades – if one wants to do it anyway, we provide the details), here are the stop-loss details and initial target prices:
- GDXJ ETF: initial target price: $14.13; stop-loss: $45.31
- JDST ETF: initial target price: $417.04; stop-loss: $43.12
Long-term capital (core part of the portfolio; our opinion): No positions (in other words: cash)
Insurance capital (core part of the portfolio; our opinion): Full position
Important Details for New Subscribers
Whether you already subscribed or not, we encourage you to find out how to make the most of our alerts and read our replies to the most common alert-and-gold-trading-related-questions.
Please note that the in the trading section we describe the situation for the day that the alert is posted. In other words, it we are writing about a speculative position, it means that it is up-to-date on the day it was posted. We are also featuring the initial target prices, so that you can decide whether keeping a position on a given day is something that is in tune with your approach (some moves are too small for medium-term traders and some might appear too big for day-traders).
Plus, you might want to read why our stop-loss orders are usually relatively far from the current price.
Please note that a full position doesn’t mean using all of the capital for a given trade. You will find details on our thoughts on gold portfolio structuring in the Key Insights section on our website.
As a reminder – “initial target price” means exactly that – an “initial” one, it’s not a price level at which we suggest closing positions. If this becomes the case (like it did in the previous trade) we will refer to these levels as levels of exit orders (exactly as we’ve done previously). Stop-loss levels, however, are naturally not “initial”, but something that, in our opinion, might be entered as an order.
Since it is impossible to synchronize target prices and stop-loss levels for all the ETFs and ETNs with the main markets that we provide these levels for (gold, silver and mining stocks – the GDX ETF), the stop-loss levels and target prices for other ETNs and ETF (among other: UGLD, DGLD, USLV, DSLV, NUGT, DUST, JNUG, JDST) are provided as supplementary, and not as “final”. This means that if a stop-loss or a target level is reached for any of the “additional instruments” (DGLD for instance), but not for the “main instrument” (gold in this case), we will view positions in both gold and DGLD as still open and the stop-loss for DGLD would have to be moved lower. On the other hand, if gold moves to a stop-loss level but DGLD doesn’t, then we will view both positions (in gold and DGLD) as closed. In other words, since it’s not possible to be 100% certain that each related instrument moves to a given level when the underlying instrument does, we can’t provide levels that would be binding. The levels that we do provide are our best estimate of the levels that will correspond to the levels in the underlying assets, but it will be the underlying assets that one will need to focus on regarding the signs pointing to closing a given position or keeping it open. We might adjust the levels in the “additional instruments” without adjusting the levels in the “main instruments”, which will simply mean that we have improved our estimation of these levels, not that we changed our outlook on the markets. We are already working on a tool that would update these levels on a daily basis for the most popular ETFs, ETNs and individual mining stocks.
Our preferred ways to invest in and to trade gold along with the reasoning can be found in the how to buy gold section. Additionally, our preferred ETFs and ETNs can be found in our Gold & Silver ETF Ranking.
As a reminder, Gold & Silver Trading Alerts are posted before or on each trading day (we usually post them before the opening bell, but we don't promise doing that each day). If there's anything urgent, we will send you an additional small alert before posting the main one.
=====
Latest Free Trading Alerts:
Last week, North Korea fired another missile, while data on U.S. second quarter gross domestic product was published. What do these events imply for the gold market?
S&P 500 index lost 0.1% on Friday, as investors hesitated following Thursday's volatility. Will uptrend continue? Or is this some topping pattern before downward reversal?
Mixed Expectations As Stocks Trade Along New Record High
=====
Hand-picked precious-metals-related links:
Gold falls in Asia with China PMIs see a tad light on demand side
Tanzania says not targeting Acacia staff in immigration crackdown
Solid-gold model of lunar module stolen from Neil Armstrong museum
India Gold demand may stay around 650-750 tons in 2017
Despite Lower Gold Demand, India Is Still Sitting On $1 Trillion - WGC
Estimated Chinese Gold Reserves Surpass 20,000t
=====
In other news:
Trump’s Dollar Mess: Losses Pile Up as Political Drama Mounts
Europe’s First Rate Hike May Be Coming This Week
Eurozone Inflation Holds at 1.3% in July; Core Consumer Prices Edge Higher
Are Central Bankers Turning Marxist?
Oil near two-month high as producers set to meet again
=====
Thank you.
Sincerely,
Przemyslaw Radomski, CFA
Founder, Editor-in-chief, Gold & Silver Fund Manager
Gold & Silver Trading Alerts
Forex Trading Alerts
Oil Investment Updates
Oil Trading Alerts

