

Briefly: In our opinion, full (150% of the regular full position) speculative short positions in gold, silver and mining stocks are justified from the risk/reward perspective at the moment of publishing this alert.
Gold, silver and mining stocks declined yesterday and now – with all of the above at new monthly lows - it’s become clear that Monday’s upswing was just a bull trap and that gold has indeed started a bigger decline. But how big is this decline likely to be? What are the near-term targets? What levels could trigger a rally and when should one enter a trading position based on them? Before replying to the above question, let’s take a look at what happened in the USD Index (chart courtesy of http://stockcharts.com).
In yesterday’s alert, we wrote the following:
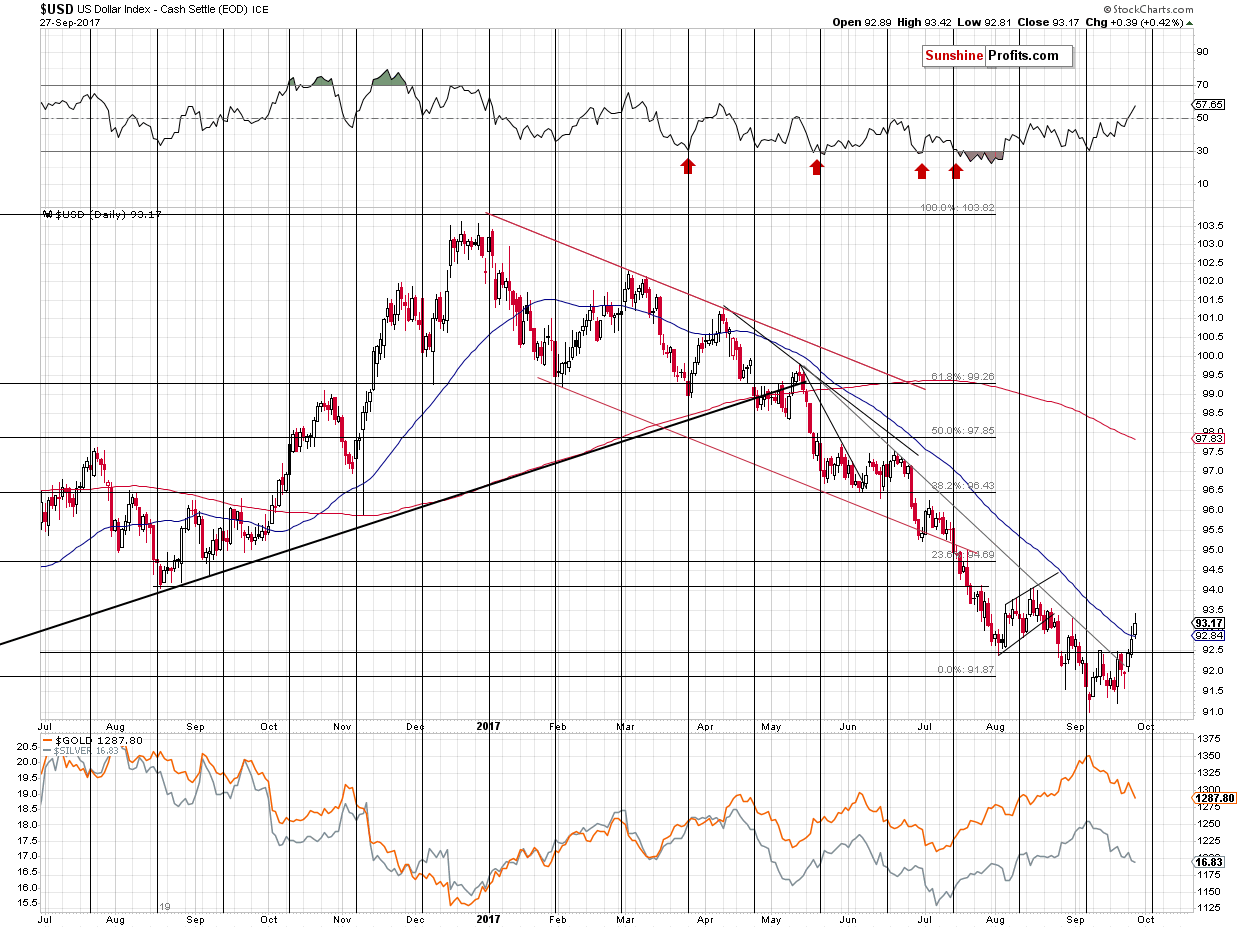
We have just seen a second daily close above the declining resistance line and the USD continued to move higher also in today’s pre-market trading (93.37 at the moment of writing these words), which makes it very likely that later today we will get the third close above the resistance line. This means that its very likely that the breakout will be confirmed and the implications are already very bullish for the short and medium term.
The breakout was confirmed and at the moment of writing these words, the USD Index is still trading visibly above 93 (93.27). The implications for the following weeks are very bullish, especially that the USD Index was extremely oversold from the medium-term point of view before starting this rally.
Still, let’s keep in mind that a short pause or even a move back to the declining resistance line is not out of the question before the rally continues. In other words, a move back to 92 would appear very bearish, but it wouldn’t be such if the declining resistance line remains unbroken. Such a corrective downswing is not imminent, though, especially given the long-term chart for the USD Index.
In yesterday’s alert, we wrote the following:
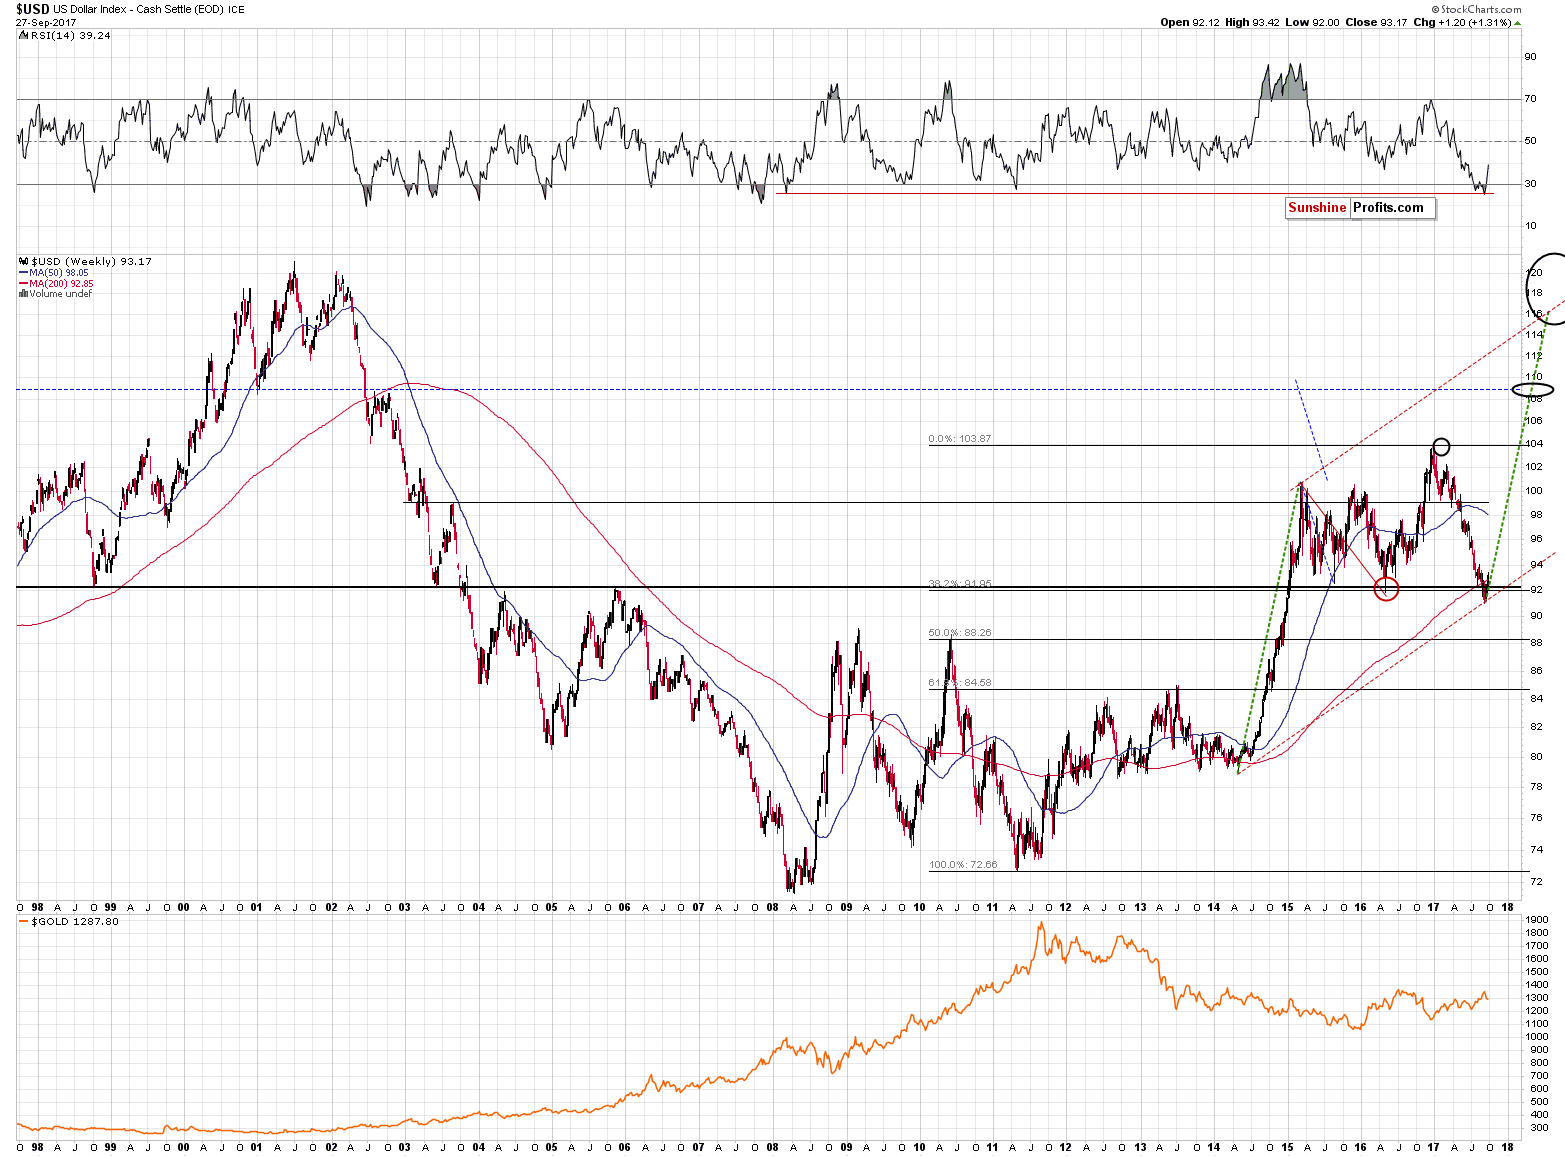
From the long-term point of view, the action that we’re seeing this week is even more important. The USD Index moved above most of the key long-term extremes, thus partially invalidating the previous breakdown. So far only partially, because in the case of the long-term extremes, we would need to see at least one weekly close above these levels to say that they breakdown was truly invalidated. Still, based on what we see on the short-term chart, it’s very likely that we will see the USD Index close, more or less, to where it is right now, or even higher. This would, in turn, trigger very bullish implications from the long-term point of view, making the outlook very bullish for the following weeks and months.
The week is still not over, but there are only 2 more sessions to go and the USD Index is even higher – it’s currently above all of the above-mentioned long-term extremes. The highest of them is the lowest weekly close of 2015 – 93.18. The USD Index is currently already about 0.10 above this level, so it's likely that the week will also close above it and the invalidation of all previous long-term breakdowns will be complete.
The implications for the following weeks and months will be very bullish in this case. This will be in turn bearish for the precious metals sector.
In yesterday’s alert, we wrote the following on gold:
The downtrend seems to continue now as gold is trading at $1,292 at the moment of writing these words and the volume that we saw during yesterday’s downswing was bigger than the volume that we saw during Monday’s upswing.
Overall, gold’s “comeback” above $1,300 lasted for less than 24 hours.
We can say something similar today, with the exception that the gold price is even lower – at $1,283. Moving on to the question from the title of this alert, let’s discuss the likely short- and medium-term targets for gold.
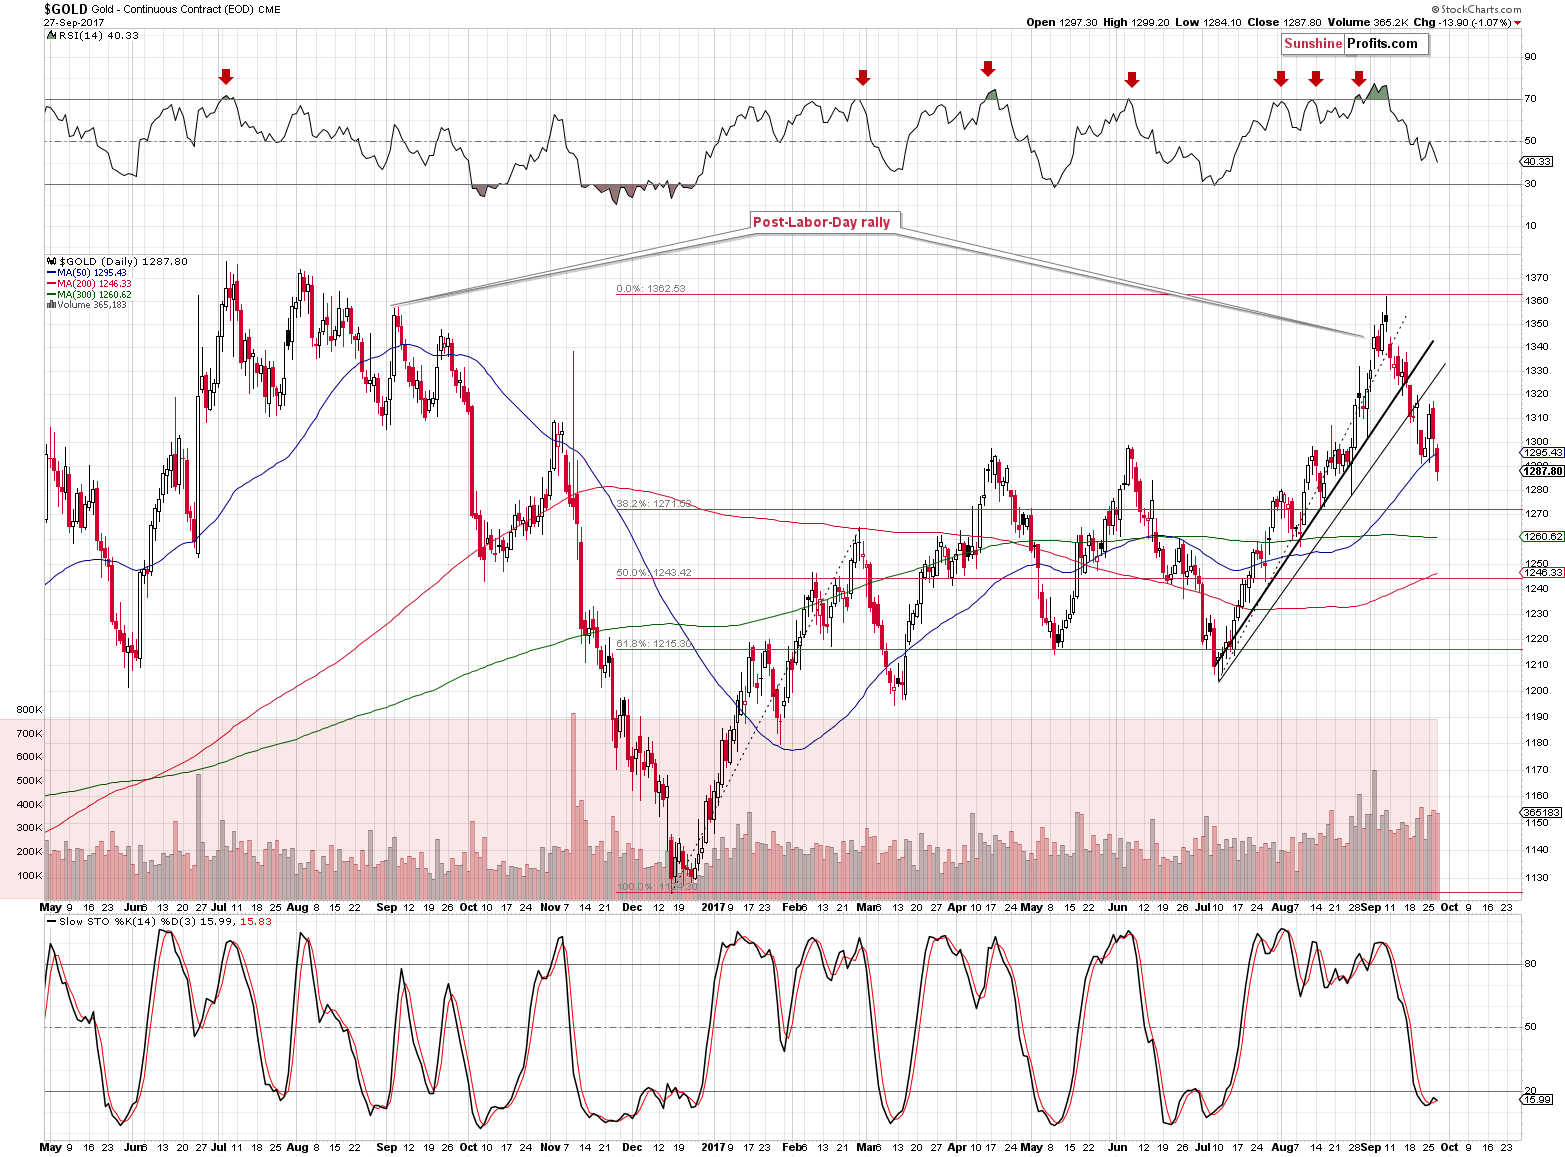
The key thing that we can see on the above chart in terms of the support level is that the price range can be divided into 3 parts: above $1,300, between $1,300 and $1,200 (approximately) and then below $1,200. Once gold moved above or below each of these levels, it tended to move rather quickly to the next level. The exception here is the recent rally above $1,300, which didn’t take gold above the next $100 barrier or the previous highs.
Now, since gold has already moved below the $1,300 and the previous (April, June) highs and seems to be ready to close the week below it, we can assume that the next part of the downswing that we should focus on is the one between $1,300 and $1,200. Is there anything that could stop the decline there? There are the Fibonacci retracement levels based on the December – September rally, but only one of them is reinforced by another important support – the final one, which is close to the $1,200 mark.
The other retracements are at about $1,270 and $1,245, but since no other meaningful support levels adds to their credibility, they are not likely to trigger major upswings.
So, the next short-term (!) target is somewhere in the $1,195 - $1,215 area as that’s where the previous bottoms were and where the 61.8% Fibonacci retracement is located.
This level could trigger a rebound that’s more visible – say to $1,240 or so. It could also be the case that the entire correction takes place within the $1,195 - $1,215 area and gold simply moves from its lower border to the upper one before continuing to decline. Which scenario is more likely will become clearer as we get close to these levels – we’ll know how miners and silver react, how the gold-USD link is performing, where will the indicators, how will all this relate to the cyclical turning points and so on.
After gold moves below the $1,200 zone, it’s likely to slide to the 2016 bottom (about $1,125) - the $1,100 level. The correction could be in this area just as discussed above.
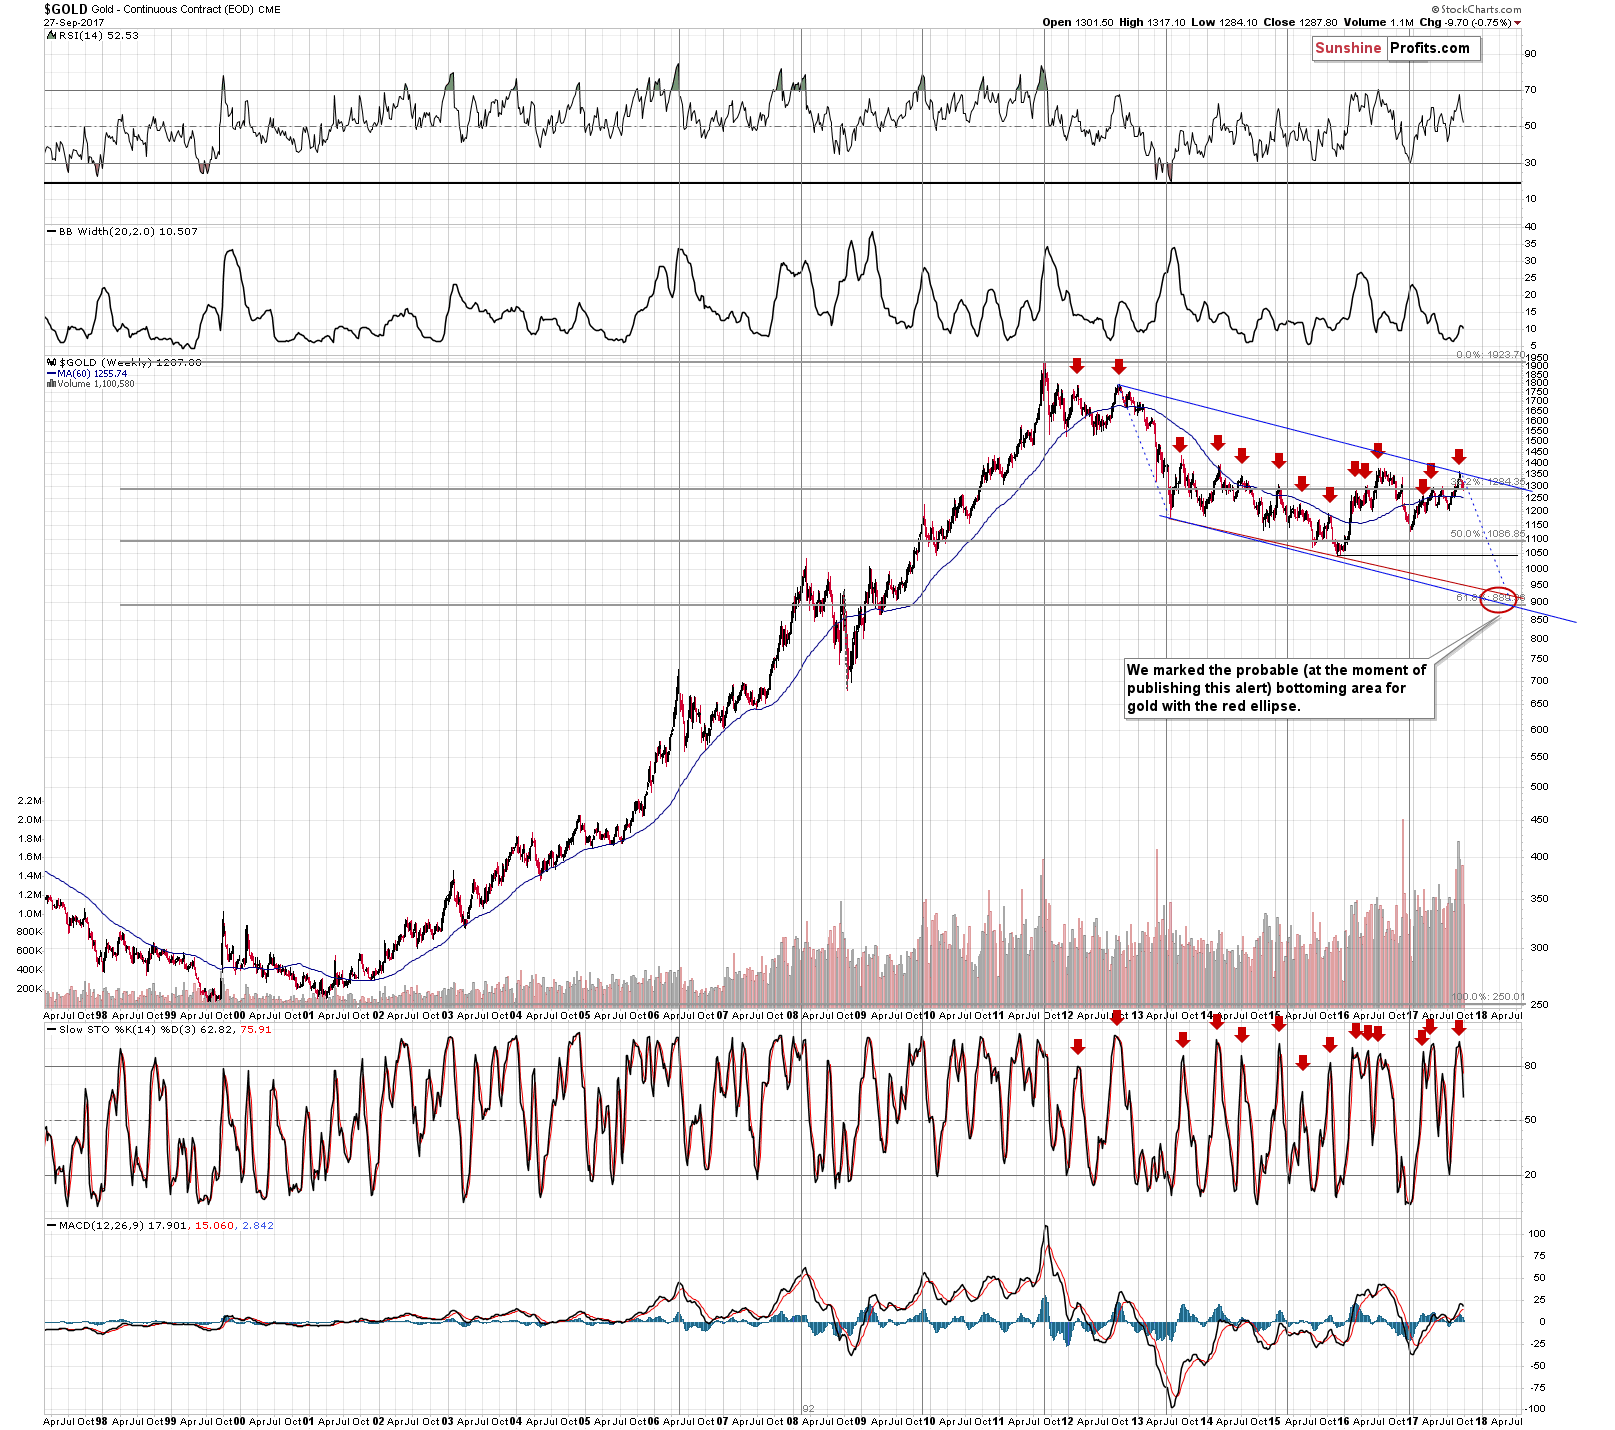
Once gold slides below the above-mentioned level, it’s likely to move to the 2015 bottom, which is the third target area that could trigger a rebound. The final target for the entire the decline is at about $890 level as indicated by the analogy to 2013, declining red support line and the key 61.8% Fibonacci retracement level based on the entire bull market. This level is finally likely to be low enough to trigger extreme pessimism among gold investors and thus create an epic buying opportunity.
The sharpness of gold’s rally and the time of the bottom will to a large extent depend on the action in the USD Index. The interesting thing is that the situation in the USD was as oversold as it was back in 2008 before the huge and sharp run-up that corresponded to the sharpest decline in gold of the past 20 years. If the history is to rhyme, it may not be the best decision to try to time each and every corrective upswing of the upcoming decline – it might be difficult to get back in at better prices as the market’s drop could be sudden.
Summing up, the big rally in the USD Index and the big decline in the precious metals market seems to already be underway. All price moves have periodic corrections and today’s alert features price levels and areas that could trigger gold’s temporary upswings. Let’s keep in mind that even though a given level could trigger a rebound, it may not be worth it to adjust the trading position based on it – the correction could be small and quick and getting back into the trade might be difficult. Whether it seems to be a good idea or not will depend on individual circumstances accompanying gold’s moves to each of the target areas.
The outlook for the precious metals sector remains bearish.
As always, we will keep you – our subscribers – informed.
To summarize:
Trading capital (supplementary part of the portfolio; our opinion): Short positions (150% of the full position) in gold, silver and mining stocks are justified from the risk/reward perspective with the following stop-loss orders and initial target price levels / profit-take orders:
- Gold: initial target price level: $1,063; stop-loss: $1,366; initial target price for the DGLD ETN: $81.88; stop-loss for the DGLD ETN $38.74
- Silver: initial target price: $13.12; stop-loss: $19.22; initial target price for the DSLV ETN: $46.18; stop-loss for the DSLV ETN $17.93
- Mining stocks (price levels for the GDX ETF): initial target price: $9.34; stop-loss: $26.34; initial target price for the DUST ETF: $143.56; stop-loss for the DUST ETF $21.37
In case one wants to bet on junior mining stocks' prices (we do not suggest doing so – we think senior mining stocks are more predictable in the case of short-term trades – if one wants to do it anyway, we provide the details), here are the stop-loss details and initial target prices:
- GDXJ ETF: initial target price: $14.13; stop-loss: $45.31
- JDST ETF: initial target price: $417.04; stop-loss: $43.12
Long-term capital (core part of the portfolio; our opinion): No positions (in other words: cash)
Insurance capital (core part of the portfolio; our opinion): Full position
Important Details for New Subscribers
Whether you already subscribed or not, we encourage you to find out how to make the most of our alerts and read our replies to the most common alert-and-gold-trading-related-questions.
Please note that the in the trading section we describe the situation for the day that the alert is posted. In other words, it we are writing about a speculative position, it means that it is up-to-date on the day it was posted. We are also featuring the initial target prices, so that you can decide whether keeping a position on a given day is something that is in tune with your approach (some moves are too small for medium-term traders and some might appear too big for day-traders).
Plus, you might want to read why our stop-loss orders are usually relatively far from the current price.
Please note that a full position doesn’t mean using all of the capital for a given trade. You will find details on our thoughts on gold portfolio structuring in the Key Insights section on our website.
As a reminder – “initial target price” means exactly that – an “initial” one, it’s not a price level at which we suggest closing positions. If this becomes the case (like it did in the previous trade) we will refer to these levels as levels of exit orders (exactly as we’ve done previously). Stop-loss levels, however, are naturally not “initial”, but something that, in our opinion, might be entered as an order.
Since it is impossible to synchronize target prices and stop-loss levels for all the ETFs and ETNs with the main markets that we provide these levels for (gold, silver and mining stocks – the GDX ETF), the stop-loss levels and target prices for other ETNs and ETF (among other: UGLD, DGLD, USLV, DSLV, NUGT, DUST, JNUG, JDST) are provided as supplementary, and not as “final”. This means that if a stop-loss or a target level is reached for any of the “additional instruments” (DGLD for instance), but not for the “main instrument” (gold in this case), we will view positions in both gold and DGLD as still open and the stop-loss for DGLD would have to be moved lower. On the other hand, if gold moves to a stop-loss level but DGLD doesn’t, then we will view both positions (in gold and DGLD) as closed. In other words, since it’s not possible to be 100% certain that each related instrument moves to a given level when the underlying instrument does, we can’t provide levels that would be binding. The levels that we do provide are our best estimate of the levels that will correspond to the levels in the underlying assets, but it will be the underlying assets that one will need to focus on regarding the signs pointing to closing a given position or keeping it open. We might adjust the levels in the “additional instruments” without adjusting the levels in the “main instruments”, which will simply mean that we have improved our estimation of these levels, not that we changed our outlook on the markets. We are already working on a tool that would update these levels on a daily basis for the most popular ETFs, ETNs and individual mining stocks.
Our preferred ways to invest in and to trade gold along with the reasoning can be found in the how to buy gold section. Additionally, our preferred ETFs and ETNs can be found in our Gold & Silver ETF Ranking.
As a reminder, Gold & Silver Trading Alerts are posted before or on each trading day (we usually post them before the opening bell, but we don't promise doing that each day). If there's anything urgent, we will send you an additional small alert before posting the main one.
=====
Latest Free Trading Alerts:
xxx
Yellen’s Speech in Cleveland and Gold
xxx
S&P 500 At New Record High, Will It Continue Higher?
=====
Hand-picked precious-metals-related links:
PRECIOUS-Gold hits over 1-month low; palladium races past platinum
Gold Is on Track for the Worst Month of 2017
Platinum, palladium hit price parity for first time in 16 years
India May Have a Spot Gold Exchange in 12 to 18 Months
India continues to play a key role in global Silver market
=====
In other news:
Inflation Is No Mystery to the Bond Market
Trump’s Tax Cuts Seen Producing Short Job Growth ‘Sugar High’
U.S. still on slow growth, low inflation track -Fed's Bullard
Cramer Explains Why Mega-Large-Cap Stocks Tend To Sell Off For No Reason
=====
Thank you.
Sincerely,
Przemyslaw Radomski, CFA
Founder, Editor-in-chief, Gold & Silver Fund Manager
Gold & Silver Trading Alerts
Forex Trading Alerts
Oil Investment Updates
Oil Trading Alerts

