

Briefly: In our opinion, full (150% of the regular size of the position) speculative long positions in gold, silver and mining stocks are justified from the risk/reward perspective at the moment of publishing this alert.
It was only a few days ago that we saw a reversal to the upside that made the outlook bullish and we have already seen the opposite of it – the prices of gold, silver and – in particular – mining stocks formed a reversal to the downside. Were the bullish implications reversed as well?
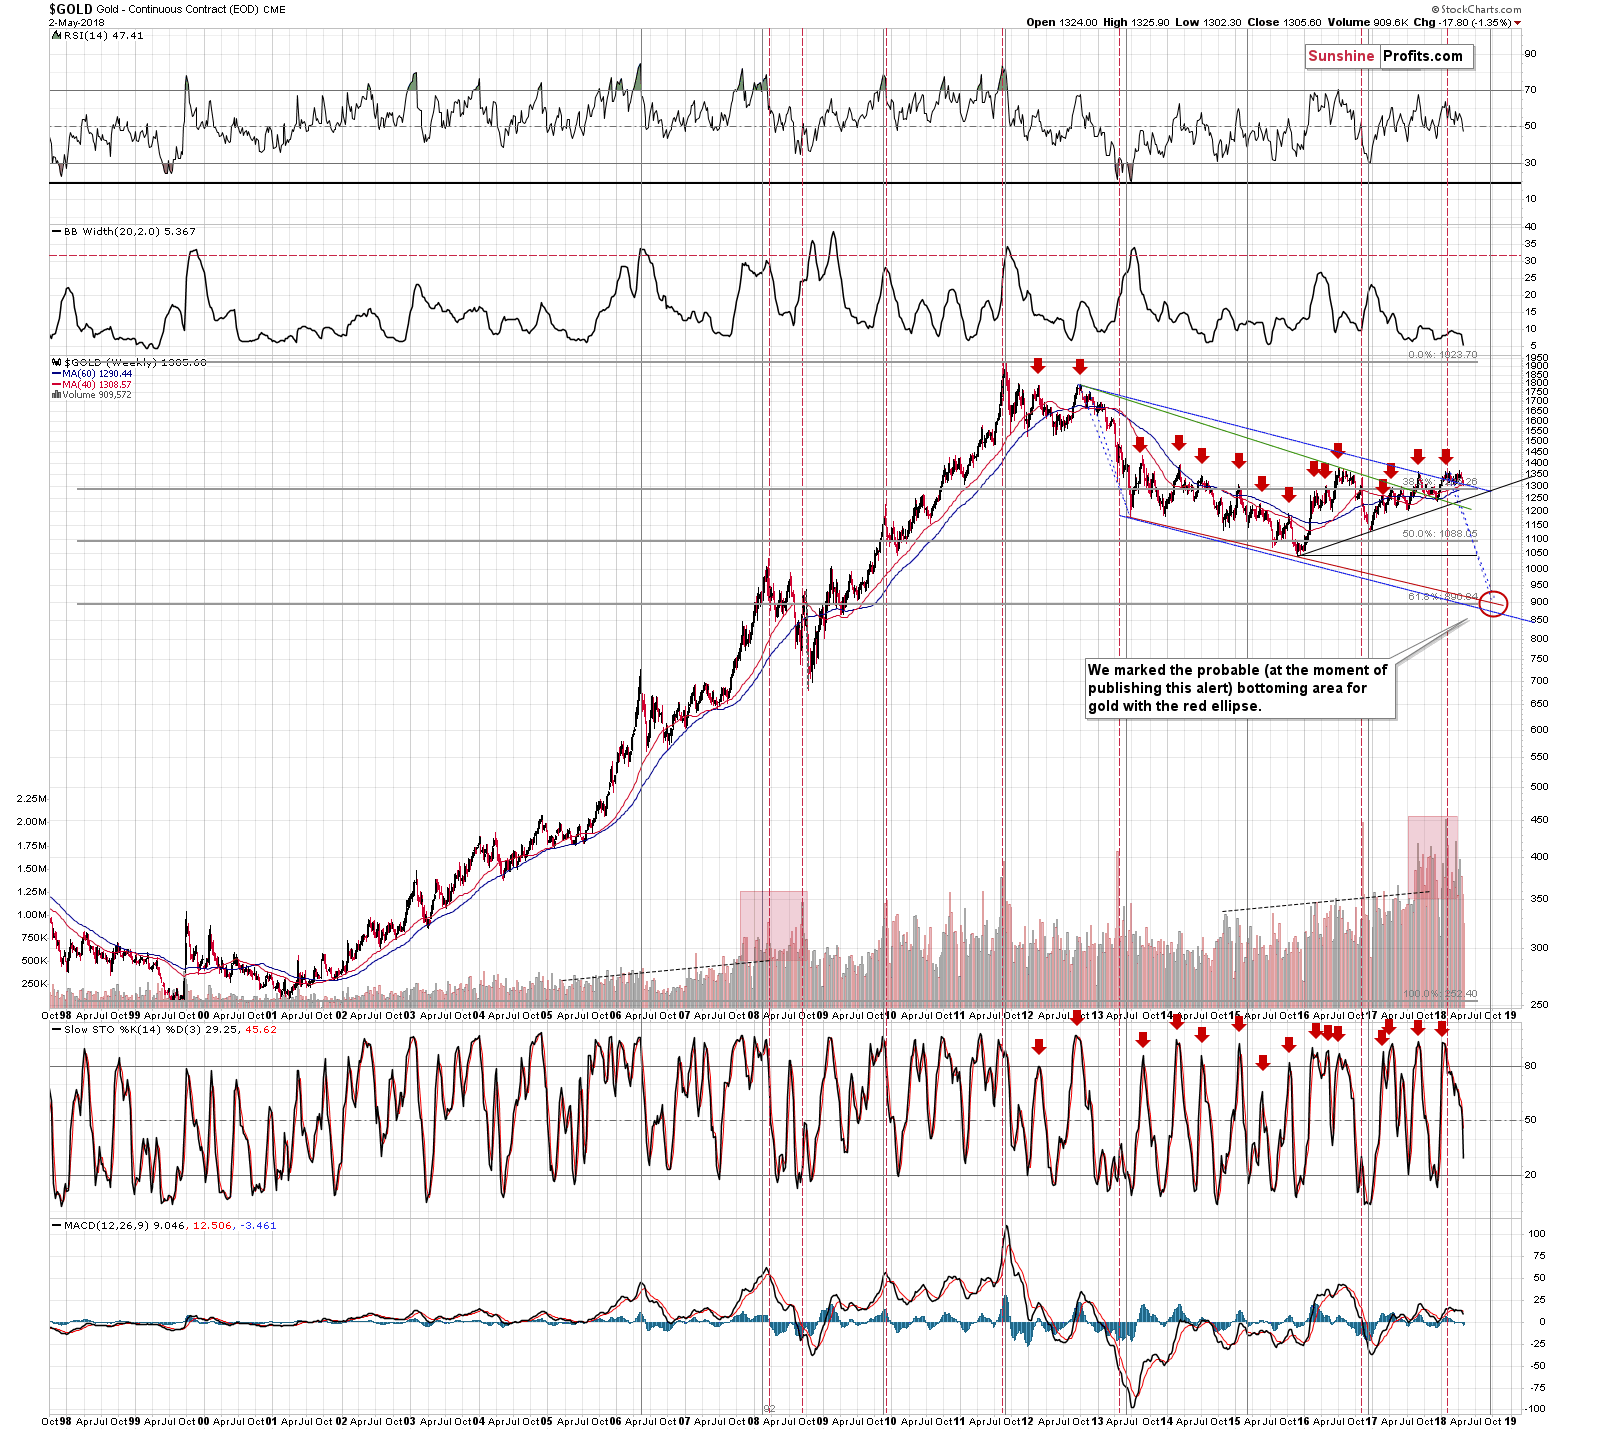
Not really. Let’s take a look at the charts for details, starting with gold (charts courtesy of http://stockcharts.com).
Gold’s Intraday Reversal
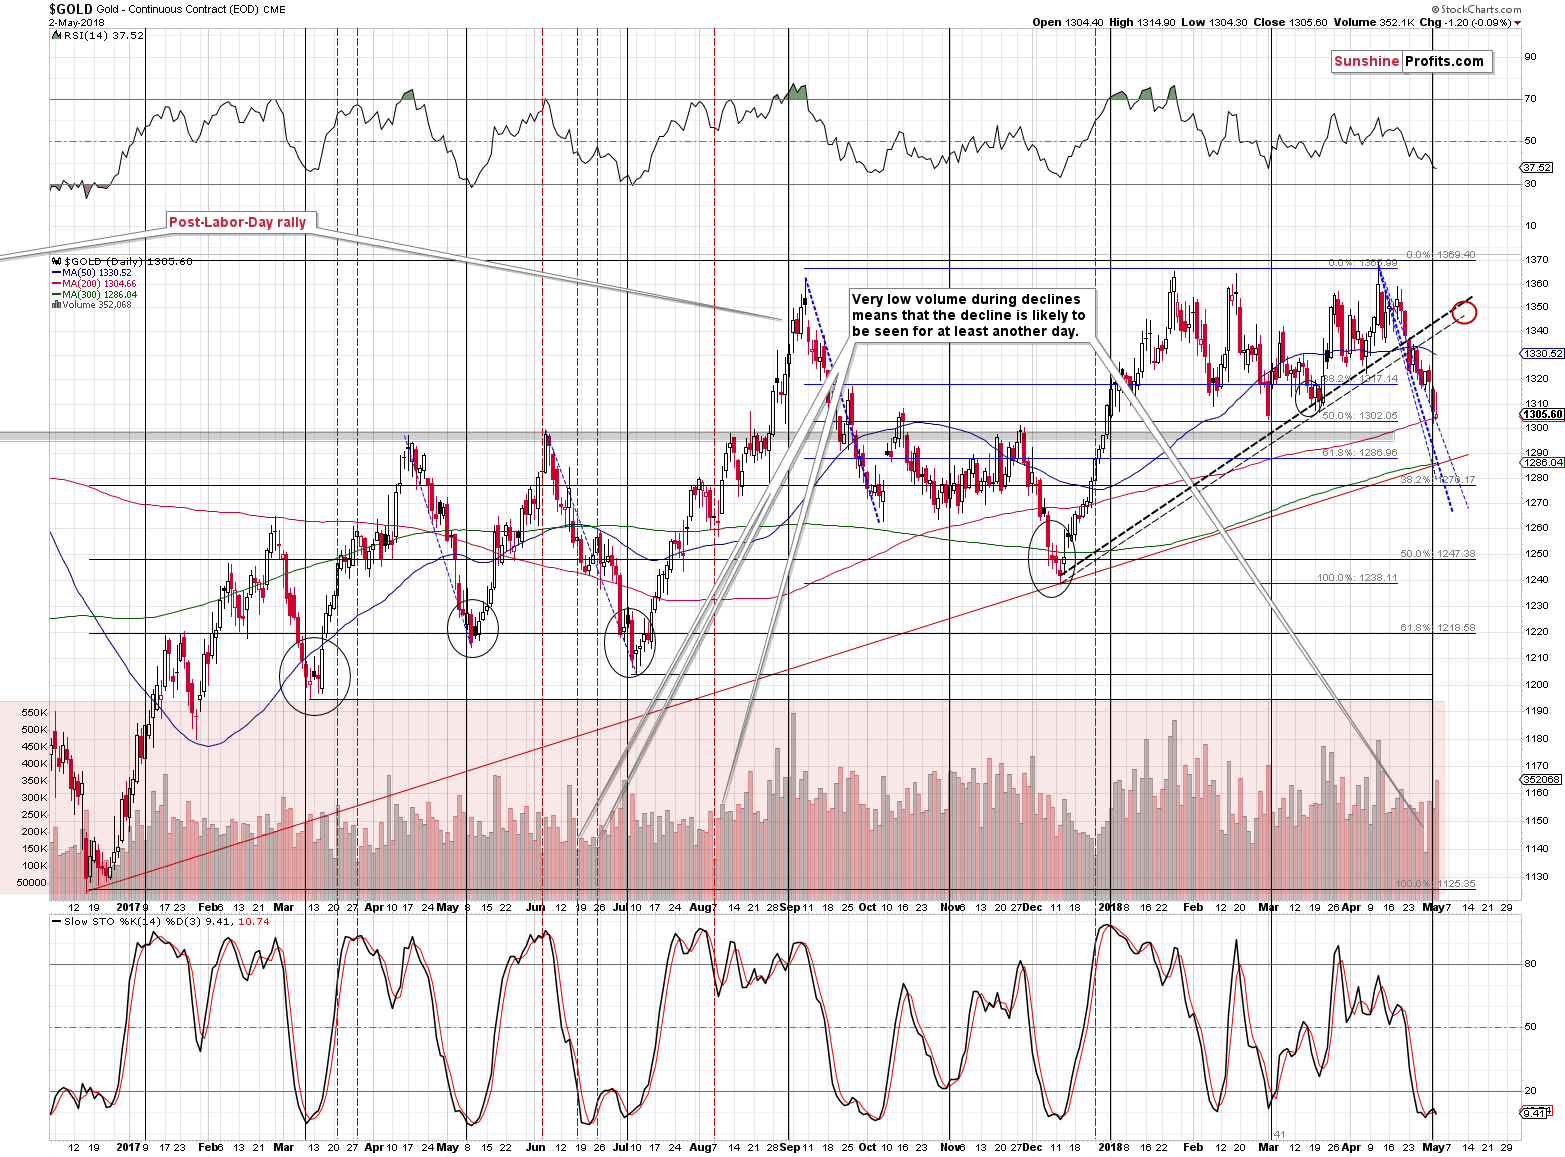
The intraday reversal was not a bearish sign because that’s quite common behavior for gold right after the bottom. We marked similar situations with black ellipses. It turned out that most important bottoms were followed by this kind of reaction. Consequently, there’s nothing bearish about today’s intraday move lower before the end of the session – it’s normal during the early part of an upswing.
It’s still likely that gold will top before the middle of the month and the upside target area is still $1,345 - $1,353.
Silver’s Intraday Reversal
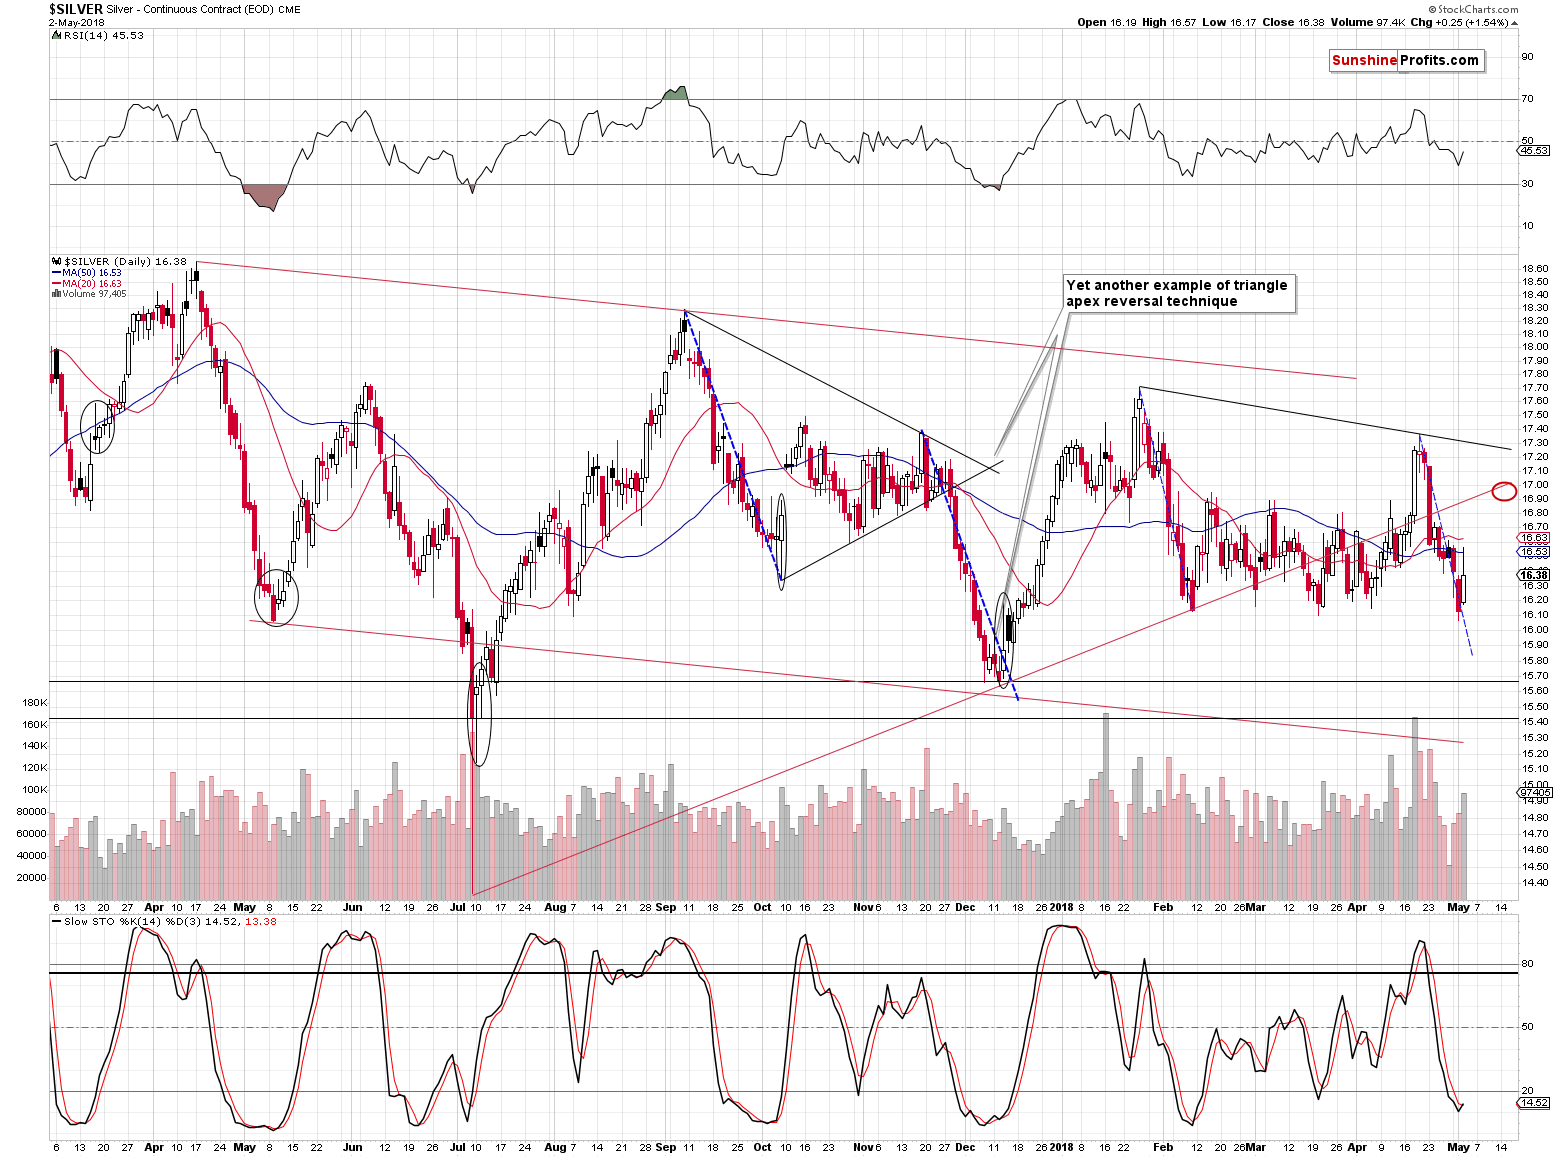
In the case of silver we can say the same thing. The silver rallies were very often preceded by significant intraday volatility and intraday reversals. This week’s action seems most similar to what happened in mid-December 2017 and in mid-March 2017. In both cases, silver rallied shortly thereafter, so the implications are bullish.
The target area is $16.90 - $17.
Gold Stocks’ Intraday Reversal
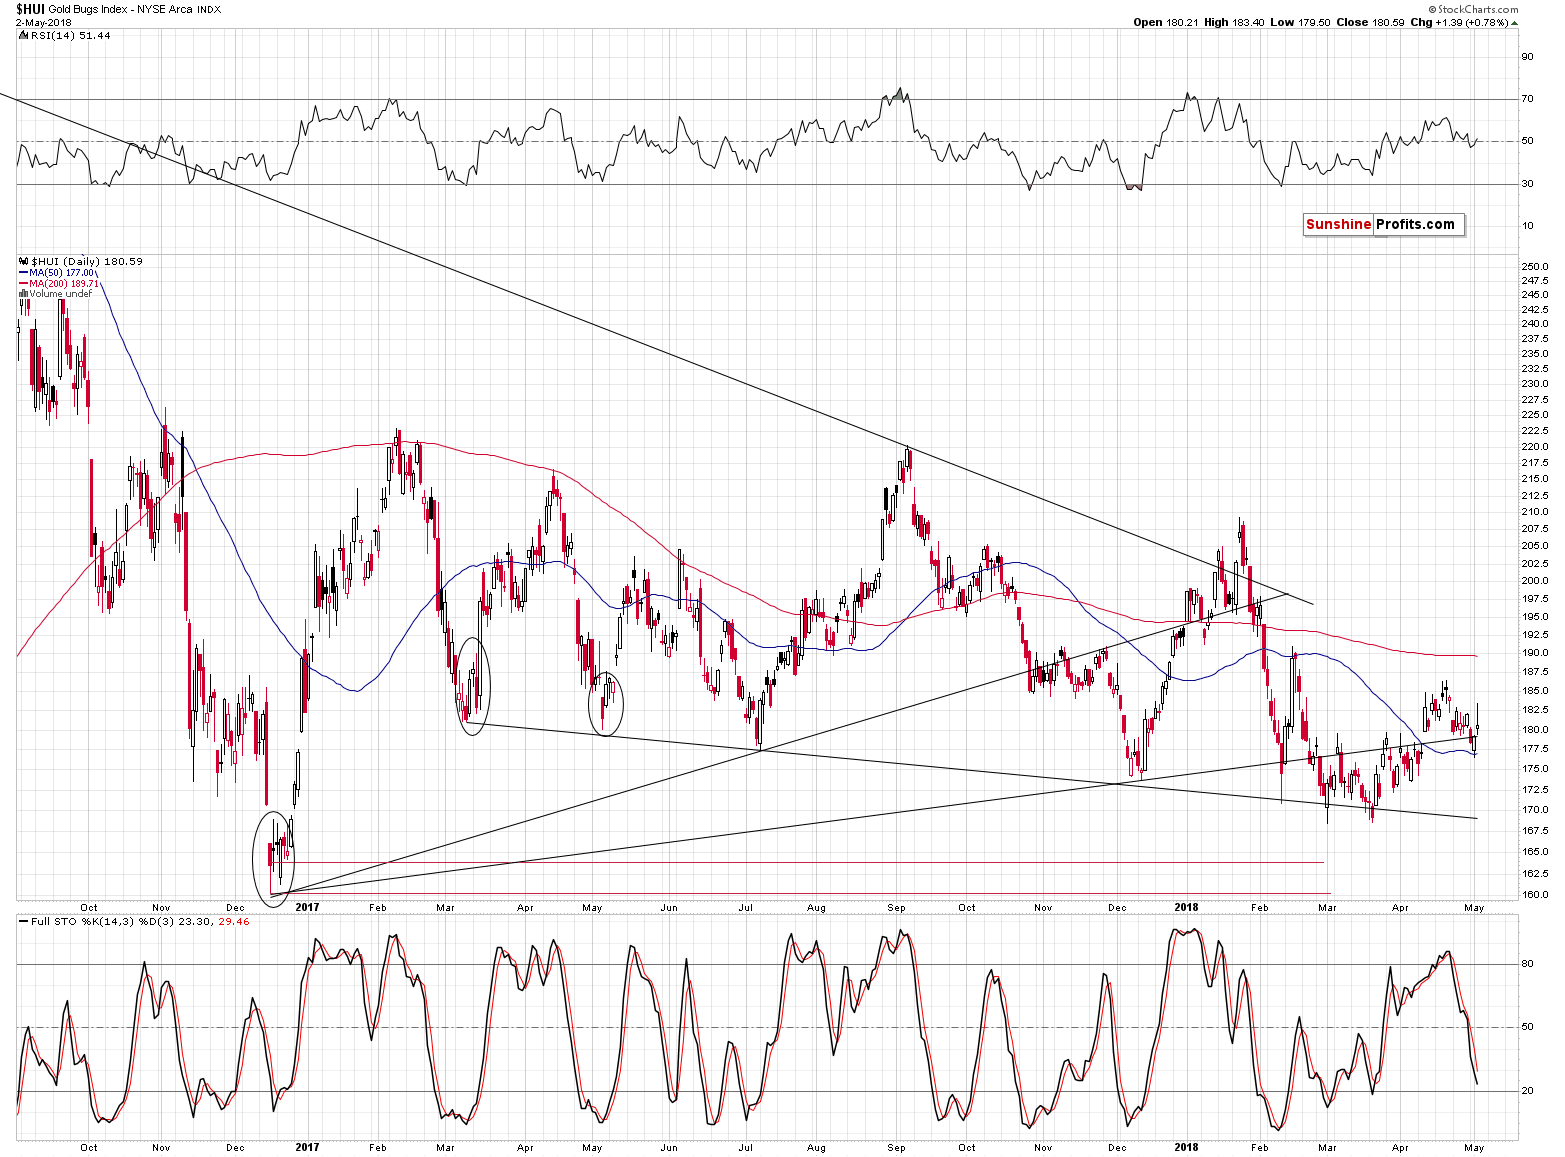
The reversal was most profound in the case of the miners, but it’s also something rather normal. The black ellipses feature similar quick downswings right after the initial rally – that seems to be the normal type of movement, not a sign of a top.
Please note that both silver and mining stocks outperformed gold yesterday. If it had been only silver that outperformed, the implications would have been bearish. But, since the miners also moved higher, the session appears rather normal. Gold might have been more tied to the performance of the USD Index. The latter moved higher, so the fact that gold didn’t decline more visibly is also somewhat bullish.
USD Index at Key Short-term Retracement
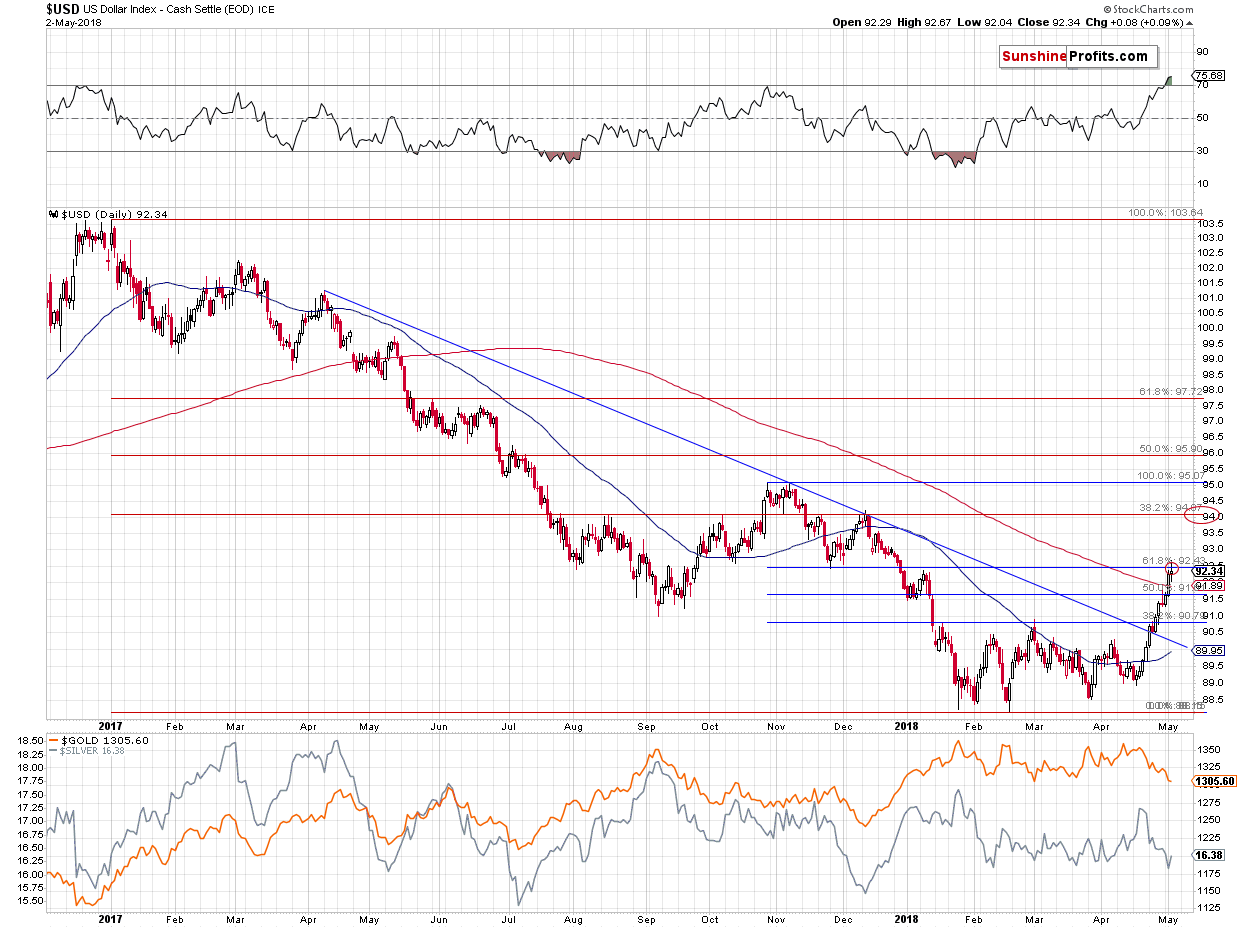
In yesterday’s alert, we commented on the above chart in the following way:
The situation became even more extreme based on yesterday’s move higher, but since the key resistance level (combination of the previous 2018 high and the 61.8% Fibonacci retracement) was approximately reached, it seems that the rally will now stop for a while.
The previous 2018 high (January 9) had been 92.36 and yesterday’s intraday high was 92.37. The USD Index tried to break above it, but the breakout was immediately invalidated. Interestingly, the closing price on January 9 had been 92.26, and yesterday’s closing price was 92.25. So, after a 0.01 intraday breakout, there was a 0.01 comeback below the closing price. A subtle, yet important invalidation sign.
One more thing that we would like to add to yesterday’s analysis is that since the USD moved even higher, it also moved further away from the March high and thus a correction to this level would no longer be something tiny. This means that this level (90.89) is now just as probable as 90.10 as the downside target.
The above remains mostly up-to-date. The thing that needs updating is what we put in bold. Namely, the 61.8% Fibonacci retracement level was clearly reached yesterday, not only approximately.
Moreover, we saw a move to new 2018 high in terms of both: intraday prices and daily closing prices. This may seem bullish, but the USD Index is already moving lower in today’s pre-market trading and the above has already been invalidated. The implications are therefore bearish, not bullish for the short term.
The likelihood of a pullback is also visible at first sight from the very long-term point of view and our yesterday’s comments on this issue remain up-to-date:
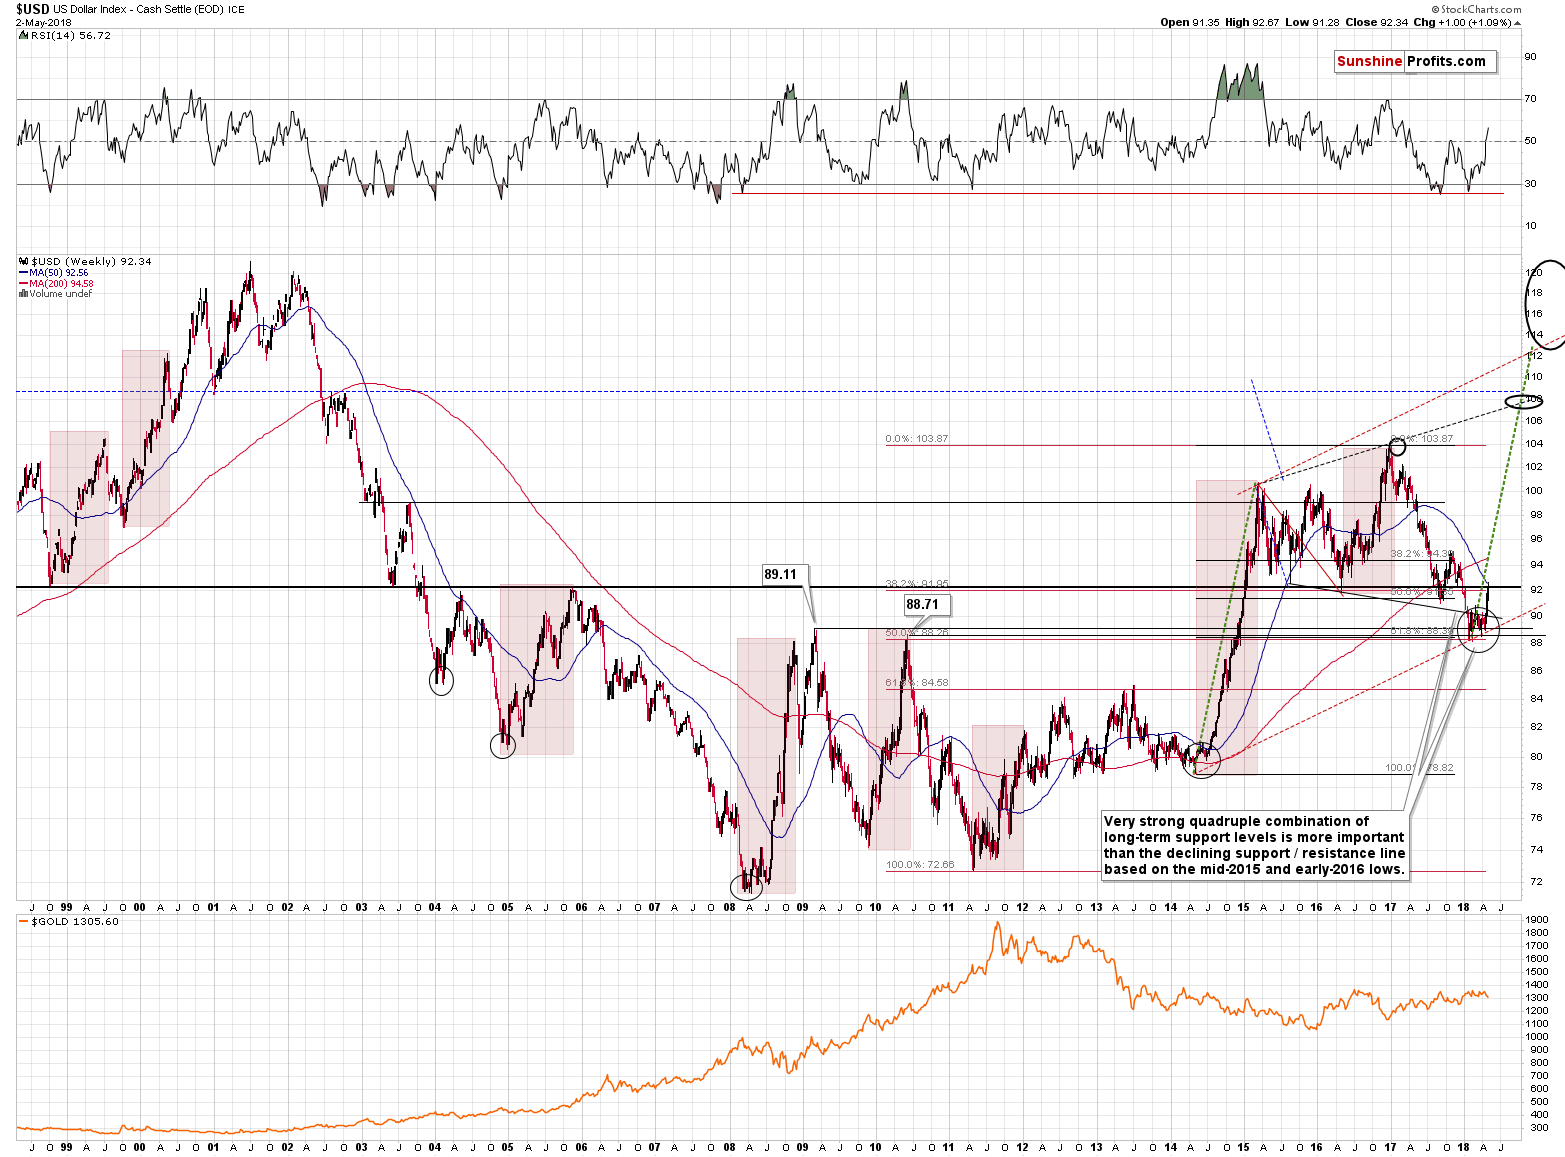
At first sight, it’s clear that the recent rally was extremely sharp. In fact, it was even sharper than the rally which we saw in 2014 and which seems to be repeating (to a considerable extent) right now.
Those who called us crazy for predicting the USD’s rally when it was below 90 for months are probably no longer doing so, as the USD soared even quicker than 4 years ago. But that may be a problem for the short term. Whenever the price gets ahead of itself too fast, it has to correct. The green dashed lines show the similarity between both rallies and the current one also serves as a guideline (pun intended). The first bigger correction in 2014 took place when the USD Index moved close to the green line and that’s what we’re seeing this week. Back then, the USDX moved back to the previous high and verified it as support. We might see something similar also this time and this similarity increases the odds for the decline to be stopped by the proximity of 90.89. In other words, if / when the USD Index moves to about 91, it will be high time to watch the markets for buy signals in the USDX and sell signals in gold, silver, and mining stocks.
Since we’re already discussing USD’s long-term outlook, we would like to take this opportunity to reply to a question that we received recently from our subscriber.
USD’s 16-year Cycles
We were asked to comment on the possibility of the continuation of the USD’s decline in the medium term based on the 16-year cycle. Here’s the entire question:
I came across an article that points out the 16-year cycle of USD showing it
topping in 1985 (164.72), bottoming in 1992 (78.53)
topping in 2001 (121.21), bottoming in 2008 (72.33), and
topping in 2017 (103.82) to be bottom around 2014 (?)
The message is that USD is likely on a downtrend and not uptrend.
What is Sunshine Profits' view of this theory? Perhaps USD will still rise and Gold drop as you forecast, but not much and not for long?
Let’s take a look at the USD’s very long-term chart.
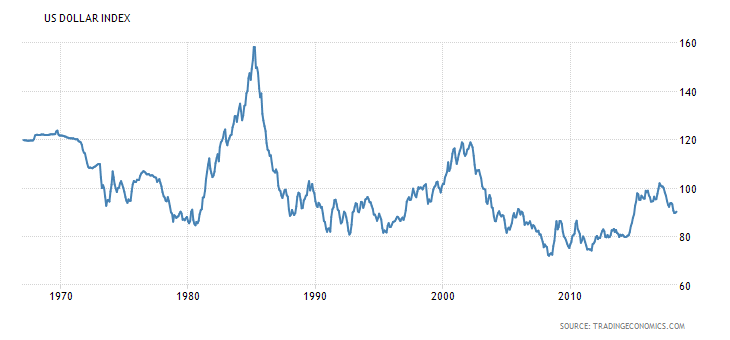
Taking into account the mentioned extremes, we get the following cycles (based on the above data alone):
- Rally from 1980 to 1985 (5 years)
- Decline from 1985 to 1992 (7 years)
- Rally from 1992 to 2001 (9 years)
- Decline from 2001 to 2008 (7 years)
- Rally from 2008 to 2017 (9 years?)
- Decline from 2017 to …
The moves are between 5 and 9 years, thus no matter which type of cycle this will be (5 or 9 years, or perhaps 8 years), the USD Index is likely to decline for at least a few more years and this is a high-quality prediction… Right?
Not really.
Well, it could be the case, but the quality of prediction based on the above is rather low, not high.
There were only two rallies that we can discuss previously, and the length of a rally doesn’t have to be equal to the length of the decline. Indeed – the declines were very similar as both took 7 years, but no rally was very similar – both were 2 years away.
Moreover, the second rally took almost twice as long to be completed as the first one. So, should we really assume regularity here? If there were at least 3 (or better yet, 4 or more) rallies that were similar, we could discuss the level of similarity, but with just two rallies, we can’t reliably say anything. We care too much about our clients to provide analysis without gathering more data.
It’s just as likely that the rallies are taking 7 years on average in a situation in which they take 5 and 9 years interchangeably, or in which their length approximately doubles and we’re looking at about an 18-year rally. Or perhaps the rallies’ length increases by 4 years each time, and we should expect the rally that started in 2008 to take 13 years.
Or maybe the rallies are getting longer, but in a less direct way? Perhaps the rally that started in 2008 is taking just one year longer than the previous one and it will end this year? It’s also possible based on the above dataset.
There are too few observations to justify the bearish implication.
There are also some bullish implications of the analogy to the previous big rallies. Let’s consider the shapes of the moves higher. Both big rallies: the one that started in 1980 and the one that started in 1992, had a correction after the first big run-up and it was approximately after 1/3 and ½ of the entire rally – it was not close to its end. After the 2014 upswing, there was only one visible correction and that’s the one that seems to be ending right now. Thus, it doesn’t seem likely that the rally is ending, but that the pause within it is.
The changes in the effective Federal Funds Rate confirm the above:
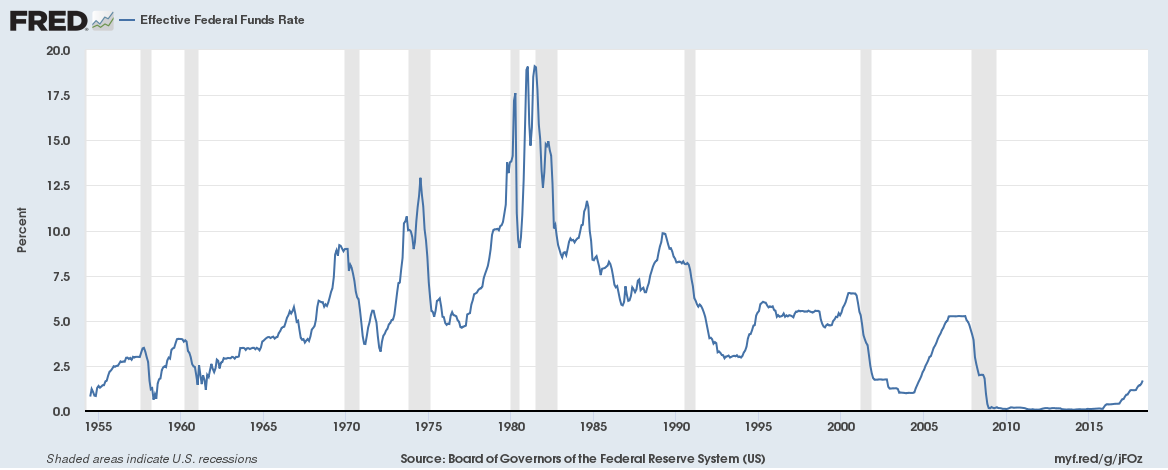
The rally in the 1980s was huge as interest rates soared. The move higher that ended in 2001 was accompanied by more normal increases, which means that the second situation is much more similar to what we’re seeing today. The second rally was 9-years long, so if it takes 10 years or even more for the current rally to complete, it will not be surprising. In fact, it seems likely as both above charts show that the steeper the increase in the rates was, the bigger and quicker the rally was. So, while the USD may not move as high as it did in 2001, based on the above it’s more likely than not that the rally will take more than 9 years.
All in all, we don’t think that the cycles described above have bearish implications for the USD Index in the medium term. There might even be some (rather weak) bullish implications.
In fact, there are major signs suggesting that the next several months (but not weeks) will be very bullish for the USD Index. They are stronger than what we discussed above and we described them in detail 2 months ago. Since it’s been some time, we’d like to provide a brief update on the USD’s long-term breakout. Here’s what we wrote about the USD’s long-term chart in March:
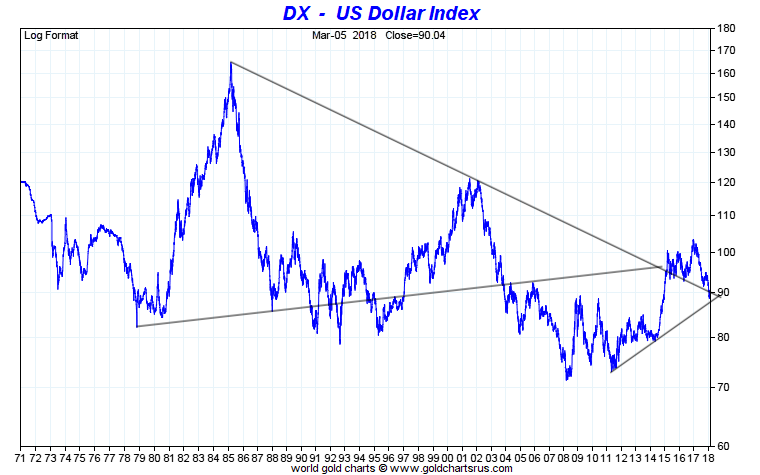
USD’s Key Support
Let’s start with the very long-term declining resistance / support line. It served as resistance but was broken in early 2015 and it served as support since that time. It was touched temporarily and even broken, but all these breakdowns were small and followed by big comebacks shortly. Interestingly, each of the small breakdowns was followed by a bigger upswing than the previous one. At this time the declining support line is at about 90, which is exactly where the USD is currently trading, so it seems that yet another – perhaps final – verification of the 2015 breakout is in progress.
The implications are bullish based on the above analogy and they will be extremely bullish once the USD closes visibly above the 90 level for a few weeks in a row, definitely confirming the comeback. That’s what seems very likely to be seen later this month, but not necessarily this week.
USD’s Major Turnarounds
Finally, the above USD Index chart features two triangle patterns that are based on the key, long-term, declining support / resistance line. These are the only two triangles that we can really draw (at least the ones that make sense) based on it. One has an apex in the past and one in the future. The apex from the past took place at the key 2014 bottom – it was the bottom that started the huge rally that took the index above 100.
The only time when the triangle apex reversal technique had the chance to prove useful, it did, so we have no reason not to view it’s second indication as very important. After all, it’s based on major long-term highs and major long-term lows.
What does the second apex predict? A very important turnaround a few months before the end of the year.
Sounds familiar?
Exactly. That’s when gold is likely to bottom based on the very long-term turning points, the self-similarity to the 2012 – 2013 decline, and gold’s own long-term triangle apex reversal.
It seems we have one more very long-term confirmation of the late September (or early October) bottom target for gold. Naturally, in the case of the USD Index, we would be likely to see a top at that time, not a bottom.
The USD Index has clearly moved above the 90 level and has more than verified it – the very long-term breakout was therefore fully confirmed and verified. The implications for the following months are bullish for the USD and bearish for the precious metals sector.
Summary
Summing up, yesterday’s intraday reversals may appear bearish at first sight, but in reality they are normal in the early parts of short-term rallies in gold, silver and mining stocks. The situation in the USD Index and the Euro Index suggests that we’re seeing the beginning of a corrective downswing and the opposite seems to be in store for the precious metals market. The important thing is that this is most likely not a new medium-term upswing, but rather a short-term, two-week-long move. The long position became profitable almost immediately and it might be tempting to cash in the profits, but this doesn’t seem justified from the risk to reward point of view as the outlook didn’t deteriorate – it’s likely that our profits will increase further before the rally is over.
As always, we will keep you – our subscribers – informed.
To summarize:
Trading capital (supplementary part of the portfolio; our opinion): Full long positions (150% of the full position) in gold, silver and mining stocks are justified from the risk/reward perspective with the following stop-loss orders and initial target price levels:
- Gold: initial target price: $1,338; stop-loss: $1,272; initial target price for the UGLD ETN: $11.68; stop-loss for the UGLD ETN $9.88
- Silver: initial target price: $16.86; stop-loss: $15.49; initial target price for the USLV ETN: $10.68; stop-loss for the USLV ETN $7.88
- Mining stocks (price levels for the GDX ETF): initial target price: $23.18; stop-loss: $21.47; initial target price for the NUGT ETF: $28.38; stop-loss for the NUGT ETF $22.88
In case one wants to bet on junior mining stocks' prices (we do not suggest doing so – we think senior mining stocks are more predictable in the case of short-term trades – if one wants to do it anyway, we provide the details), here are the stop-loss details and initial target prices:
- GDXJ ETF: initial target price: $33.93; stop-loss: $31.38
- JNUG ETF: initial target price: $15.68 stop-loss: $11.88
The stop-loss levels are quite far from the current price, but please note that the aim of the stop-loss is to take the investor off the market if the price move by its own is so meaningful that it changes the outlook. Naturally, if things go against us, we will aim to get out of the market much sooner – for instance based on signals from volume or other tools.
Long-term capital (core part of the portfolio; our opinion): No positions (in other words: cash)
Insurance capital (core part of the portfolio; our opinion): Full position
Important Details for New Subscribers
Whether you already subscribed or not, we encourage you to find out how to make the most of our alerts and read our replies to the most common alert-and-gold-trading-related-questions.
Please note that the in the trading section we describe the situation for the day that the alert is posted. In other words, it we are writing about a speculative position, it means that it is up-to-date on the day it was posted. We are also featuring the initial target prices, so that you can decide whether keeping a position on a given day is something that is in tune with your approach (some moves are too small for medium-term traders and some might appear too big for day-traders).
Plus, you might want to read why our stop-loss orders are usually relatively far from the current price.
Please note that a full position doesn’t mean using all of the capital for a given trade. You will find details on our thoughts on gold portfolio structuring in the Key Insights section on our website.
As a reminder – “initial target price” means exactly that – an “initial” one, it’s not a price level at which we suggest closing positions. If this becomes the case (like it did in the previous trade) we will refer to these levels as levels of exit orders (exactly as we’ve done previously). Stop-loss levels, however, are naturally not “initial”, but something that, in our opinion, might be entered as an order.
Since it is impossible to synchronize target prices and stop-loss levels for all the ETFs and ETNs with the main markets that we provide these levels for (gold, silver and mining stocks – the GDX ETF), the stop-loss levels and target prices for other ETNs and ETF (among other: UGLD, DGLD, USLV, DSLV, NUGT, DUST, JNUG, JDST) are provided as supplementary, and not as “final”. This means that if a stop-loss or a target level is reached for any of the “additional instruments” (DGLD for instance), but not for the “main instrument” (gold in this case), we will view positions in both gold and DGLD as still open and the stop-loss for DGLD would have to be moved lower. On the other hand, if gold moves to a stop-loss level but DGLD doesn’t, then we will view both positions (in gold and DGLD) as closed. In other words, since it’s not possible to be 100% certain that each related instrument moves to a given level when the underlying instrument does, we can’t provide levels that would be binding. The levels that we do provide are our best estimate of the levels that will correspond to the levels in the underlying assets, but it will be the underlying assets that one will need to focus on regarding the signs pointing to closing a given position or keeping it open. We might adjust the levels in the “additional instruments” without adjusting the levels in the “main instruments”, which will simply mean that we have improved our estimation of these levels, not that we changed our outlook on the markets. We are already working on a tool that would update these levels on a daily basis for the most popular ETFs, ETNs and individual mining stocks.
Our preferred ways to invest in and to trade gold along with the reasoning can be found in the how to buy gold section. Additionally, our preferred ETFs and ETNs can be found in our Gold & Silver ETF Ranking.
As a reminder, Gold & Silver Trading Alerts are posted before or on each trading day (we usually post them before the opening bell, but we don't promise doing that each day). If there's anything urgent, we will send you an additional small alert before posting the main one.
=====
Hand-picked precious-metals-related links:
Gold demand at weakest in first quarter since 2008 financial crisis
Trump Ire Stokes Gold Trade in Iran as Rial Hits Record Low
=====
In other news:
Ukraine to mirror U.S. sanctions on Russian tycoons
Chinese Nobel widow Liu Xia ready to 'die at home' in protest
=====
Thank you.
Sincerely,
Przemyslaw Radomski, CFA
Founder, Editor-in-chief, Gold & Silver Fund Manager
Gold & Silver Trading Alerts
Forex Trading Alerts
Oil Investment Updates
Oil Trading Alerts

