

Briefly: In our opinion, no speculative short positions in gold, silver and mining stocks is justified from the risk/reward perspective at the moment of publishing this alert.
Gold and silver declined yesterday, but mining stocks closed the session higher, outperforming the underlying metals. As you know, that’s a sign of strength and a bullish factor. What does it imply for this week? In addition to a reply to the above question, in today’s alert we discuss if the 1980s analogy to the 2011-today decline is still up-to-date and we feature a major discovery regarding the very long-term USD chart. There’s something on it that’s critical and easy to see… But only after you notice it – and most analysts, let alone investors, don’t look past the a-few-years time frame.
As disappointing as it may sound – yesterday’s daily outperformance of mining stocks doesn’t imply anything new. In yesterday’s alert, we already discussed the possibility of gold moving higher this week along with the rest of the precious metals sector and we also discussed the relative performance of mining stocks compared with gold. We wrote the following:
Relative Performance
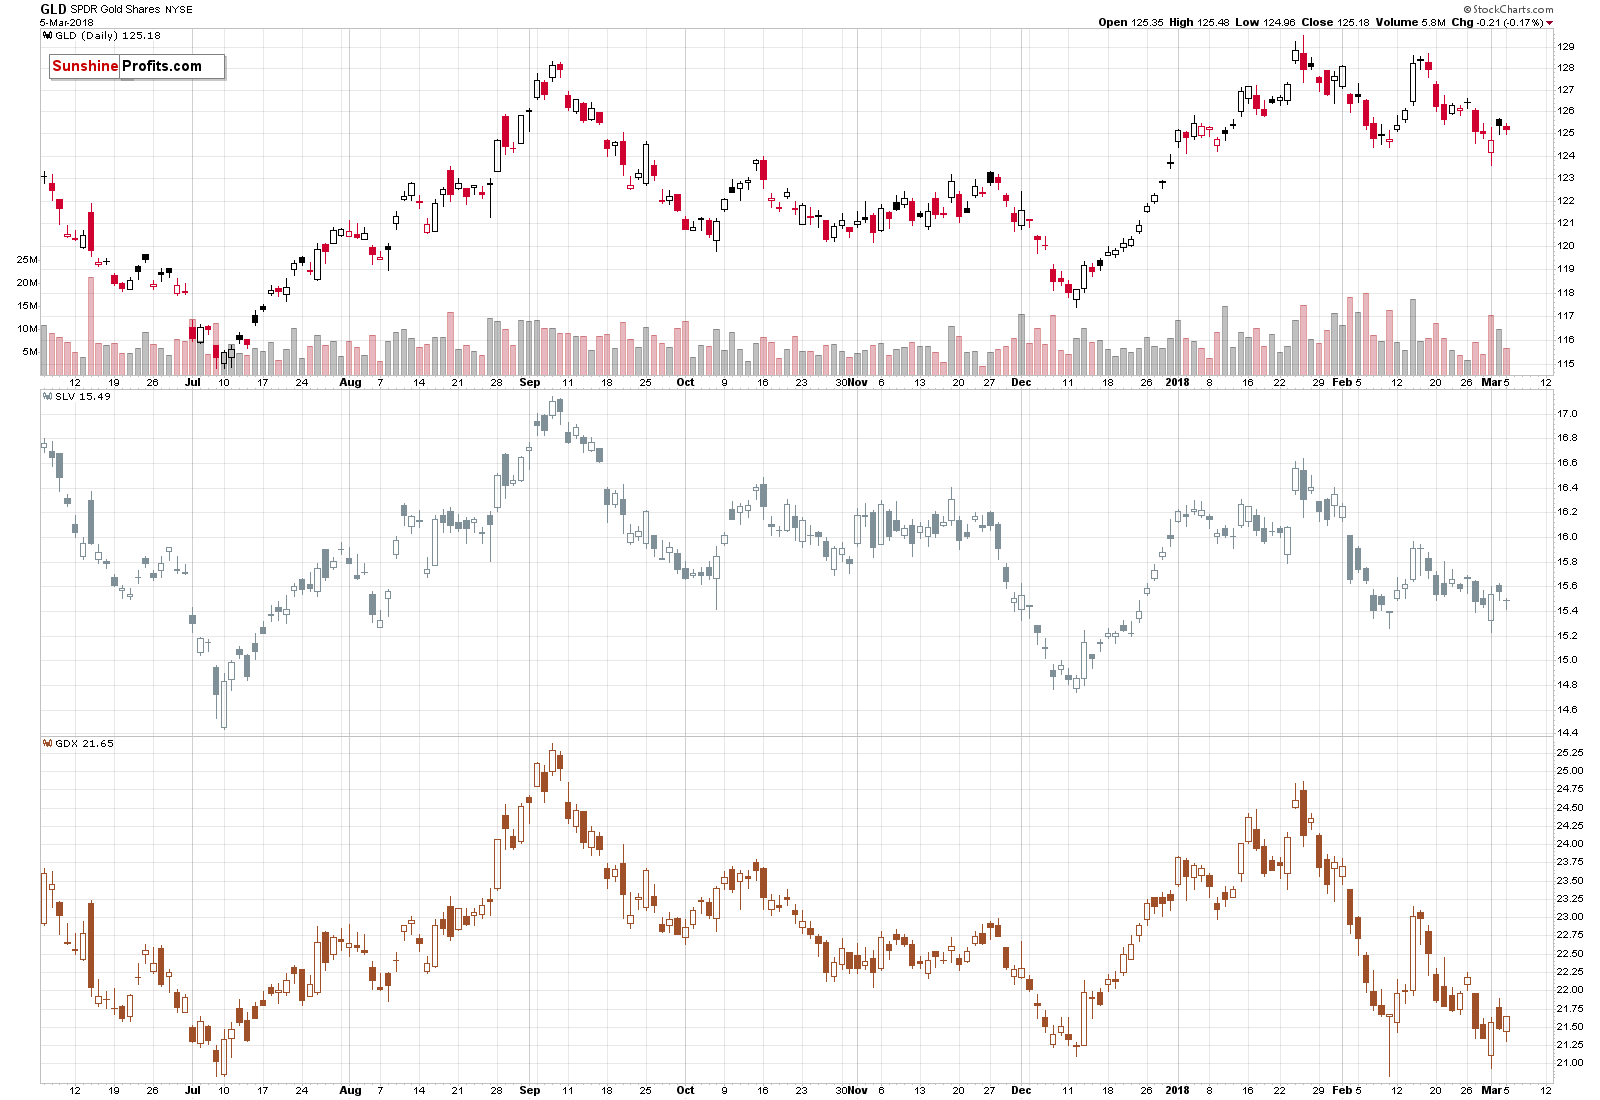
The above chart illustrates how gold, silver and mining stocks performed relative to each other. It seems that the last two trading days provide conflicting signals, so we’ll take the last three trading days into account. By doing so, we get the situation in which GLD and SLV are a bit higher and miners (GDX) are up by only a little. This is a subtle sign showing that the rally in the precious metals sector may not be something huge. If it was, miners would be leading the way in a decisive manner – that’s definitely not the case based on what happened on Friday.
The implications were rather bullish and they remain rather bullish also based on yesterday’s price action. Miners did outperform gold, but since the previous daily outperformance (March 1) was immediately followed by daily underperformance, we have a good reason to be skeptical toward yesterday’s strength. Especially that the general stock market moved higher. The latter is a very good reason for the miners’ outperformance – it doesn’t have to imply any particular level of strength of the precious metals sector.
Consequently, yesterday’s price developments don’t impact the outlook in a meaningful way.
And… That’s about it as far as yesterday’s developments are concerned. Nothing else really happened. We went through our daily list of 100+ charts twice and we didn’t find anything really worth commenting on. But, instead of just calling it a day, we started to wonder if there was anything that we hadn’t discussed in a long time that remained important. There is indeed something like that. While researching this topic once again, we made a very important long-term discovery for the USD Index, so overall we’re very happy with yesterday’s boring session. Let’s start with the update on what we already discussed previously.
Clues from Previous Decline in Gold
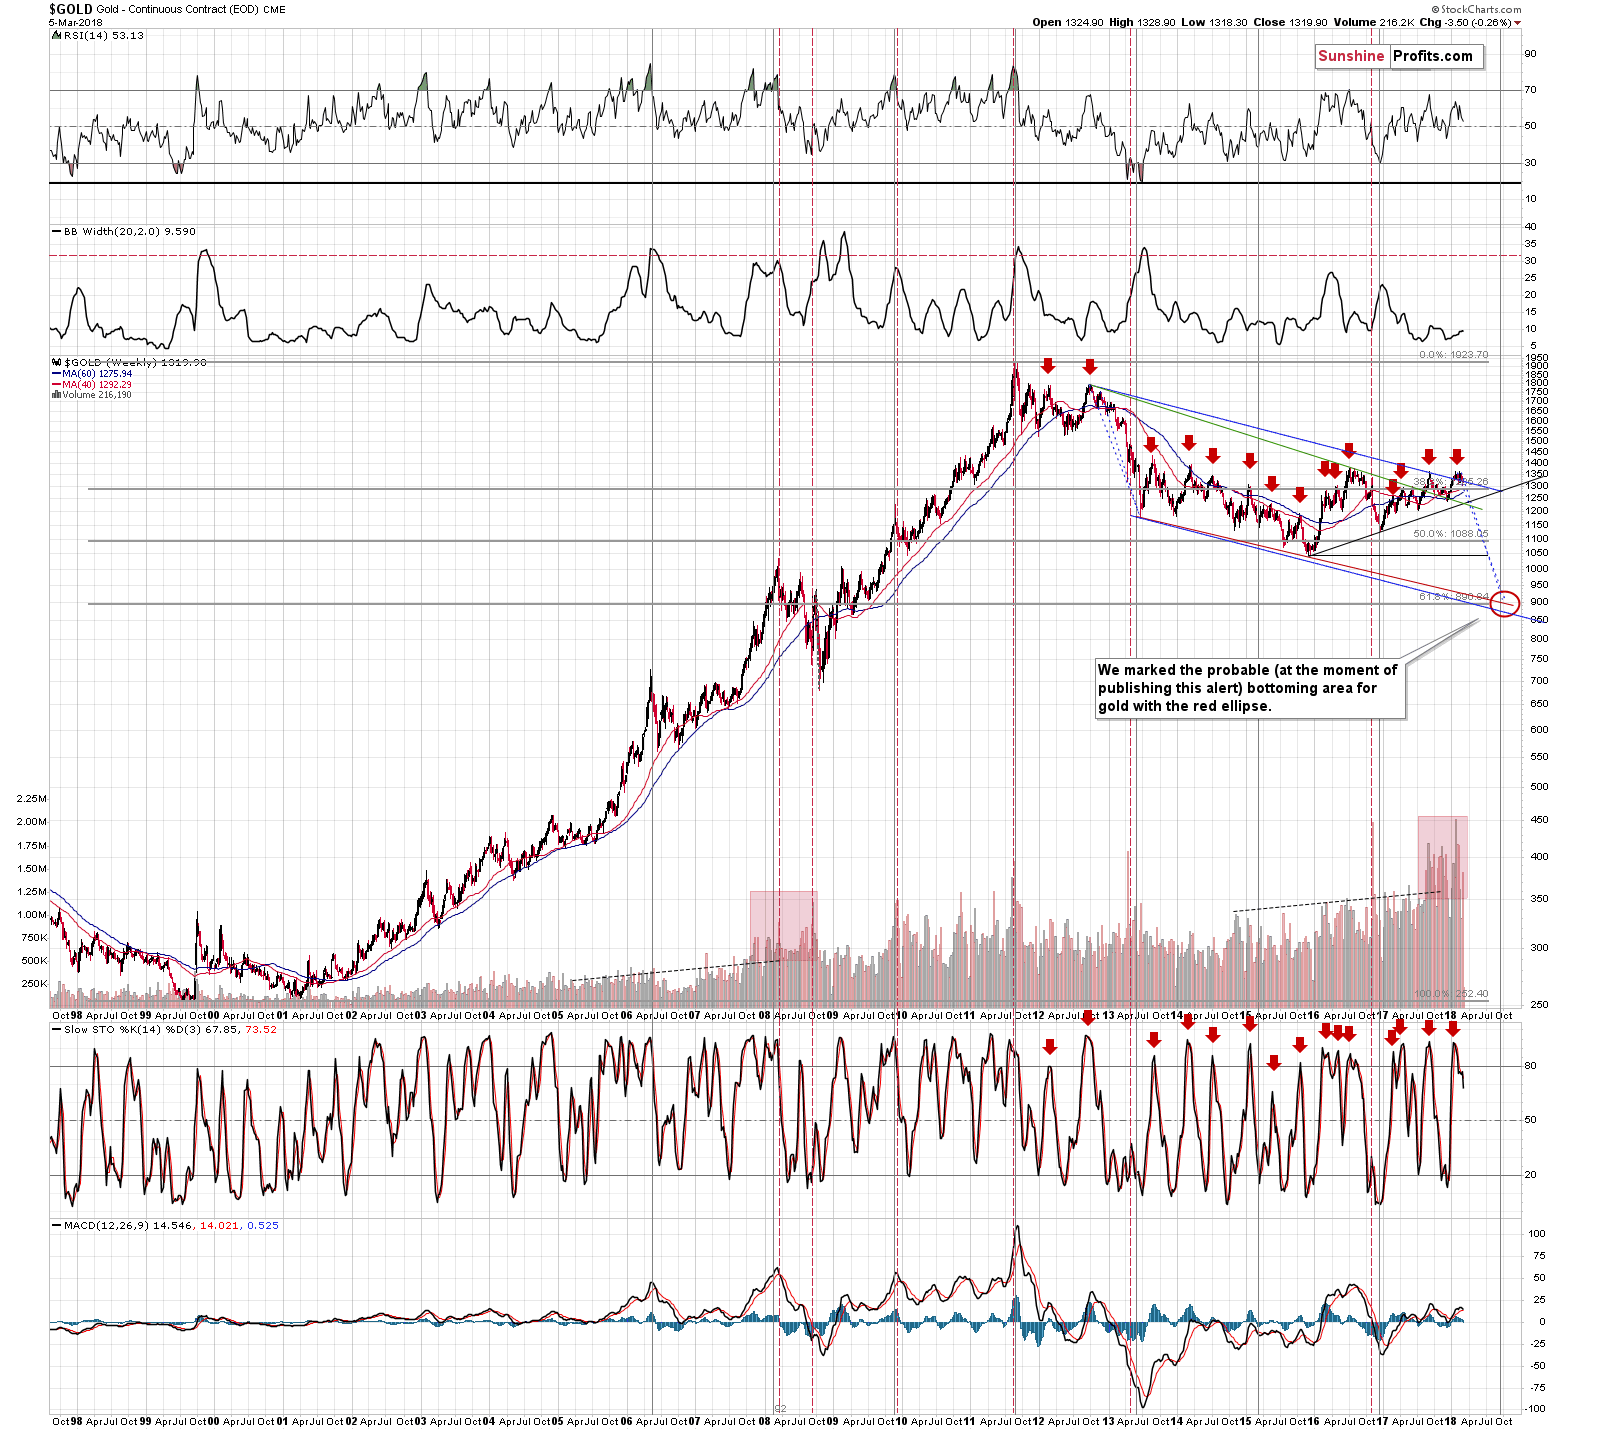
Back in 2016, we discussed the similarity between the way in which gold declined in the 1980s and the way it’s been declining since 2011. We posted the latest update on our thoughts on that matter in November 2017. Here’s what we wrote along with the chart that we commented on:
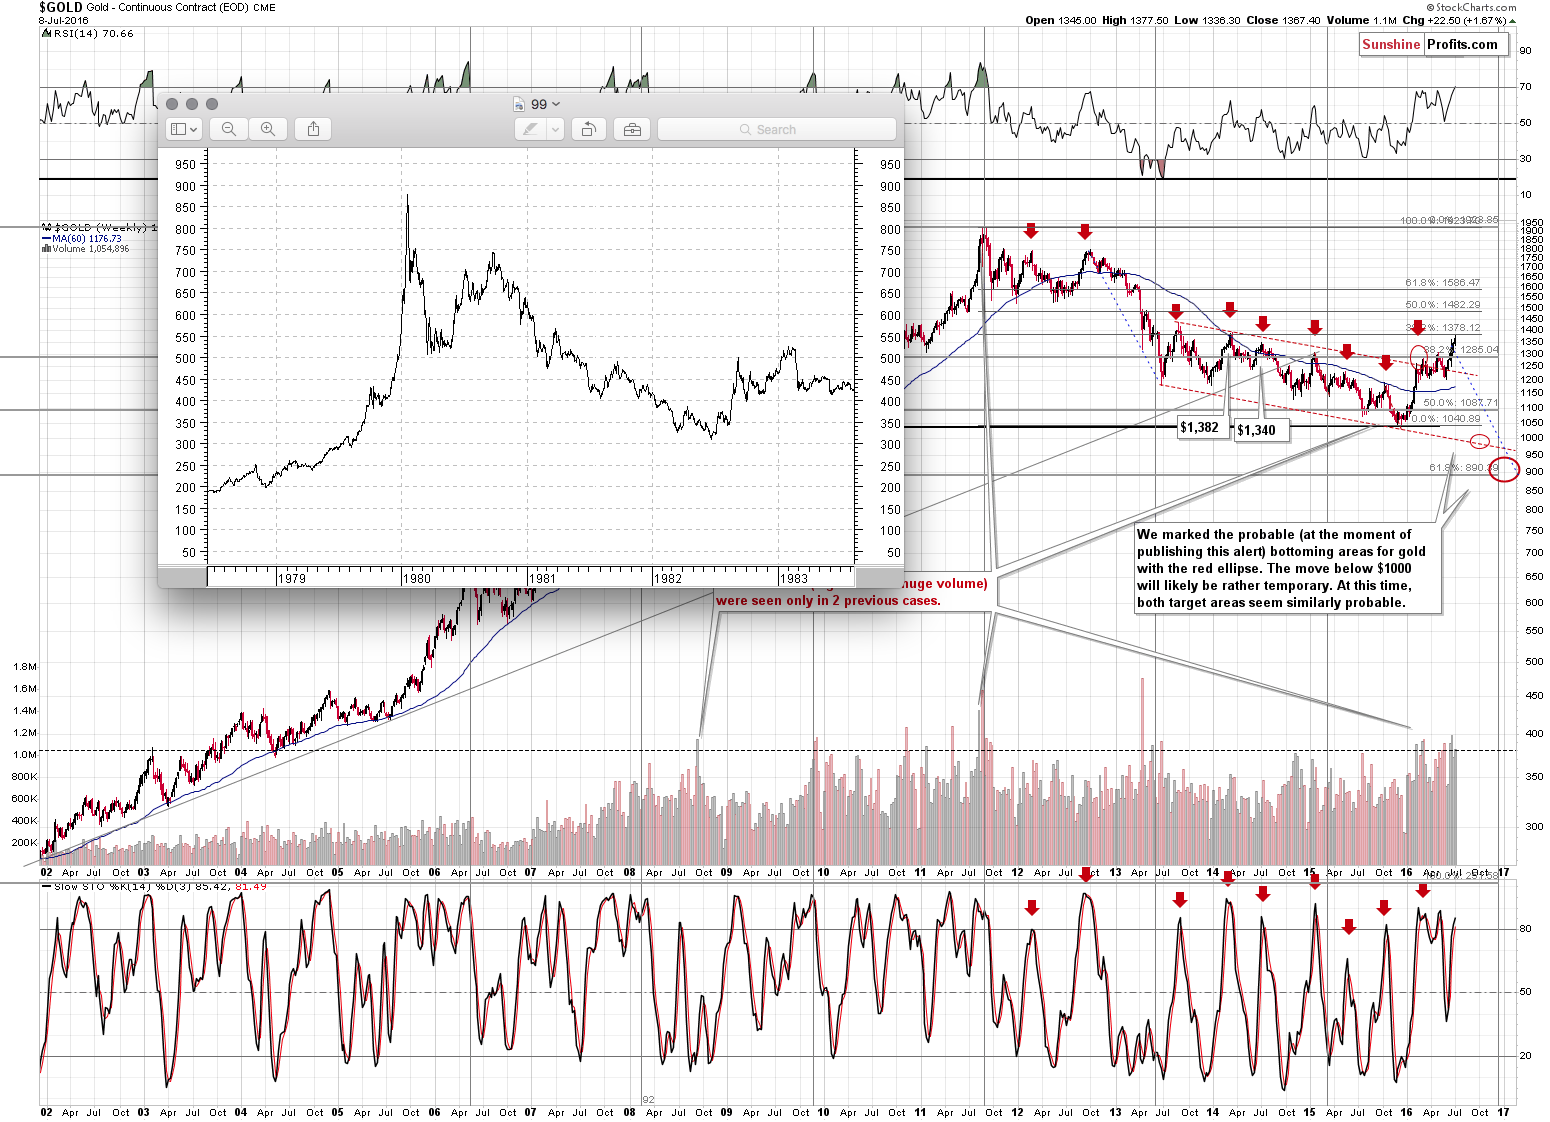
(…) let us re-emphasize that gold tends to repeat its price moves. At times it does it to the letter, but in most cases it is the shape of the move that matters the most. This self-similarity pattern phenomenon can provide a roadmap of the following events – if we detect that we have one that is. There are multiple similarities in the pattern: the parabolic upswing, the 2 tops that followed it, the initial big decline after a breakdown below the initial low, followed by a less steep decline. In both cases after the “final” bottom, the initial rally was very sharp, then we saw some sideways movement and then an additional rally a bit above the previous high.
The above makes the 2 cases very similar already, but that’s not all there is to it. Both post-bottom rallies took a little more than 6 months before the decline resumed. How high did gold rally initially in both cases? More or less to the first visible local high.
The pattern is from the end of the previous bull market (1980 top) and what followed it and while we don’t think the bull market is completely over this time, the emotions that accompanied investors in 1980 are similar to those at the 2011 top. Consequently, there are good reasons to think that the price patterns after these tops can be similar.
What does the similarity mean? That the price pattern is likely to continue, so the follow-up action in the price pattern from the past can tell us a lot about what’s likely to follow.
What is likely to happen next? The same thing – or something very similar to it – that happened in the past after this pattern. In the past, gold rallied only a little above the previous high (the one that formed after the initial sharp rally) and then it topped. After that gold moved to new lows.
(…)
How far did gold decline in 1983 after the top? It finally moved to new lows, but initially it declined more or less to the previous local bottom and applying this to the current situation provides us with $1,200 as the initial target (over $150 lower than the current gold price).
With the benefit of hindsight, we know that gold indeed declined to $1,200 – and even some more. However, let’s keep in mind that if the analogy is to continue at least on an approximate basis, we should be prepared for gold moving to new lows (that is below the 2015 low).
The above analogy remains in place and continues to be yet another reason to expect gold to decline below the 2015 bottom.
So, what’s new regarding the analogy?
The follow-up details.
1980s and 2010s – Really that Different?
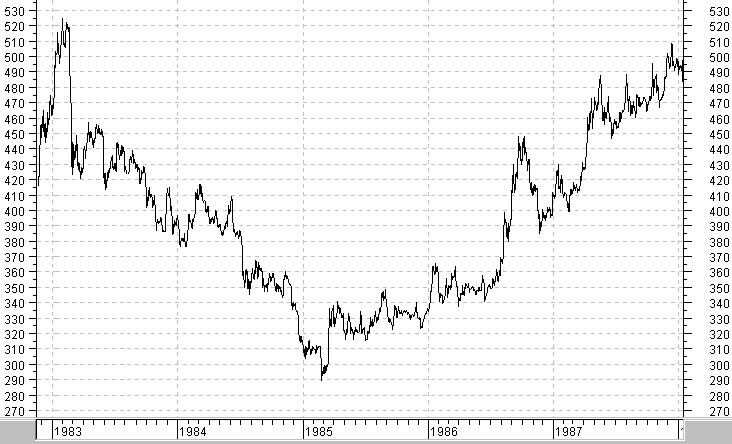
As you can see on the previous chart, the 1983 top is analogous to the 2016 one. The history tends to rhyme rather than to repeat itself, so let’s see if there is anything similar between price actions that followed both tops.
At first sight, it seems that the actions are very different, as back in 1983 and 1984, the price of gold declined steadily, and after the 2016 top it moved lower, but then moved back up, and overall we’ve been seeing back and forth movement instead of a decline.
But is gold really acting differently or is some kind of underlying factor different, but gold is actually showing the same level of strength?
The USD Index was rallying in 1983 and 1984 and it’s been declining in 2017 (and so far in 2018), which serves as an explanation. Back in 1983 and 1984, gold declined along with a rallying USD, but if gold is not rallying in spite of a declining USD, isn’t it showing the same or similar level of weakness? It does. At the moment of writing these words, gold is trading at $1,324. Gold was trading close to this level between June and September 2016 and back then the USD Index was trading between 93 and 97. It’s currently at 89.94. The USD is down, by several index points and gold is unchanged – it’s definitely a sign of weakness.
In fact, if you examine the 1983 and 1984 decline more closely, it turns out that similar back-and-forth movement was seen, only that back then it was seen during a medium-term downtrend.
One thing that the above chart suggests is that gold is unlikely to go anywhere if the USD Index keeps declining. Gold didn’t soar above $1,500, let alone to new highs in 2014, when Russia took over Crimea, and it didn’t manage to do so based on the Brexit announcement (please note that there has been no Brexit so far) or based on the “threats” (we didn’t view them as realistic, but many people did) of nuclear war with North Korea. Gold didn’t even soar based on a massive more than a yearly decline in the value of the USD Index.
Gold is not willing to react to these bullish pieces of information. Why? We said that many tens of times and we’ll say it again. Gold is not ready to start a massive rally, because it hasn’t declined enough, and the sentiment wasn’t negative enough in late 2015. Yes, the corrective upswing that we saw was sizable, but the 2015 low was not “bad” enough to scare gold and silver investors away from their positions – and that’s necessary for the true bottom to form. The bottom was not yet in back then, so a new low is likely coming.
But does it make the price analogy to the 1983 – 1985 decline useless? No, the fact that back in 1985 gold moved to new lows is an important indication that this is something that is likely required for the sentiment to reach the ground-zero levels – something that’s necessary for the true final bottom to form.
Especially that there’s more to the above very long-term USD Index chart than we have already written.
USD’s Key Support
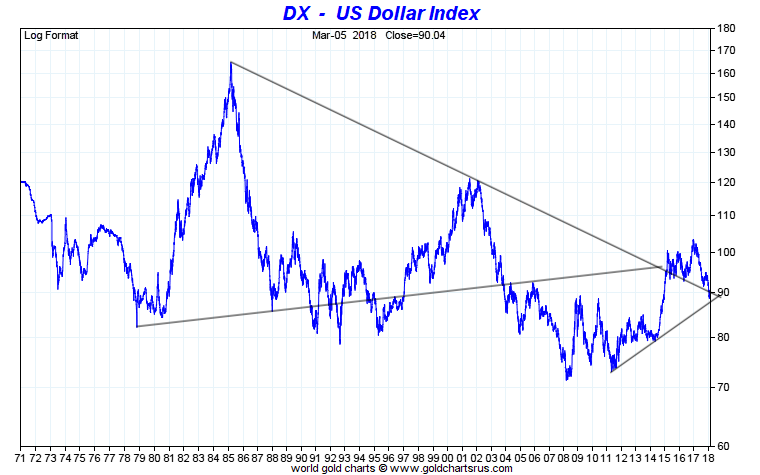
Let’s start with the very long-term declining resistance / support line. It served as resistance but was broken in early 2015 and it served as support since that time. It was touched temporarily and even broken, but all these breakdowns were small and followed by big comebacks shortly. Interestingly, each of the small breakdowns was followed by a bigger upswing than the previous one. At this time the declining support line is at about 90, which is exactly where the USD is currently trading, so it seems that yet another – perhaps final – verification of the 2015 breakout is in progress.
The implications are bullish based on the above analogy and they will be extremely bullish once the USD closes visibly above the 90 level for a few weeks in a row, definitely confirming the comeback. That’s what seems very likely to be seen later this month, but not necessarily this week.
USD’s Major Turnarounds
Finally, the above USD Index chart features two triangle patterns that are based on the key, long-term, declining support / resistance line. These are the only two triangles that we can really draw (at least the ones that make sense) based on it. One has an apex in the past and one in the future. The apex from the past took place at the key 2014 bottom – it was the bottom that started the huge rally that took the index above 100.
The only time when the triangle apex reversal technique had the chance to prove useful, it did, so we have no reason not to view it’s second indication as very important. After all, it’s based on major long-term highs and major long-term lows.
What does the second apex predict? A very important turnaround a few months before the end of the year.
Sounds familiar?
Exactly. That’s when gold is likely to bottom based on the very long-term turning points, the self-similarity to the 2012 – 2013 decline, and gold’s own long-term triangle apex reversal.
It seems we have one more very long-term confirmation of the late September (or early October) bottom target for gold. Naturally, in the case of the USD Index, we would be likely to see a top at that time, not a bottom.
Summary
Summing up, the major top in gold, silver and mining stocks is probably in, but based on last week’s big-volume reversals and invalidations in the case of the USD and gold stocks, it seems that we are likely to see yet another small upswing before the big decline continues. The above perfectly fits into the scenario that we outlined in Monday’s extensive alert, in which gold tops at the apex of the triangle that’s based on intraday prices. This means a top in gold is likely to be seen in a week or so, most likely on Friday.
In the previous alerts we discussed why late September is approximately the time target for gold’s final bottom and based on the long-term USD Index analysis and the apex-based reversal, we have yet another confirmation of this target. It seems that at that time we may see a major top in the USD and a simultaneous major bottom in the prices of precious metals.
As always, we will keep you – our subscribers – informed.
To summarize:
Trading capital (supplementary part of the portfolio; our opinion): No positions in gold, silver and mining stocks are justified from the risk/reward perspective (in other words: cash and/or positions based on our other alerts).
Long-term capital (core part of the portfolio; our opinion): No positions (in other words: cash)
Insurance capital (core part of the portfolio; our opinion): Full position
Important Details for New Subscribers
Whether you already subscribed or not, we encourage you to find out how to make the most of our alerts and read our replies to the most common alert-and-gold-trading-related-questions.
Please note that the in the trading section we describe the situation for the day that the alert is posted. In other words, it we are writing about a speculative position, it means that it is up-to-date on the day it was posted. We are also featuring the initial target prices, so that you can decide whether keeping a position on a given day is something that is in tune with your approach (some moves are too small for medium-term traders and some might appear too big for day-traders).
Plus, you might want to read why our stop-loss orders are usually relatively far from the current price.
Please note that a full position doesn’t mean using all of the capital for a given trade. You will find details on our thoughts on gold portfolio structuring in the Key Insights section on our website.
As a reminder – “initial target price” means exactly that – an “initial” one, it’s not a price level at which we suggest closing positions. If this becomes the case (like it did in the previous trade) we will refer to these levels as levels of exit orders (exactly as we’ve done previously). Stop-loss levels, however, are naturally not “initial”, but something that, in our opinion, might be entered as an order.
Since it is impossible to synchronize target prices and stop-loss levels for all the ETFs and ETNs with the main markets that we provide these levels for (gold, silver and mining stocks – the GDX ETF), the stop-loss levels and target prices for other ETNs and ETF (among other: UGLD, DGLD, USLV, DSLV, NUGT, DUST, JNUG, JDST) are provided as supplementary, and not as “final”. This means that if a stop-loss or a target level is reached for any of the “additional instruments” (DGLD for instance), but not for the “main instrument” (gold in this case), we will view positions in both gold and DGLD as still open and the stop-loss for DGLD would have to be moved lower. On the other hand, if gold moves to a stop-loss level but DGLD doesn’t, then we will view both positions (in gold and DGLD) as closed. In other words, since it’s not possible to be 100% certain that each related instrument moves to a given level when the underlying instrument does, we can’t provide levels that would be binding. The levels that we do provide are our best estimate of the levels that will correspond to the levels in the underlying assets, but it will be the underlying assets that one will need to focus on regarding the signs pointing to closing a given position or keeping it open. We might adjust the levels in the “additional instruments” without adjusting the levels in the “main instruments”, which will simply mean that we have improved our estimation of these levels, not that we changed our outlook on the markets. We are already working on a tool that would update these levels on a daily basis for the most popular ETFs, ETNs and individual mining stocks.
Our preferred ways to invest in and to trade gold along with the reasoning can be found in the how to buy gold section. Additionally, our preferred ETFs and ETNs can be found in our Gold & Silver ETF Ranking.
As a reminder, Gold & Silver Trading Alerts are posted before or on each trading day (we usually post them before the opening bell, but we don't promise doing that each day). If there's anything urgent, we will send you an additional small alert before posting the main one.
=====
Latest Free Trading Alerts:
Major blow to the EU! The populist Five Star Movement won about one-third of the votes in the Italian general elections. It’s another negative shock for the European establishment. Will these stars shine on gold?
=====
Hand-picked precious-metals-related links:
PRECIOUS-Gold prices gain on softer dollar due to trade war fears
Silver industrial demand likely to continue to grow in 2018
=====
In other news:
What the BOJ and ECB Will and Won't Do This Week
Kuroda's tough task: navigating the long road toward stimulus exit
EU Proposes Retaliatory Tariff of 25% Against U.S. Goods
Bitcoin is based on the blockchain pipe dream
Where Will Bitcoin Be in a Decade? $100 Is More Likely Than $100,000, Says Harvard Economist
=====
Thank you.
Sincerely,
Przemyslaw Radomski, CFA
Founder, Editor-in-chief, Gold & Silver Fund Manager
Gold & Silver Trading Alerts
Forex Trading Alerts
Oil Investment Updates
Oil Trading Alerts

