

Briefly: In our opinion, full (200% of the regular size of the position) speculative short positions in gold, silver and mining stocks are justified from the risk/reward perspective at the moment of publishing this alert.
Gold soared by the end of the week. Miners didn’t – the HUI didn’t even move above the previous March highs. Silver’s performance was rather mixed, but closer to the one of miners than the one of gold. Why did gold rally? Why didn’t miners rally? How can the silver CoT numbers help in this case?
Let’s start with the first question. Why did gold rally in the final part of the previous week? The first reason was likely the increased tension regarding interest rates and Powell’s first Fed meeting. This was likely to cause only temporary volatility and it seems that it did. Based on how mining stocks performed relative to the gold market, it certainly seems that the precious metals market wants to go down. But, there’s another fundamental development that triggered another rally in gold (to a smaller extent) – the trade war. This term is too far-fetched – it’s just a trade battle for now. Let’s focus on the practical implications for the precious metals market. In short, just like a few threats between the U.S. and North Korea, the trade tensions between the U.S. and China are a geopolitical event.
Unless the conflict escalates further (and we doubt it), the impact on prices is likely to be only temporary, just like it is the case with geopolitical events in general. The way the price moves from here will depend on two factors: one is based on the way the investors want to react and the second is based on how the safe-haven factor comes into play based on the escalation of the trade conflict. The former is something that we can predict based on the charts and the latter is something that we cannot predict based on the charts and that depends on individual political decisions.
The long-term factors present on the charts are not easily manipulated by short-term developments like the recent news and they don’t feature any changes. The outlook remains clearly bearish.
The short-term factors present on the charts can be impacted by the fundamental issues, but that doesn’t make the short-term chart analysis worthless. Most of the time, the situation develops unaltered and if it is altered – by important news, like it was the case last week – the price path changes from something that was determined by the previous price moves to what is determined by the price moves that include the news-based moves. In other words, technical analysis, cycles and so on do not become useless once something beyond them moves the market. They simply work in a different way. It’s clearly visible on the gold chart below(chart courtesy of http://stockcharts.com).
Gold’s Rally and Price Patterns
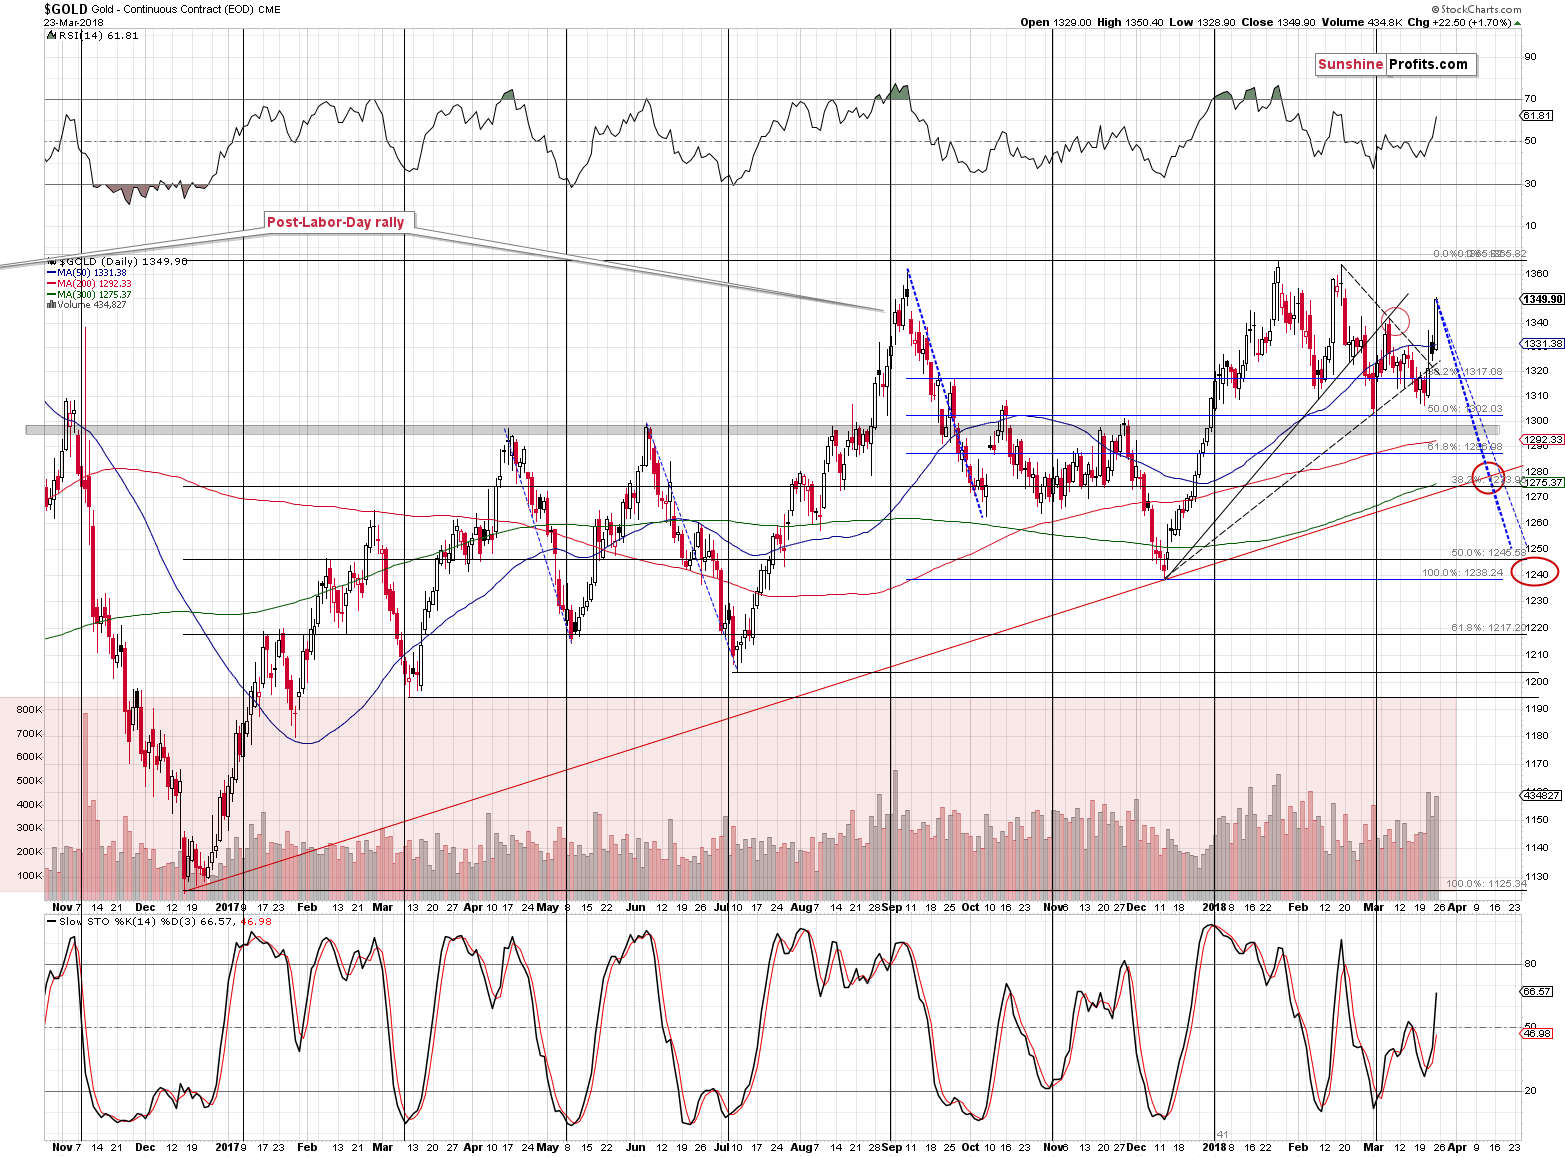
We previously had a situation in which gold was likely to decline and probably bottom before the end of the month. We also described a triple-top and an extra upswing pattern and we discussed how it was similar to what we had seen in the past.
Did any of the above become entirely invalidated based on last week’s upswing?
No. As far as the triple-top formation is concerned, it seems that the current top (the one that’s likely forming) is the third one and the early-March top was not a part of the formation at all. The analogy remains intact, although in a slightly different shape.
The rally didn’t change the apex-based turning points and it didn’t change the fact that the shapes of the declines are often similar. The only thing that changed is the starting point of the decline. Interestingly, if the price of gold declines as it used to decline in the past – in approximately the same way – then we can expect it to reach the rising red support line in the first half of April. That’s in perfect tune with the apex-based turning point. Based on the latter, we expect the next turnaround to be close to April 9th, which is more or less in tune with the shape of the decline.
Consequently, while the situation is no longer likely to develop in tune with earlier expectations, the price level that we described previously is still likely to be reached – only a bit later. Both mentioned techniques that we described earlier remain up-to-date – their implications are simply adjusted based on the newest information.
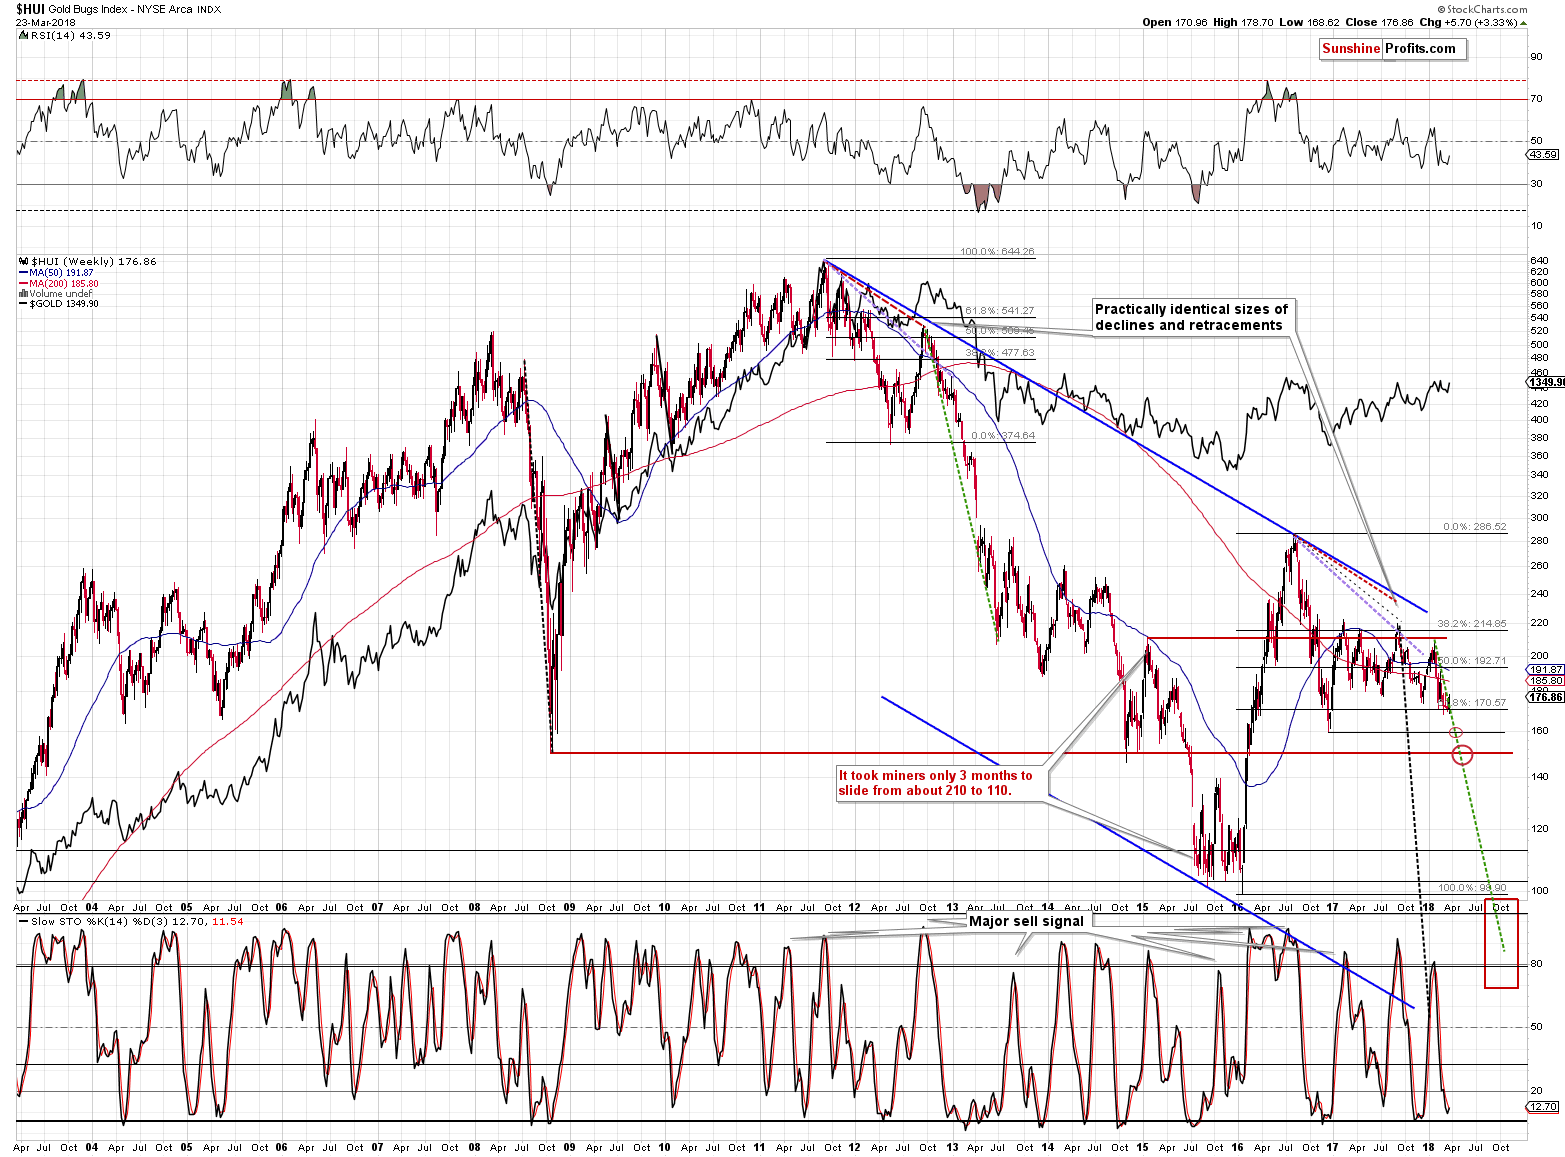
Long-term Resistance Ahead
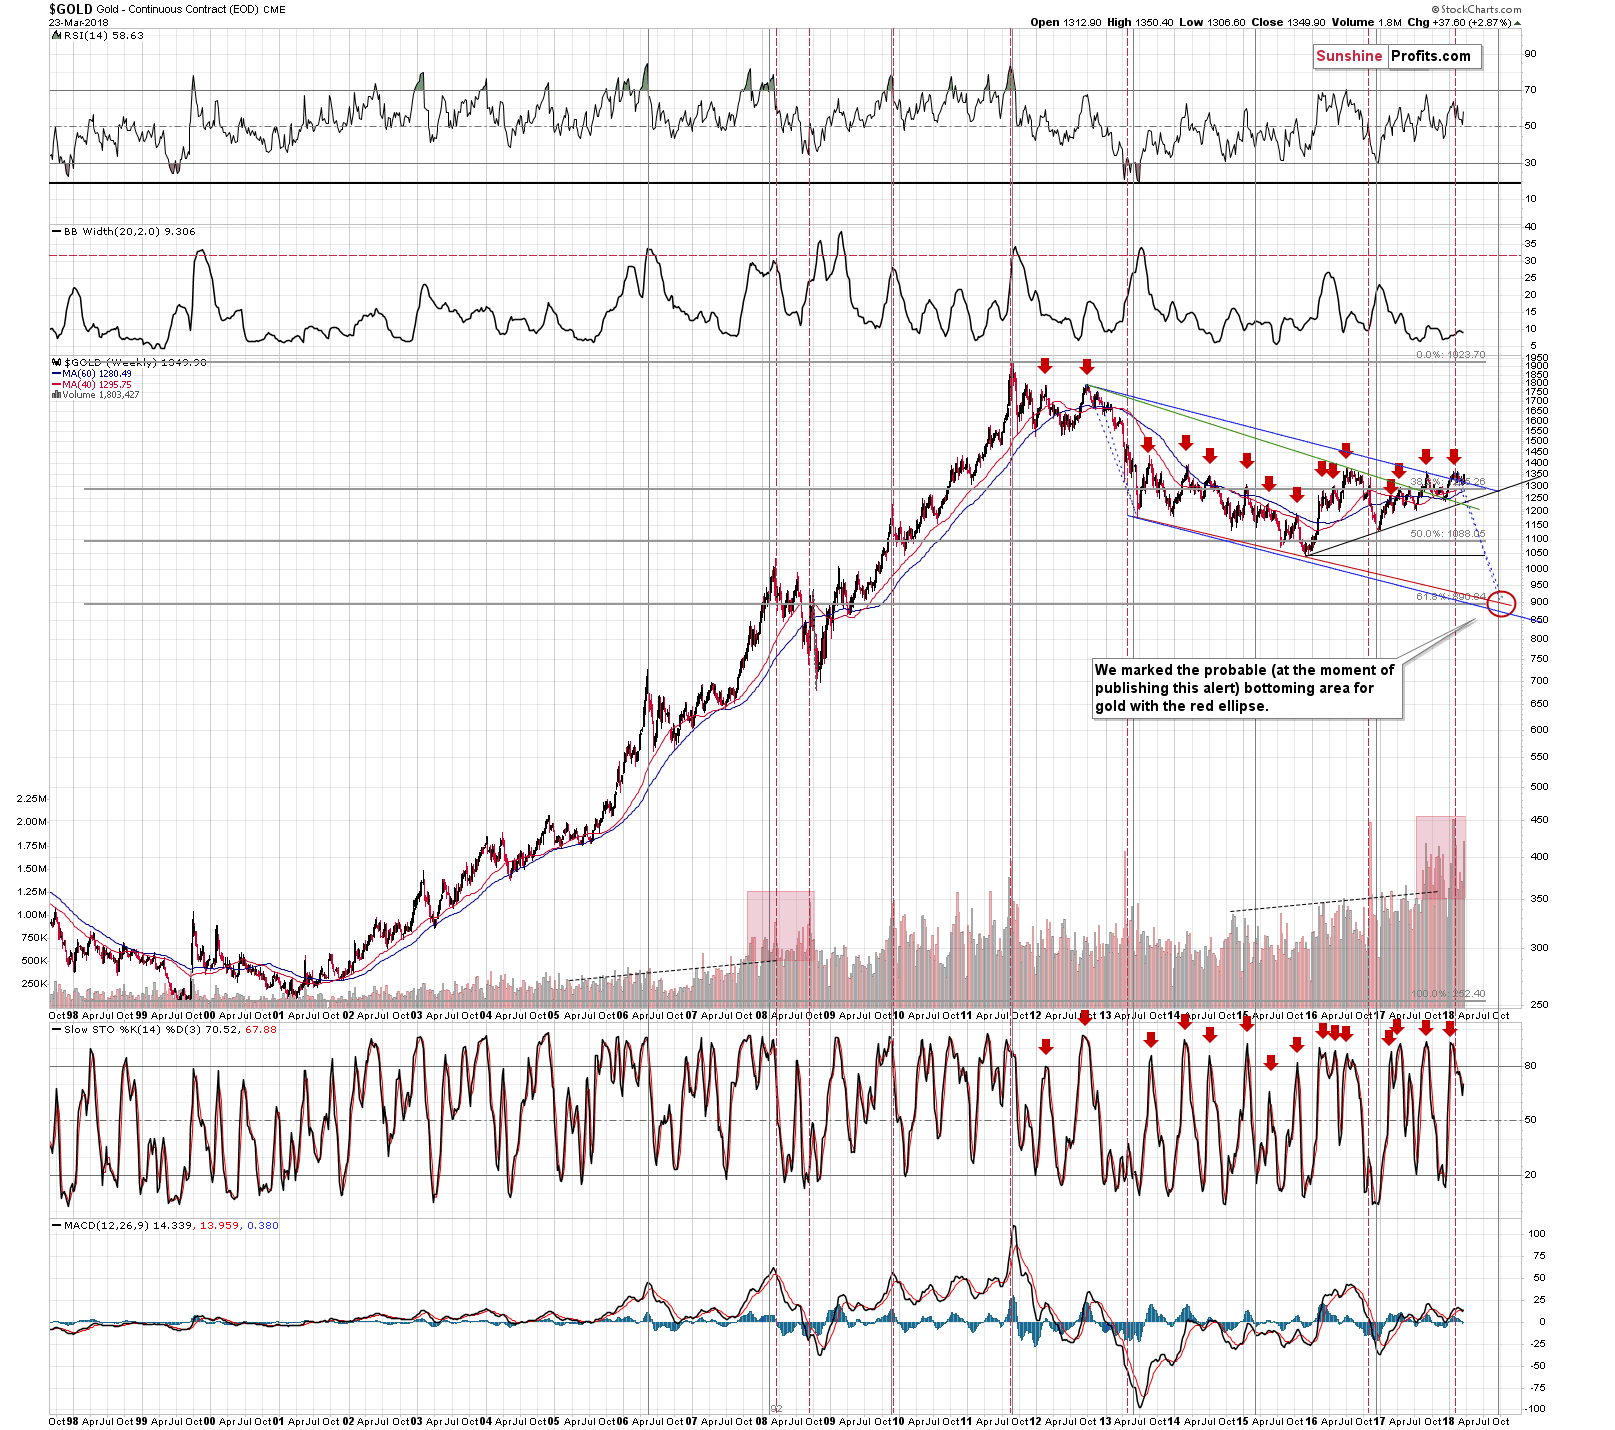
Gold’s very long-term chart shows that even though gold moved higher, the upside potential from here is very limited. Multiple previous rallies ended close to $1,350 - $1,360, so the resistance is very strong. We read a few analyses that suggested that gold was on a verge of breakout, but please keep in mind that it is very unlikely that any breakout will be confirmed. It’s more likely that it will not be seen at all. The authors of the bullish analyses suggest that the proximity of the previous highs is the factor making a breakout something likely.
While it’s obvious that it’s closer to a breakout with gold at $1,340 than at $1,200, just because gold is below an important resistance is not a reason for one to expect a move above it. Conversely, by the very definition of what a resistance level is, one should be expecting a decline if the price moves nearby. That is, until we see a confirmed breakout and we definitely haven’t seen one.
Silver Reversal in the Making
In the case of silver, the situation didn’t change much.
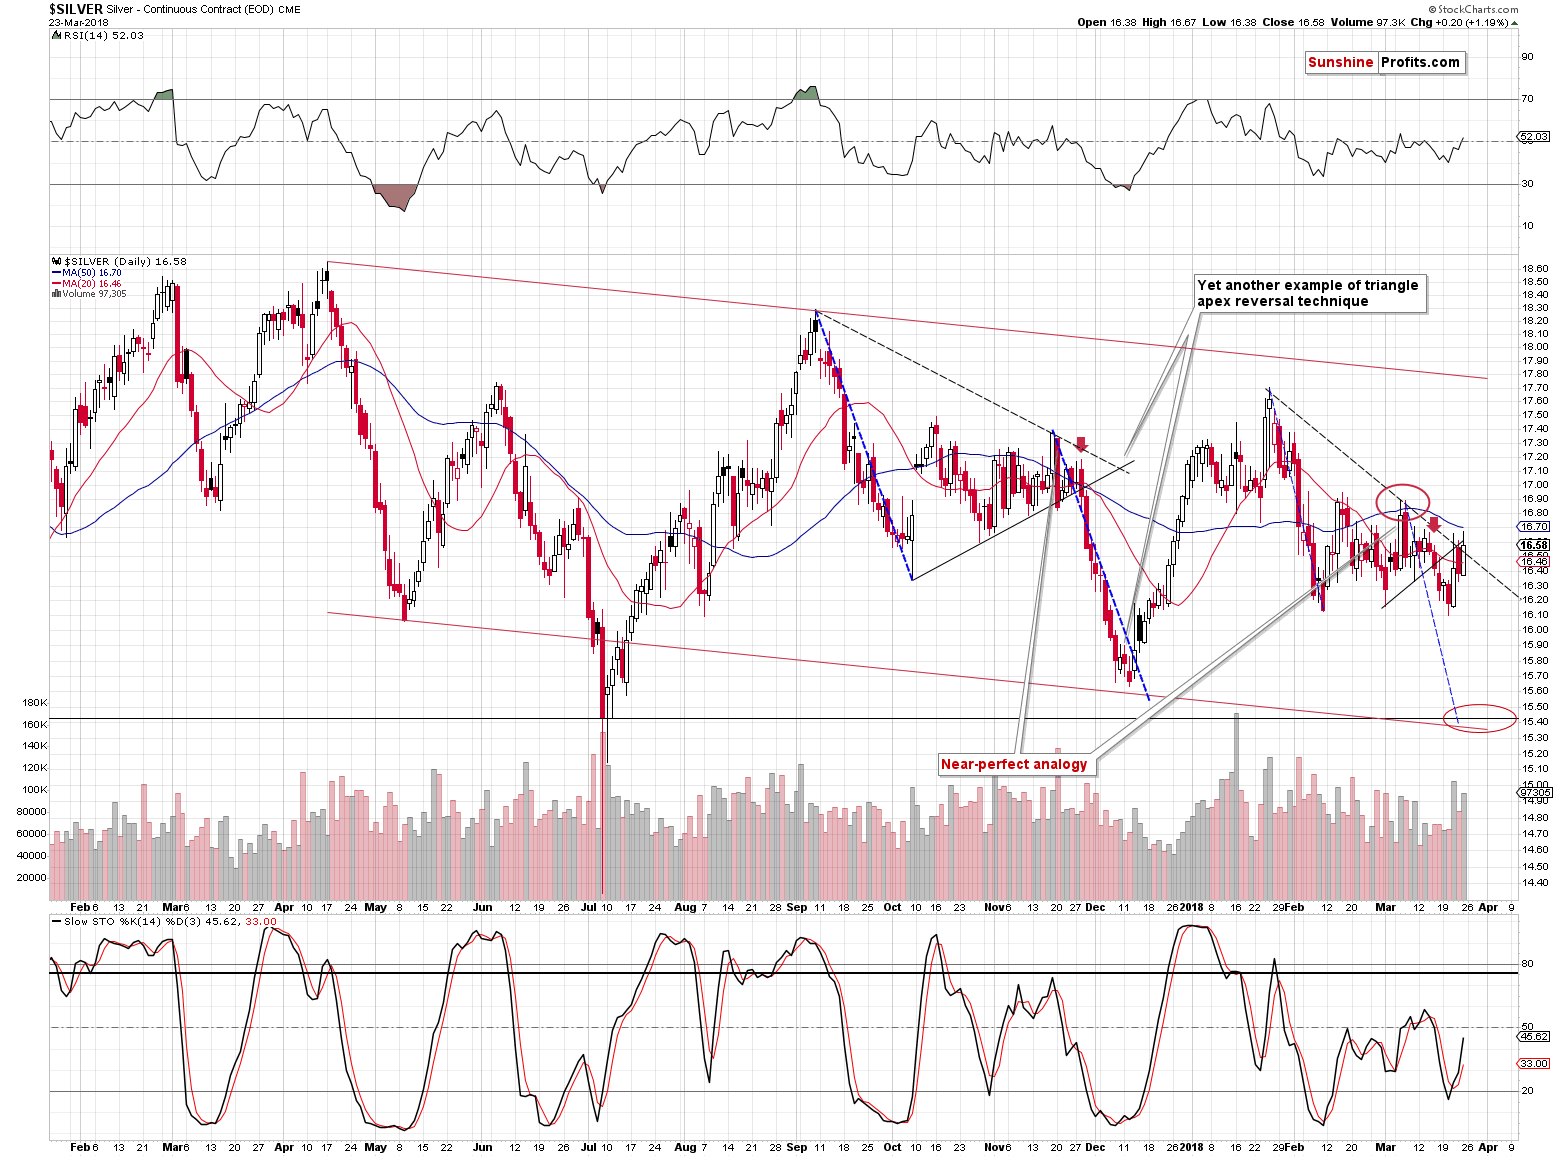
The white metal moved higher on Friday, but the rally was not particularly spectacular. Silver moved only insignificantly above the Wednesday’s intraday high and closed the session very close to the apex of the triangle – below the rising short-term resistance line. Speaking of the apex of the triangle – it’s indicating a reversal and the apex is right in the middle between Wednesday’s and Friday’s highs. Consequently, it currently serves as a perfect bearish signal.
Silver CoT – Really Important?
Before moving to mining stocks, we would like to reply to a few questions that we just received. Every now and then we are requested to comment on the CoT reports as they continue to be viewed as a very important tool in determining precious metals prices. Just as often, we explain that in our opinion, the usefulness of these reports is overestimated as there are many other indicators for PM prices that appear more useful in determining the precious metals’ direction, for instance the RSI.
A good indicator should have a trading range that’s rather stable and signals that are followed by similar action. The former is mostly missing, and the latter is not coherent.
Let’s take the silver CoT as an example and let’s use Large Speculators as a proxy for the entire report’s data.
Let’s start with the big picture, so that we can determine the buy and sell zones.
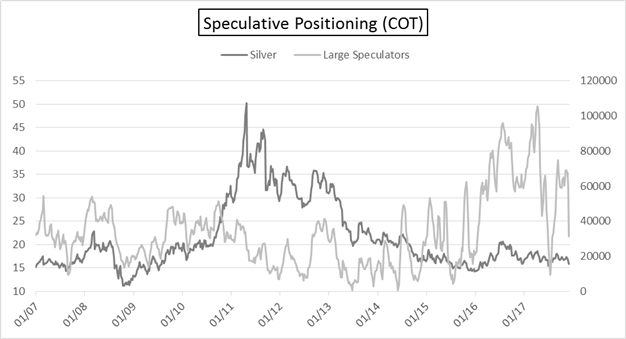
What was the buy zone? Based on the 2007 – 2012 data, one might think that it’s the level of 20,000 contracts as that was when silver’s price reversed. But no – this level didn’t’ stop silver in 2012 and in the following years. So maybe the interesting level was about 5,000 contracts as the 2012 bottoms suggested. Nope – the amount decreased below it in mid-2013 and so did the price of silver. The number finally reached about 0 in 2013. “That must have been the true bottom” – the CoT followers stated. Oops – 5 years later and silver is still well below the level that it reached in mid-2013. It was about $20, so the white metal is currently more than $2 below it.
Before continuing the above discussion of support levels for the number of large speculators’ positions… You know what else is interesting? The large speculators’ position in light of silver’s powerful rally in 2010 and 2011.
In general, if silver’s price goes up, the large speculators’ position goes up. If silver’s price goes down, the large speculators’ position goes down. When the large speculators’ position gets to/above a certain level it, becomes overbought and indicates a downswing and if it gets to/below a certain level, it becomes oversold and indicates an upswing.
Nice and simple, right? The problem is that there is no “certain level” during both up- and downswings. You already read about the difficulty regarding the overbought/support levels in the previous paragraph. The same goes for the overbought/resistance level. The 2016 and 2017 levels were well above the previous maximums and using the previous readings would have generated incorrect signals.
But that’s now that main point. The main point is that the entire link broke down during the biggest upswing of the past decade. The large speculators’ position rallied according to the general “rule” and… More or less in the middle of the upswing, it started to decline. The large speculators’ position became totally useless in predicting the final top for the rally. If that was the case during the key rally of the past decade, then should you really trust this tool when it comes to timing the details of the key decline of the decade? It seems that we are in the early stage of this kind of movement, so should one really bother with looking at the CoT numbers, which could be useful… to a point after which they could provide the opposite of useful signals? The way situation developed in 2010 and 2011 should make you really doubt the CoT numbers’ usefulness in the following months.
Naturally, the entire previous paragraph assumes that the current price regime is different from the previous months’ back-and-forth trading. If only we had seen something suggesting that this situation is different than everything else that we saw in the past 10 years.
Oh wait, we did.
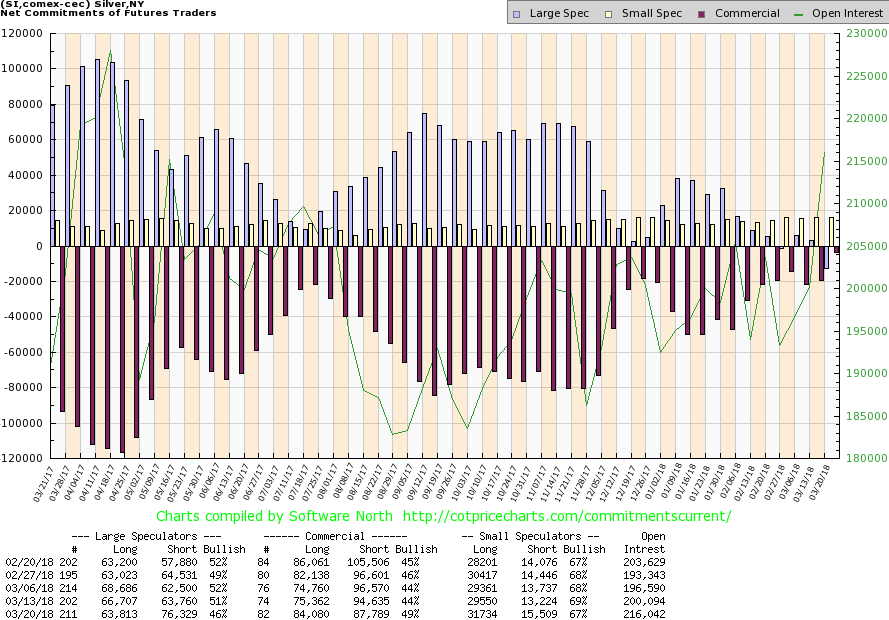
The large speculator’s position just moved below 0, which indicates a new data regime. In other words, we saw a breakdown in the number of positions of large speculators, which suggests that… Well, they will move to a new low – but nobody knows what this low would be. That’s the smaller problem, though.
The bigger problem is that if silver is starting its major – final – decline, then we might not be able to trust the CoT data at all, just like one shouldn’t have trusted it in 2010 and 2011.
Taking both factors into account makes any bullish implications of the above charts rather insignificant at this time.
By the way, did you notice how the analyses that discuss the CoT data are almost always focused on short or (in the best case) medium term? If you feature the big picture, you see how incoherent the implications are and why this tool should be used at best as something that confirms other types of analysis and not on a stand-alone basis.
Gold Stocks: What Rally?
Moving on to gold stocks, if you hadn’t been looking at the market last week, hadn’t heard that there was a rally in the precious metals sector and you looked at the above long-term chart, what would you say? Most likely something like “what rally?”. Indeed, the upswing is almost invisible from the long-term perspective, which is a clear sign of medium-term underperformance and an indication that the recent upswing in gold is rather accidental – not a true direction in which gold is going to move.
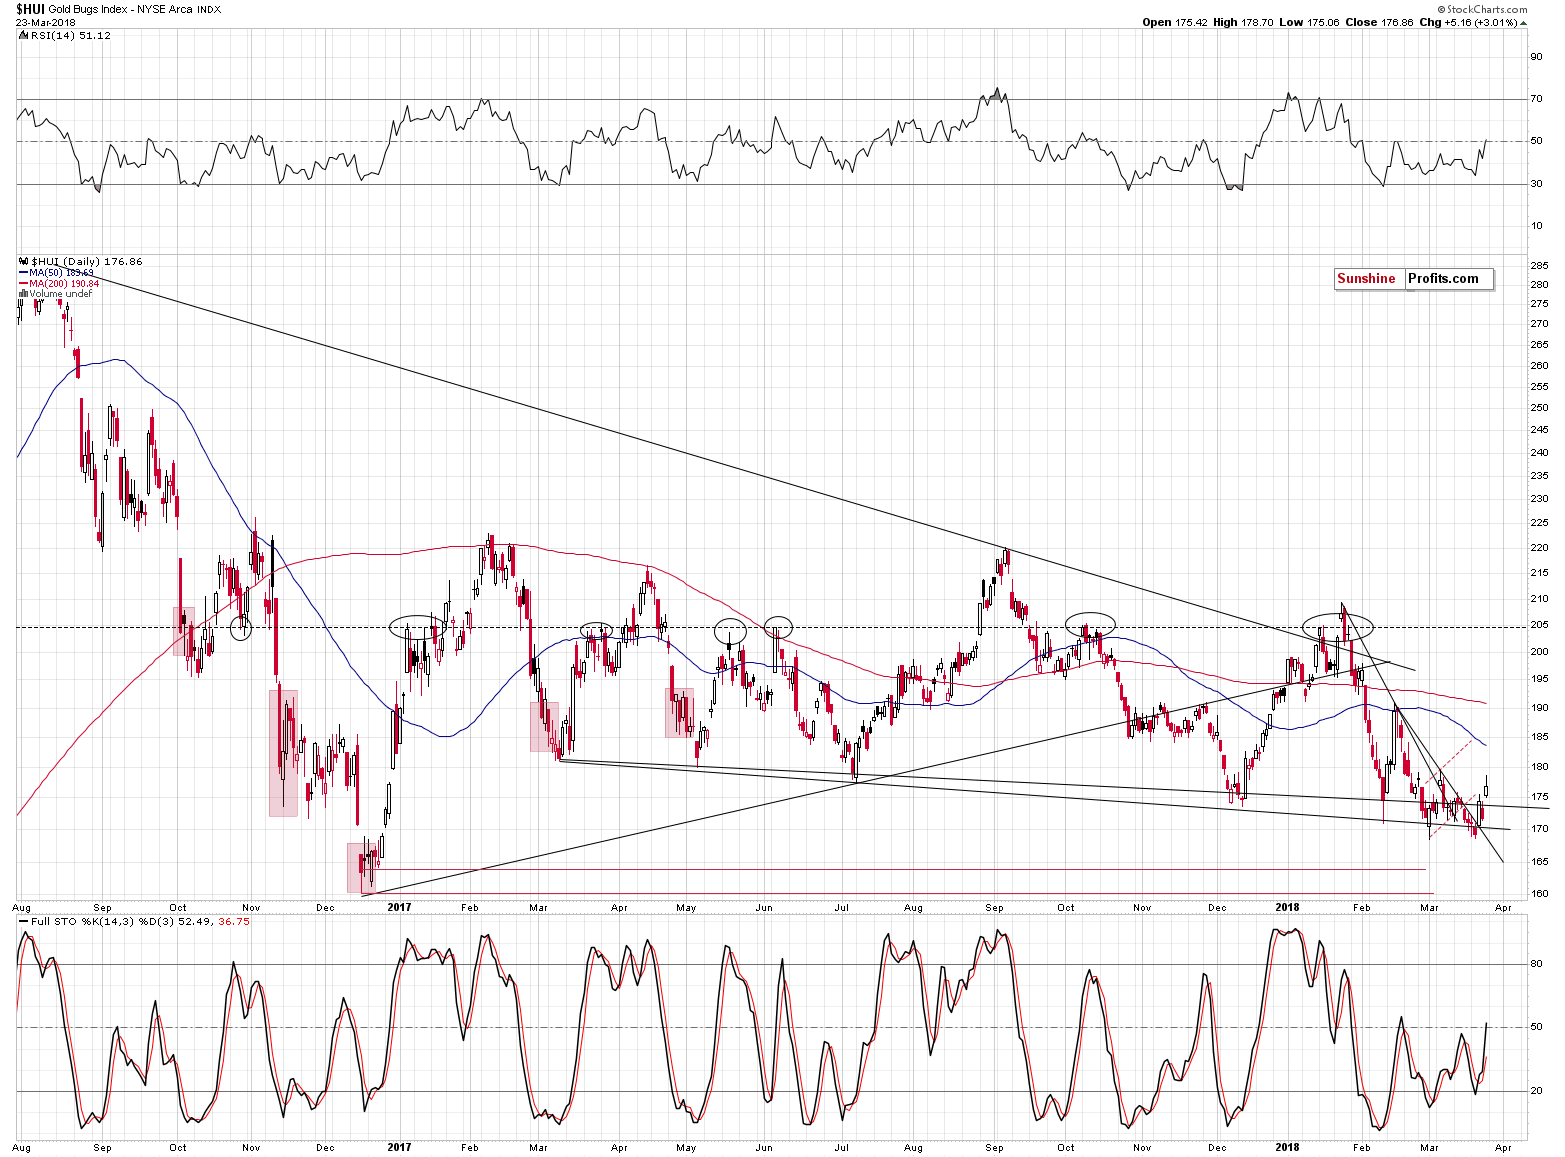
Indeed, gold stocks didn’t manage to move even to the early-March high in terms of both the intraday extreme and closing price. Gold moved quite close to the previous 2018 high and mining stocks are barely a few index points above the February low. The underperformance is truly striking.
We previously wrote about each corrective upswing in gold stocks being smaller than the previous one – this pattern remains intact.
Some may say that gold stocks’ weak performance is not really a bearish sign, because it’s only a consequence of the declining stock market.
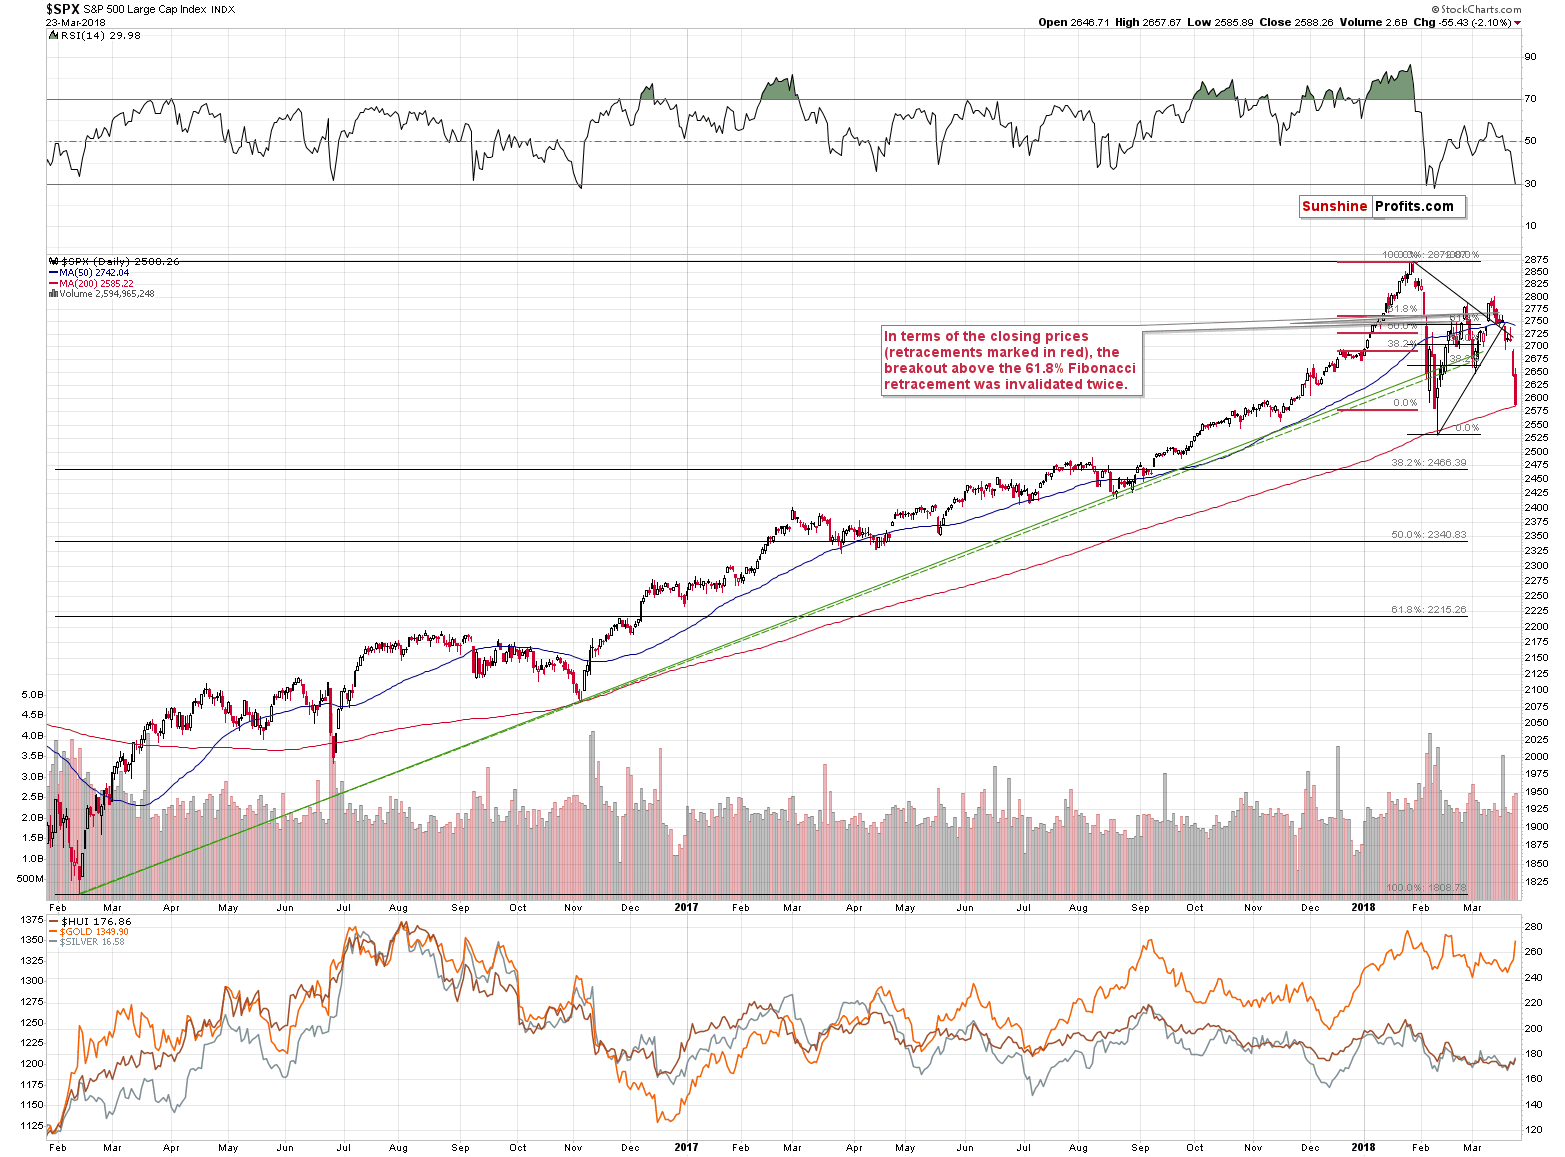
There might be some truth to it, but it doesn’t explain the whole story. The general stock market might have prevented the HUI from moving above 200, but only to 185 – 190. The gold stocks’ performance was much weaker than just that – the HUI wasn’t even able to move above 180, let alone close there.
The S&P 500 Index closed more or less where it had closed on February 8th, so by measuring gold’s and gold stocks’ prices back then and now, we can approximately check what the relationship between the two is without the general stock market’s impact.
On February 8th, gold closed at $1,319 and the HUI closed at 178.39. Yesterday, gold closed at $1349.90 (it seems that the real price was several dollars lower, but this doesn’t change anything here) and the HUI closed at 176.86.
Given the relatively unchanged stock market, we have gold that’s about $30 lower and the HUI Index that is about 1.5 index point lower. That’s extreme underperformance and an incredibly strong bearish sign for the medium term.
By the way, please note that the above chart shows yet another example of an apex-based reversal. The tiny move that we saw on March 16th that took place at the apex was in fact the final reversal before the slide.
Summary
Summing up, gold moved higher on increased geopolitical tensions (possible trade war between the U.S. and China), but it doesn’t seem that it changed the current medium-term trend, which remains down. The extreme underperformance of mining stocks clearly suggests that the main trend was not changed, and silvers triangle-apex-based reversal suggests that the rally is already over or about to be over. All in all, the outlook for the precious metals sector for the following weeks remains bearish.
As always, we will keep you – our subscribers – informed.
To summarize:
Trading capital (supplementary part of the portfolio; our opinion): Full short positions (200% of the full position) in gold, silver and mining stocks are justified from the risk/reward perspective with the following stop-loss orders and initial target price levels:
- Gold: initial target price: $1,218; stop-loss: $1,382; initial target price for the DGLD ETN: $53.98; stop-loss for the DGLD ETN $37.68
- Silver: initial target price: $14.63; stop-loss: $17.33; initial target price for the DSLV ETN: $33.88; stop-loss for the DSLV ETN $21.48
- Mining stocks (price levels for the GDX ETF): initial target price: $19.22; stop-loss: $23.54; initial target price for the DUST ETF: $39.88; stop-loss for the DUST ETF $21.46
In case one wants to bet on junior mining stocks' prices (we do not suggest doing so – we think senior mining stocks are more predictable in the case of short-term trades – if one wants to do it anyway, we provide the details), here are the stop-loss details and initial target prices:
- GDXJ ETF: initial target price: $27.82; stop-loss: $36.14
- JDST ETF: initial target price: $94.88 stop-loss: $41.86
Long-term capital (core part of the portfolio; our opinion): No positions (in other words: cash)
Insurance capital (core part of the portfolio; our opinion): Full position
Important Details for New Subscribers
Whether you already subscribed or not, we encourage you to find out how to make the most of our alerts and read our replies to the most common alert-and-gold-trading-related-questions.
Please note that the in the trading section we describe the situation for the day that the alert is posted. In other words, it we are writing about a speculative position, it means that it is up-to-date on the day it was posted. We are also featuring the initial target prices, so that you can decide whether keeping a position on a given day is something that is in tune with your approach (some moves are too small for medium-term traders and some might appear too big for day-traders).
Plus, you might want to read why our stop-loss orders are usually relatively far from the current price.
Please note that a full position doesn’t mean using all of the capital for a given trade. You will find details on our thoughts on gold portfolio structuring in the Key Insights section on our website.
As a reminder – “initial target price” means exactly that – an “initial” one, it’s not a price level at which we suggest closing positions. If this becomes the case (like it did in the previous trade) we will refer to these levels as levels of exit orders (exactly as we’ve done previously). Stop-loss levels, however, are naturally not “initial”, but something that, in our opinion, might be entered as an order.
Since it is impossible to synchronize target prices and stop-loss levels for all the ETFs and ETNs with the main markets that we provide these levels for (gold, silver and mining stocks – the GDX ETF), the stop-loss levels and target prices for other ETNs and ETF (among other: UGLD, DGLD, USLV, DSLV, NUGT, DUST, JNUG, JDST) are provided as supplementary, and not as “final”. This means that if a stop-loss or a target level is reached for any of the “additional instruments” (DGLD for instance), but not for the “main instrument” (gold in this case), we will view positions in both gold and DGLD as still open and the stop-loss for DGLD would have to be moved lower. On the other hand, if gold moves to a stop-loss level but DGLD doesn’t, then we will view both positions (in gold and DGLD) as closed. In other words, since it’s not possible to be 100% certain that each related instrument moves to a given level when the underlying instrument does, we can’t provide levels that would be binding. The levels that we do provide are our best estimate of the levels that will correspond to the levels in the underlying assets, but it will be the underlying assets that one will need to focus on regarding the signs pointing to closing a given position or keeping it open. We might adjust the levels in the “additional instruments” without adjusting the levels in the “main instruments”, which will simply mean that we have improved our estimation of these levels, not that we changed our outlook on the markets. We are already working on a tool that would update these levels on a daily basis for the most popular ETFs, ETNs and individual mining stocks.
Our preferred ways to invest in and to trade gold along with the reasoning can be found in the how to buy gold section. Additionally, our preferred ETFs and ETNs can be found in our Gold & Silver ETF Ranking.
As a reminder, Gold & Silver Trading Alerts are posted before or on each trading day (we usually post them before the opening bell, but we don't promise doing that each day). If there's anything urgent, we will send you an additional small alert before posting the main one.
=====
Latest Free Trading Alerts:
Stocks extended their sell-off on Friday, as investors reacted to global stocks markets move down, trade war and monetary policy tightening fears. It was some kind of a perfect bearish storm that sent stock prices tumbling on Thursday, and then on Friday. As medium-term bearish case unfolds, we see indexes getting closer to their early February lows. Will they break lower?
Stocks Set to Bounce Back, but Bulls' Worries Far From Over
“Bitcoin will reach the moon,” they said. “$20,000 is only the beginning,” they pressed. The harsh reality of the recent move is that appreciation has been nowhere in sight. Harsh, that is, if you haven’t been positioned properly. Are Bitcoin traders bound to be left with their teeth clenched, watching Bitcoin fluctuate? No. There’s a possibility for some to grow the profits they already have on specific positions and for others to jump in during the next part of the move.
One Change the Bitcoin Posse Is Unlikely to See
=====
Hand-picked precious-metals-related links:
PRECIOUS-Gold steady as spectre of global trade war recedes
Platinum Mines in the World's Top Producer Are Shrinking
=====
In other news:
Dollar Hits 16-Month Lows Vs. Yen As Trade, Political Woes Take Their Toll
Stocks rebound as report of U.S.-China trade talks improves mood
Nearly half of Japanese think Abe should quit over land sale scandal: poll
Reports of Williams Heading to New York Fed Spur Backlash
America's Libor Replacement Is Ready for Its Debut
Oil Erases Gains as Traders Shrug Off Rising Middle East Tension
=====
Thank you.
Sincerely,
Przemyslaw Radomski, CFA
Founder, Editor-in-chief, Gold & Silver Fund Manager
Gold & Silver Trading Alerts
Forex Trading Alerts
Oil Investment Updates
Oil Trading Alerts

