

The U.S. stock market indexes lost between 1.8% and 2.1% on Friday, as investors' sentiment remained very bearish following Thursday's sell-off. The S&P 500 index broke below the level of 2,600, as it got closer to its February 9 local low of 2,532.69. It currently trades 9.9% below January 26 record high of 2,872.87. The Dow Jones Industrial Average lost 1.8%, and the technology Nasdaq Composite lost 2.4% on Friday.
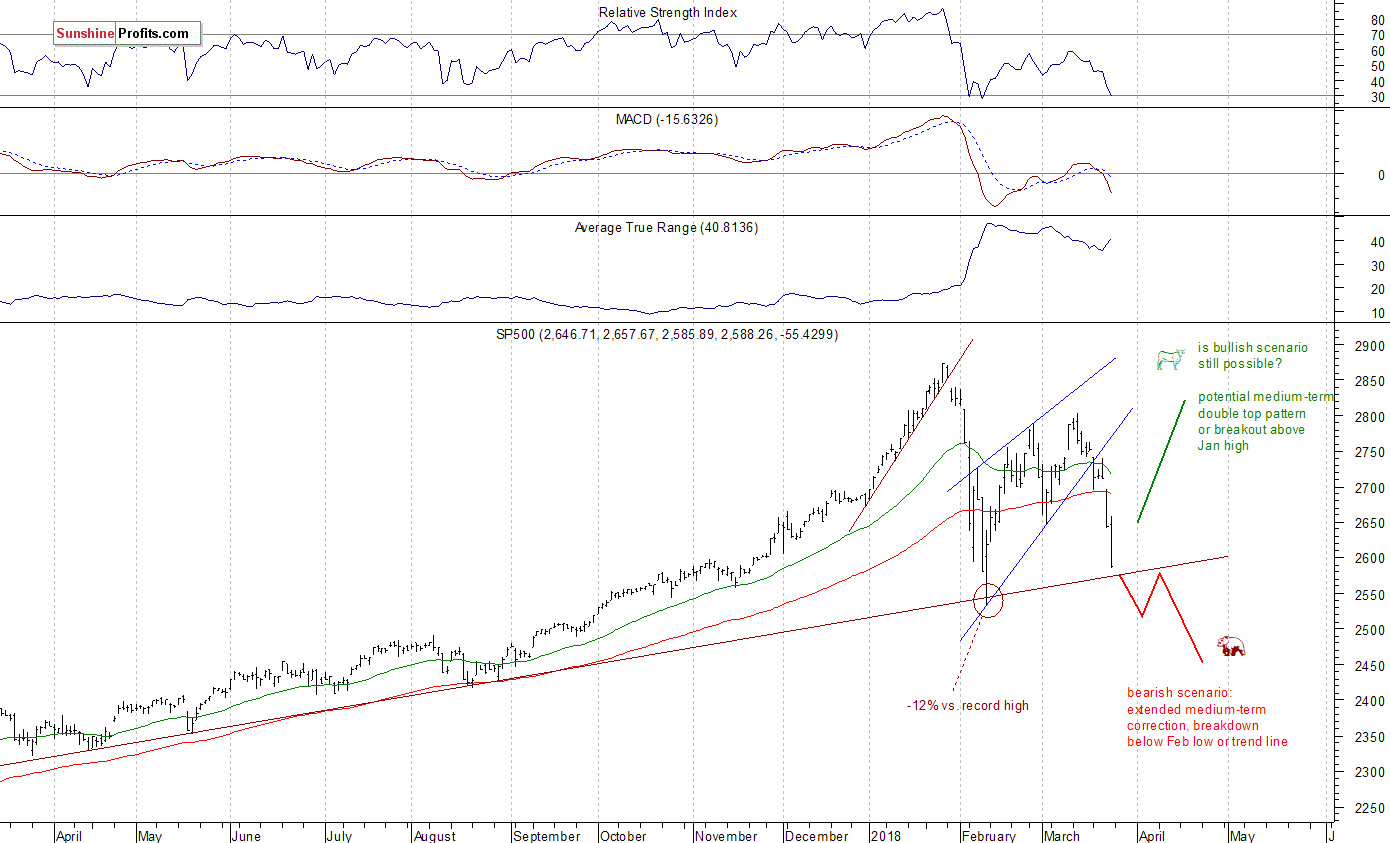
The nearest important level of support of the S&P 500 index is now at 2,530-2,550, marked by the above-mentioned early February low. There is also a medium-term upward trend line, beginning in March of 2017. On the other hand, resistance level is at 2,600, and the next level of resistance is at around 2,640, marked by previous local lows.
We can see that stocks reversed their medium-term upward course following whole retracement of January euphoria rally. Then the market bounced off its almost year-long medium-term upward trend line, and it retraced more than 61.8% of the sell-off within a few days of trading. The market was in the middle of two possible future scenarios recently. The bearish case leading us to February low or lower after breaking below medium-term upward trend line, and the bullish one with medium-term double top pattern or breakout higher. Last week's sell-off made the bearish case very likely, almost a certainty. You should take notice of a breakdown below potential rising wedge pattern. This over month-long trading range looks like an upward correction following late January - early February sell-off:
Stocks Set to Open Much Higher
Expectations before the opening of today's trading session are very positive, because the index futures contracts trade 1.3-1.6% higher vs. their Friday's closing prices. The European stock market indexes have gained 0.5-0.6% so far. There will be no new important economic data announcements today, but the market will wait for some FOMC's Members speeches later in the day. Will stocks continue higher after the opening of the cash market trading session? We will probably see some short-term fluctuations. The overall sentiment remains bearish. The index broke below its early March low, so bears are still on the run.
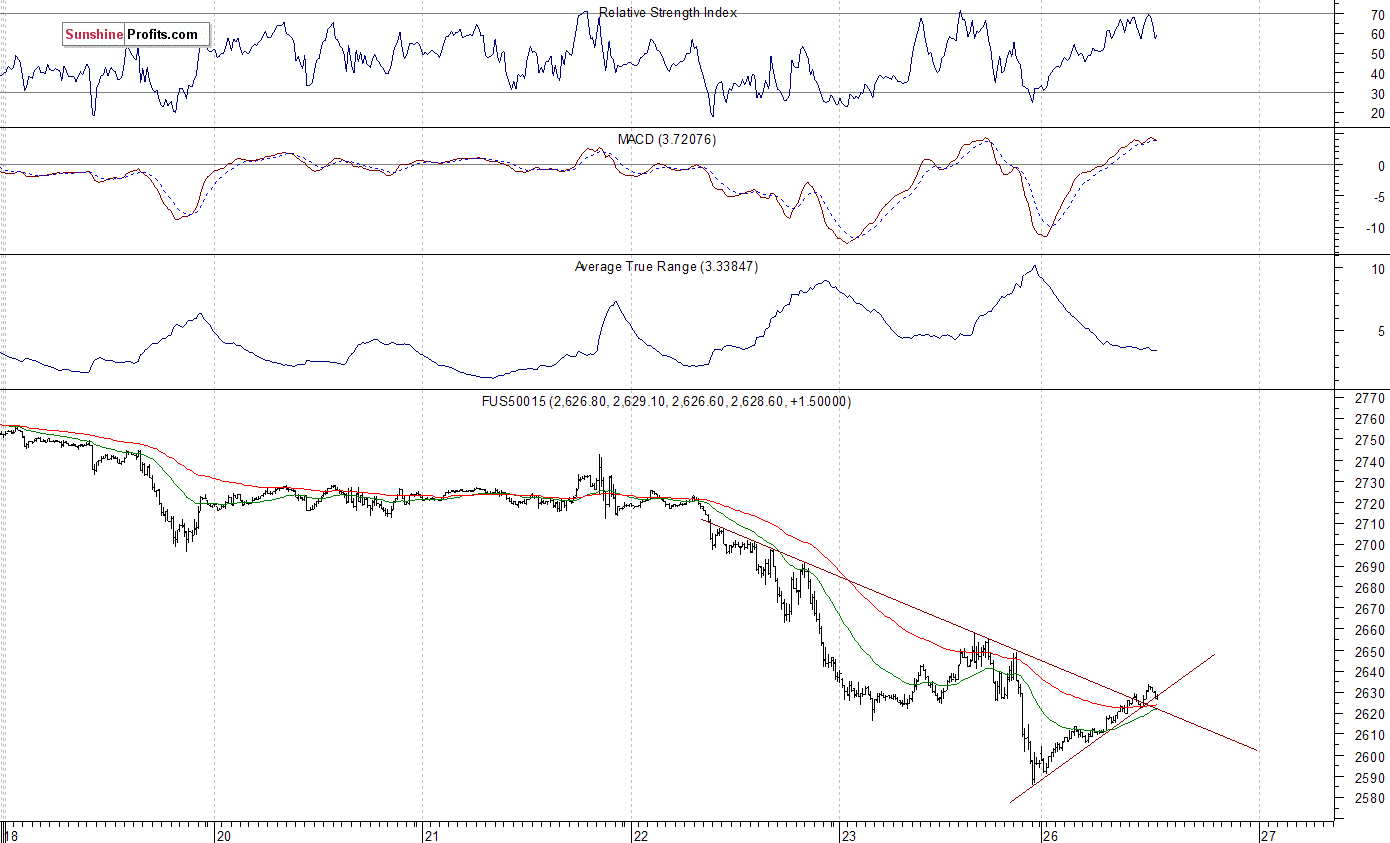
The S&P 500 futures contract trades within an intraday uptrend, as it retraces a big part of its Friday's sell-off. The nearest important level of resistance is at around 2,640-2,660, marked by Friday's local highs. On the other hand, support level is at 2,600-2,615, marked by short-term consolidation, and the next level of support is at 2,585, marked by Friday's low. The futures contract is now slightly above its short-term downward trend line, as the 15-minute chart shows:
Nasdaq Also Higher
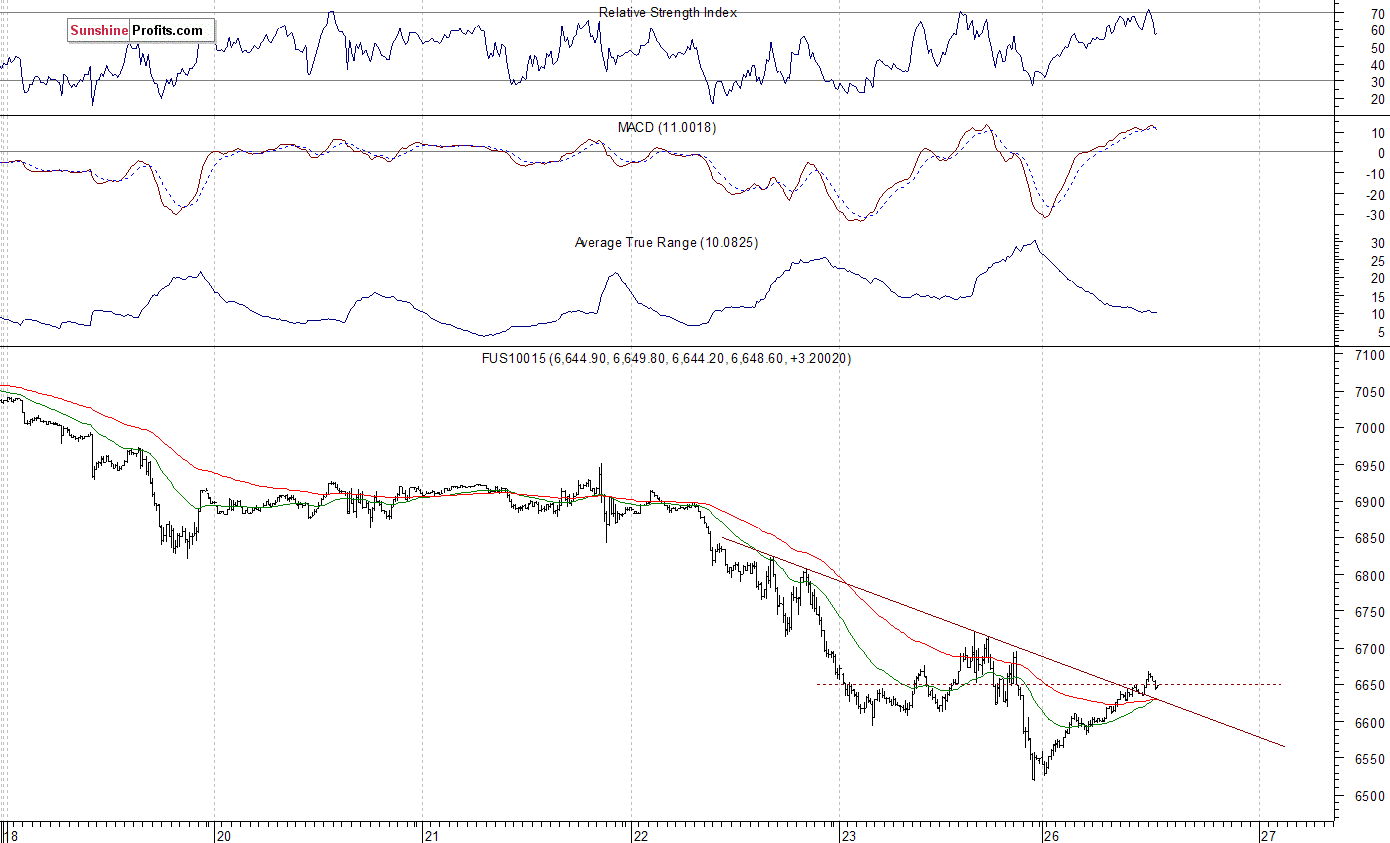
The technology Nasdaq 100 futures contract follows a similar path, as it trades within an intraday uptrend. It accelerated its downtrend on Friday and it got closer to 6,500 mark. The market gained more than 1,000 points off its February 9 bottom, as it remarkably retraced all of its late January - early February sell-off in one month. Its recent price action is very bearish, but will it continue lower and towards the early February low of around 6,160? The nearest important resistance level is now at around 6,700-6,720, marked by local highs. The resistance level is also at 6,780-6,800. On the other hand, support level is at 6,600, and the next level of support is at 6,520-6,550, marked by Friday's low. The Nasdaq futures contract trades along the level of 6,650, as we can see on the 15-minute chart:
Apple, Facebook Accelerated Lower, Temporary Bottom?
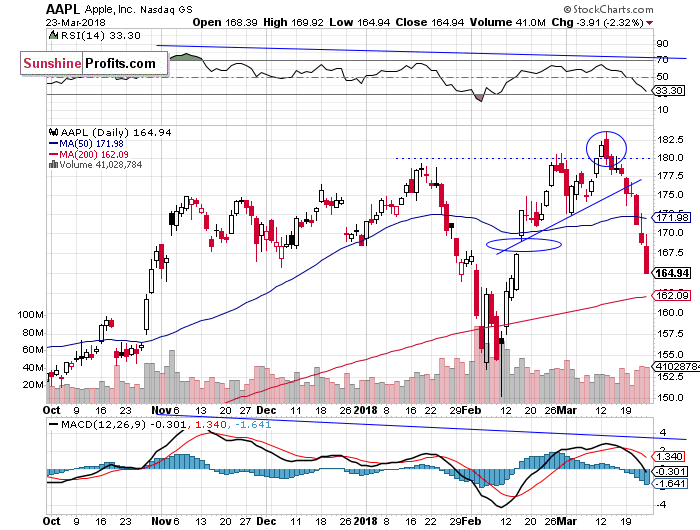
Let's take a look at Apple, Inc. stock (AAPL) daily chart (chart courtesy of http://stockcharts.com). The market reached new record two weeks ago, but then it reversed the uptrend. We saw negative technical divergences - the most common divergences are between asset’s price and some indicator based on it (for instance the index and RSI or MACD based on the index). In this case, the divergence occurs when price forms a higher high and the indicator forms a lower high. It shows us that even though price reaches new highs, the fuel for the uptrend starts running low. The market formed a negative candlestick chart pattern called "bearish engulfing". It consists of a smaller white candlestick followed by a black candlestick that "engulfs" the white one. This downward reversal pattern has been confirmed. Consequently the market continued its downtrend, as it broke below the upward trend line a week ago. Since then it accelerated downwards. Will it reach the previous low of around $150? It may bounce off support level at $160-165, but this downtrend looks far from over:
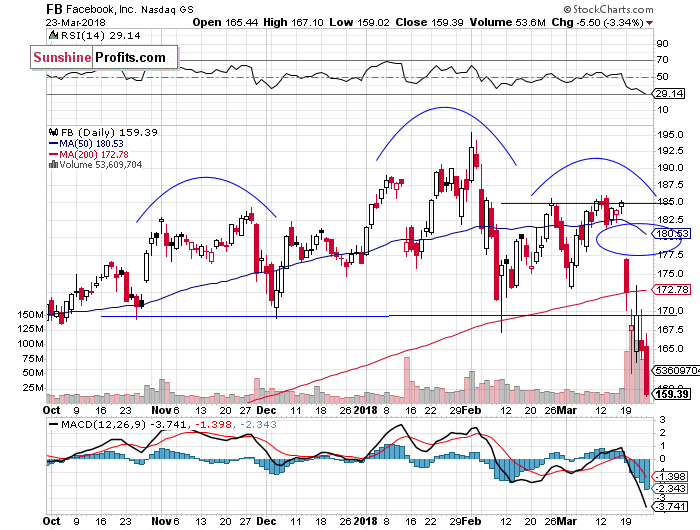
Now let's take a look at Facebook, Inc. (FB) daily chart. It broke below its medium-term consolidation and potential downward reversal head-and-shoulders pattern last week. Previous support level of $170 acts a resistance level now. The market is at the lowest since July of 2017. There have been no confirmed positive signals so far. However, the price may bounce off medium-term support level at $155-160:
Dow Jones Breaks Below 24,000
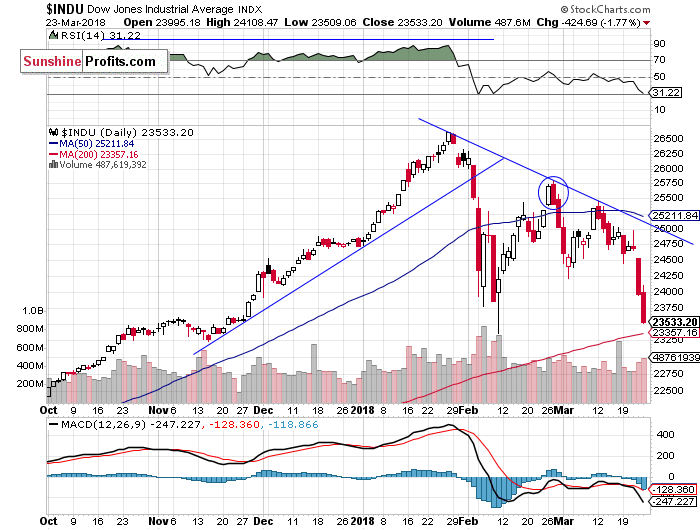
The Dow Jones Industrial Average daily chart shows that blue-chip index was relatively weaker than the broad stock market and much weaker than record-breaking technology stocks recently, as it continued to trade well below late February local high. The market broke below its early March local low on Thursday, and it continued below the level of 24,000 on Friday. In late February, we saw a negative candlestick pattern called Dark Cloud Cover, a pattern in which the uptrend continues with a long white body, and the next day it reverses following higher open and closes below the mid-point between open and close prices of the previous day. Since then, it acted as a resistance level. The index got close to its February 9 low. It may act as a short-term support level, but the overall medium-term picture is bearish:
Concluding, the S&P 500 index will probably open much higher today, as futures contracts trade well above their Friday's closing prices. But will stocks extend their intraday uptrend after 9:30 a.m.? They may fluctuate along Friday's local highs today. There may be some more short-term uncertainty, along with higher volatility.
The early March rally failed to continue following monetary policy tightening, trade war fears, negative political news. What was just profit-taking action, quickly became a meaningful downward reversal. Last week's Monday's sell-off and breakdown below over-month-long rising wedge pattern made medium-term bearish case more likely, and after some quick consolidation, the index accelerated lower on Thursday and Friday. Just like we wrote in our several Stocks Trading Alerts, the early February sell-off set the negative tone for weeks or months to come.
If you enjoyed the above analysis and would like to receive free follow-ups, we encourage you to sign up for our daily newsletter – it’s free and if you don’t like it, you can unsubscribe with just 2 clicks. If you sign up today, you’ll also get 7 days of free access to our premium daily Gold & Silver Trading Alerts. Sign up today!
Thank you.
Paul Rejczak
Stock Trading Strategist
Stock Trading Alerts
Sunshine Profits - Free Stock Market Analysis
