

Briefly: In our opinion, full (200% of the regular size of the position) speculative short positions in gold, silver and mining stocks are justified from the risk/reward perspective at the moment of publishing this alert.
Gold and gold stocks’ reversal is upon us. The triangle-apex-based reversals in both parts of the precious metals sector suggest that the direction of the market is about to change. There might a problem with the interpretation of this signal, because the most recent medium-term move was a consolidation, but there is a very simple method that allows one to check what the true implications really are.
It’s simply looking at the chart from the bigger perspective. Let’s take a look at the gold market from the long-term point of view (chart courtesy of http://stockcharts.com).
Gold’s Reversal
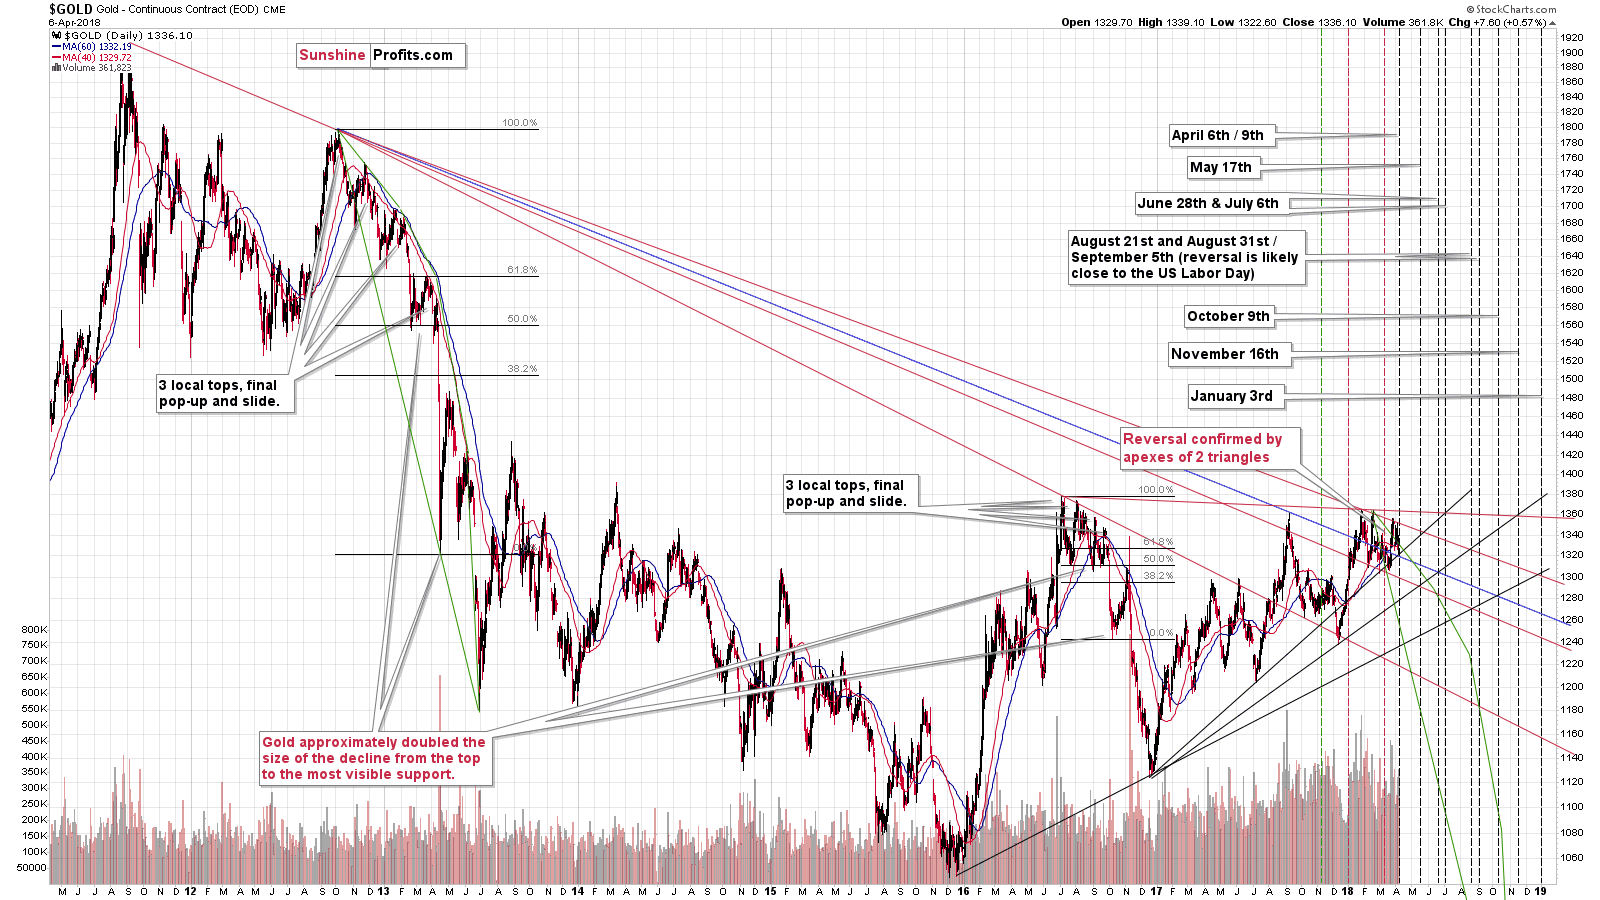
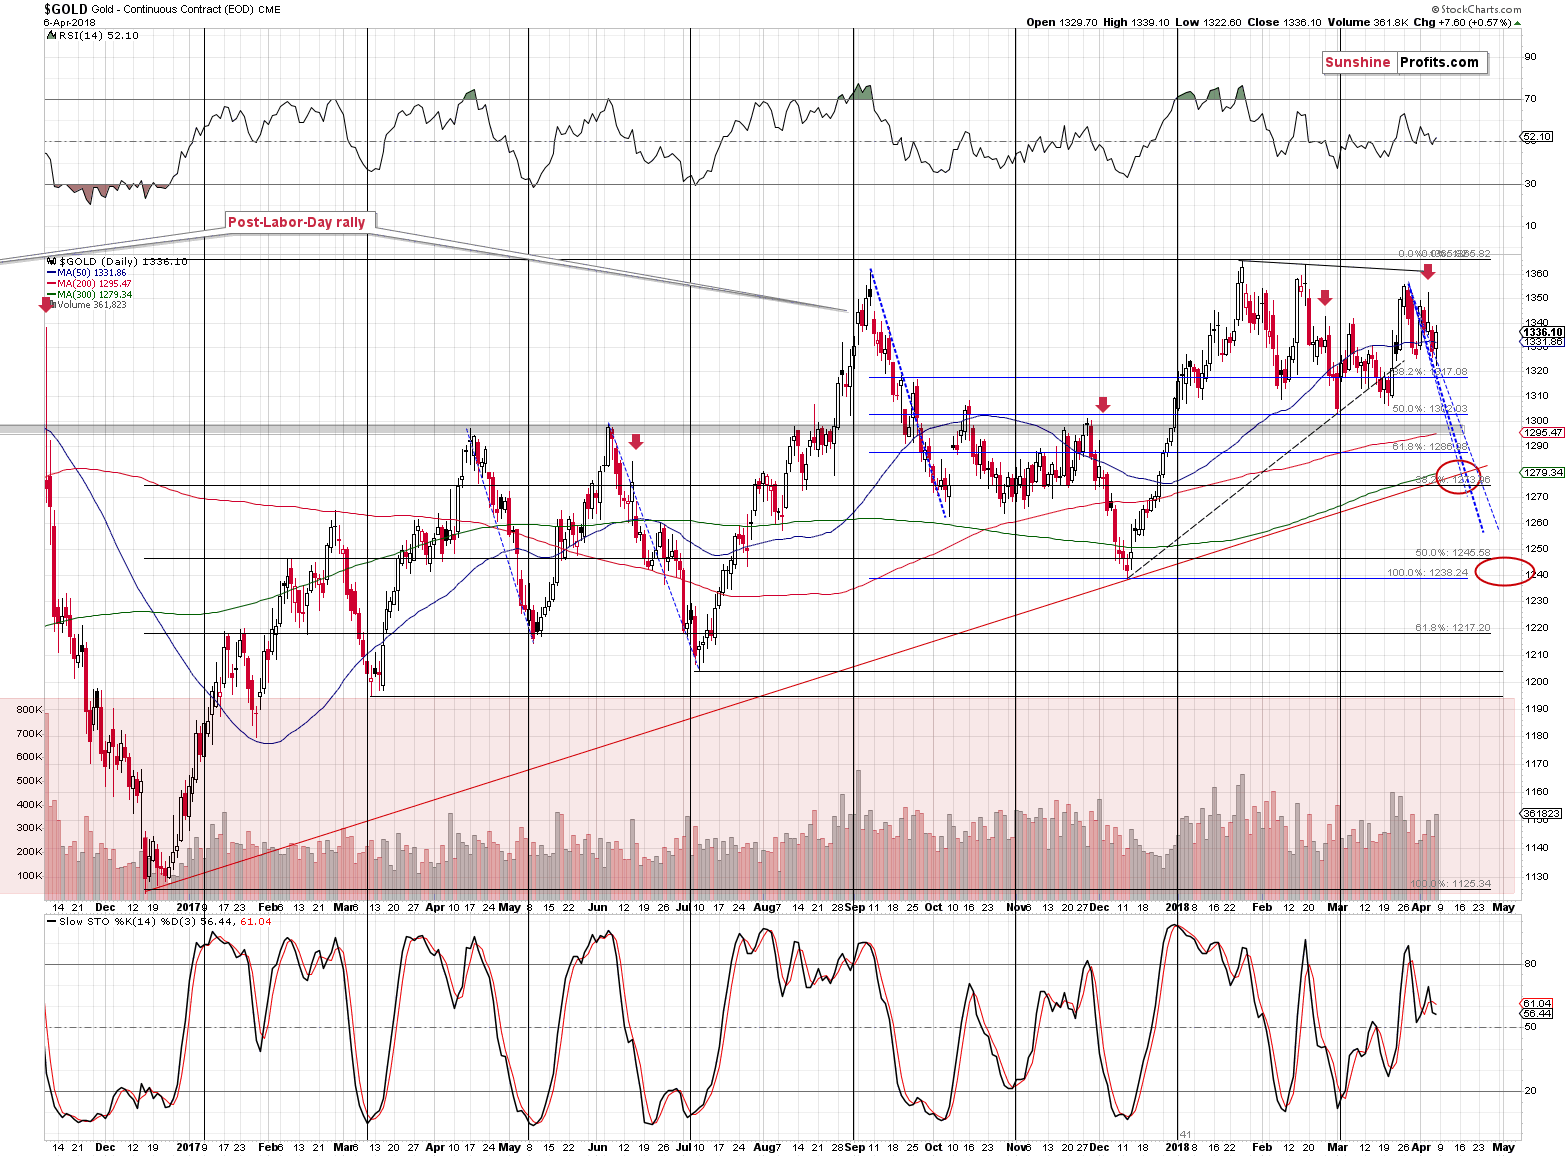
Gold moved higher in the past two years (except for the decline in the second half of 2016) and it’s been moving mostly higher since December 2017. It also moved higher during Friday’s session. The only time-frame in which gold hasn’t moves visibly higher on average is gold’s performance since the beginning of this year. This seems to be an exception and not a rule – in terms of the majority of perspectives, the previous move was up.
Mining Stocks’ Reversal
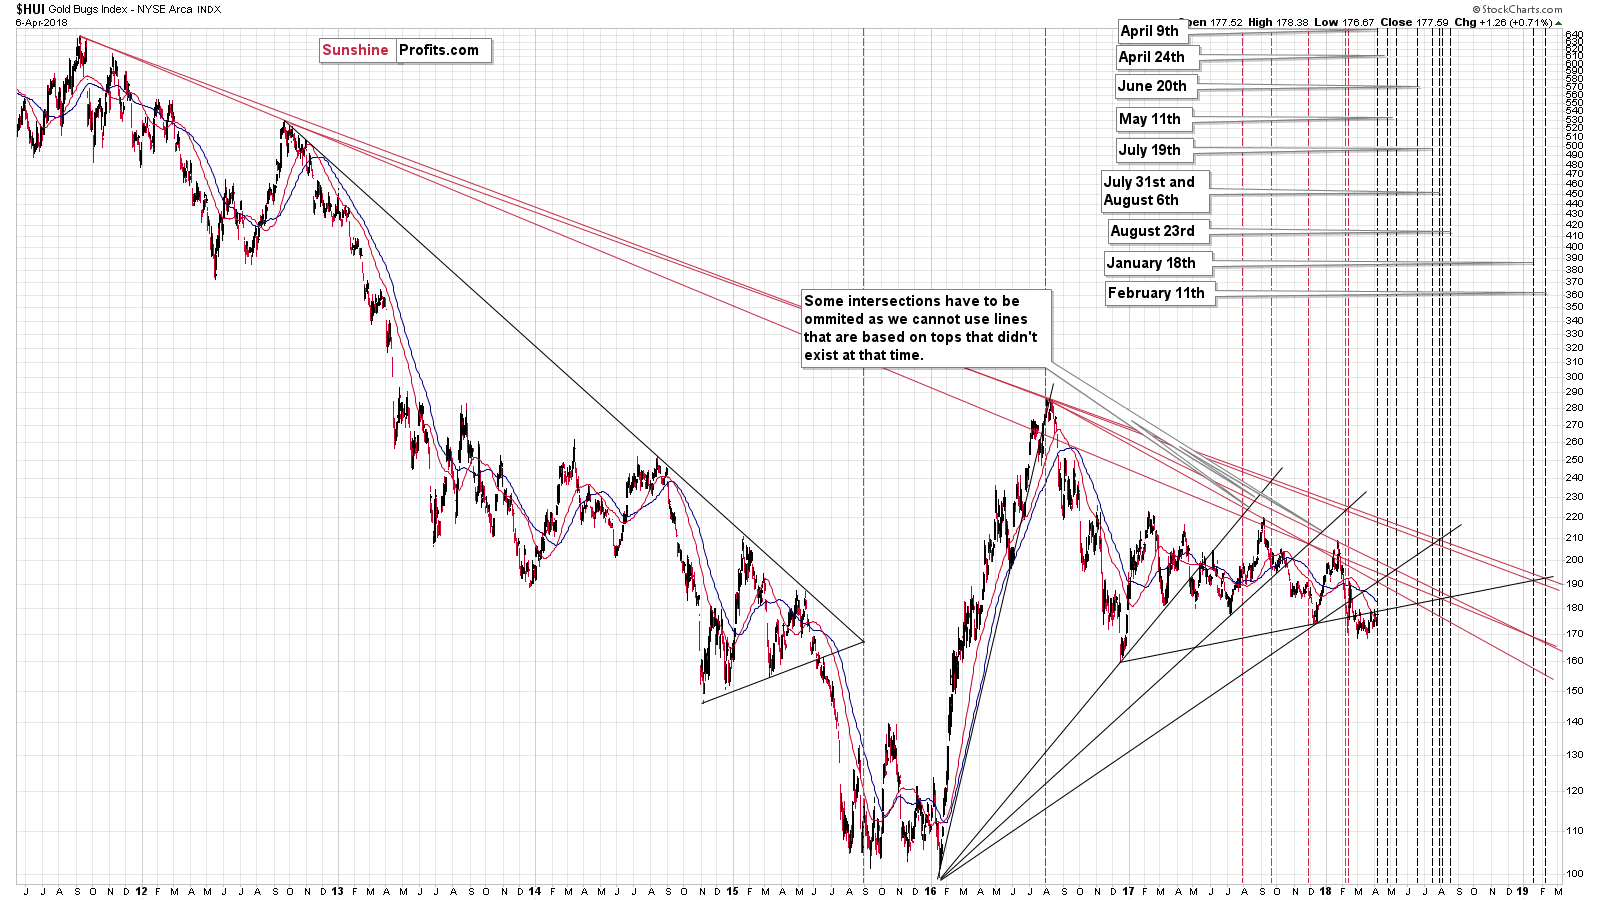
In the case of mining stocks, we can’t say that the preceding move was mostly up, but it was the case during the latest short-term move and during Friday’s session. Mining stocks moved only a little – but still – higher. This makes the implications of the current reversal date rather bearish. Unfortunately, this technique currently doesn’t have significant strength for this market.
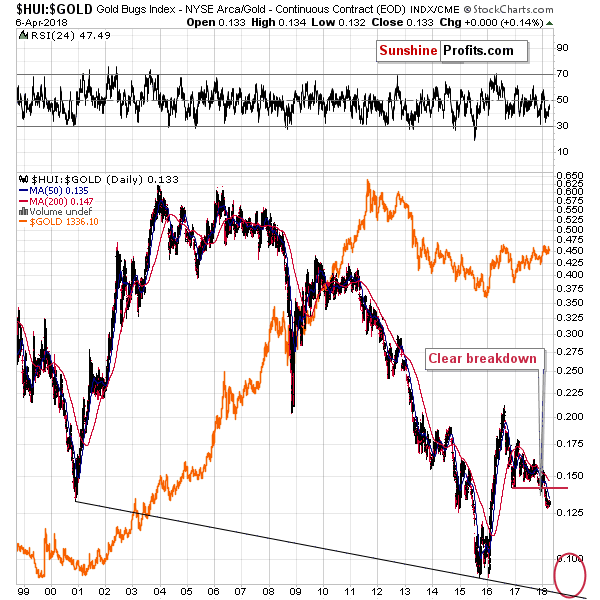
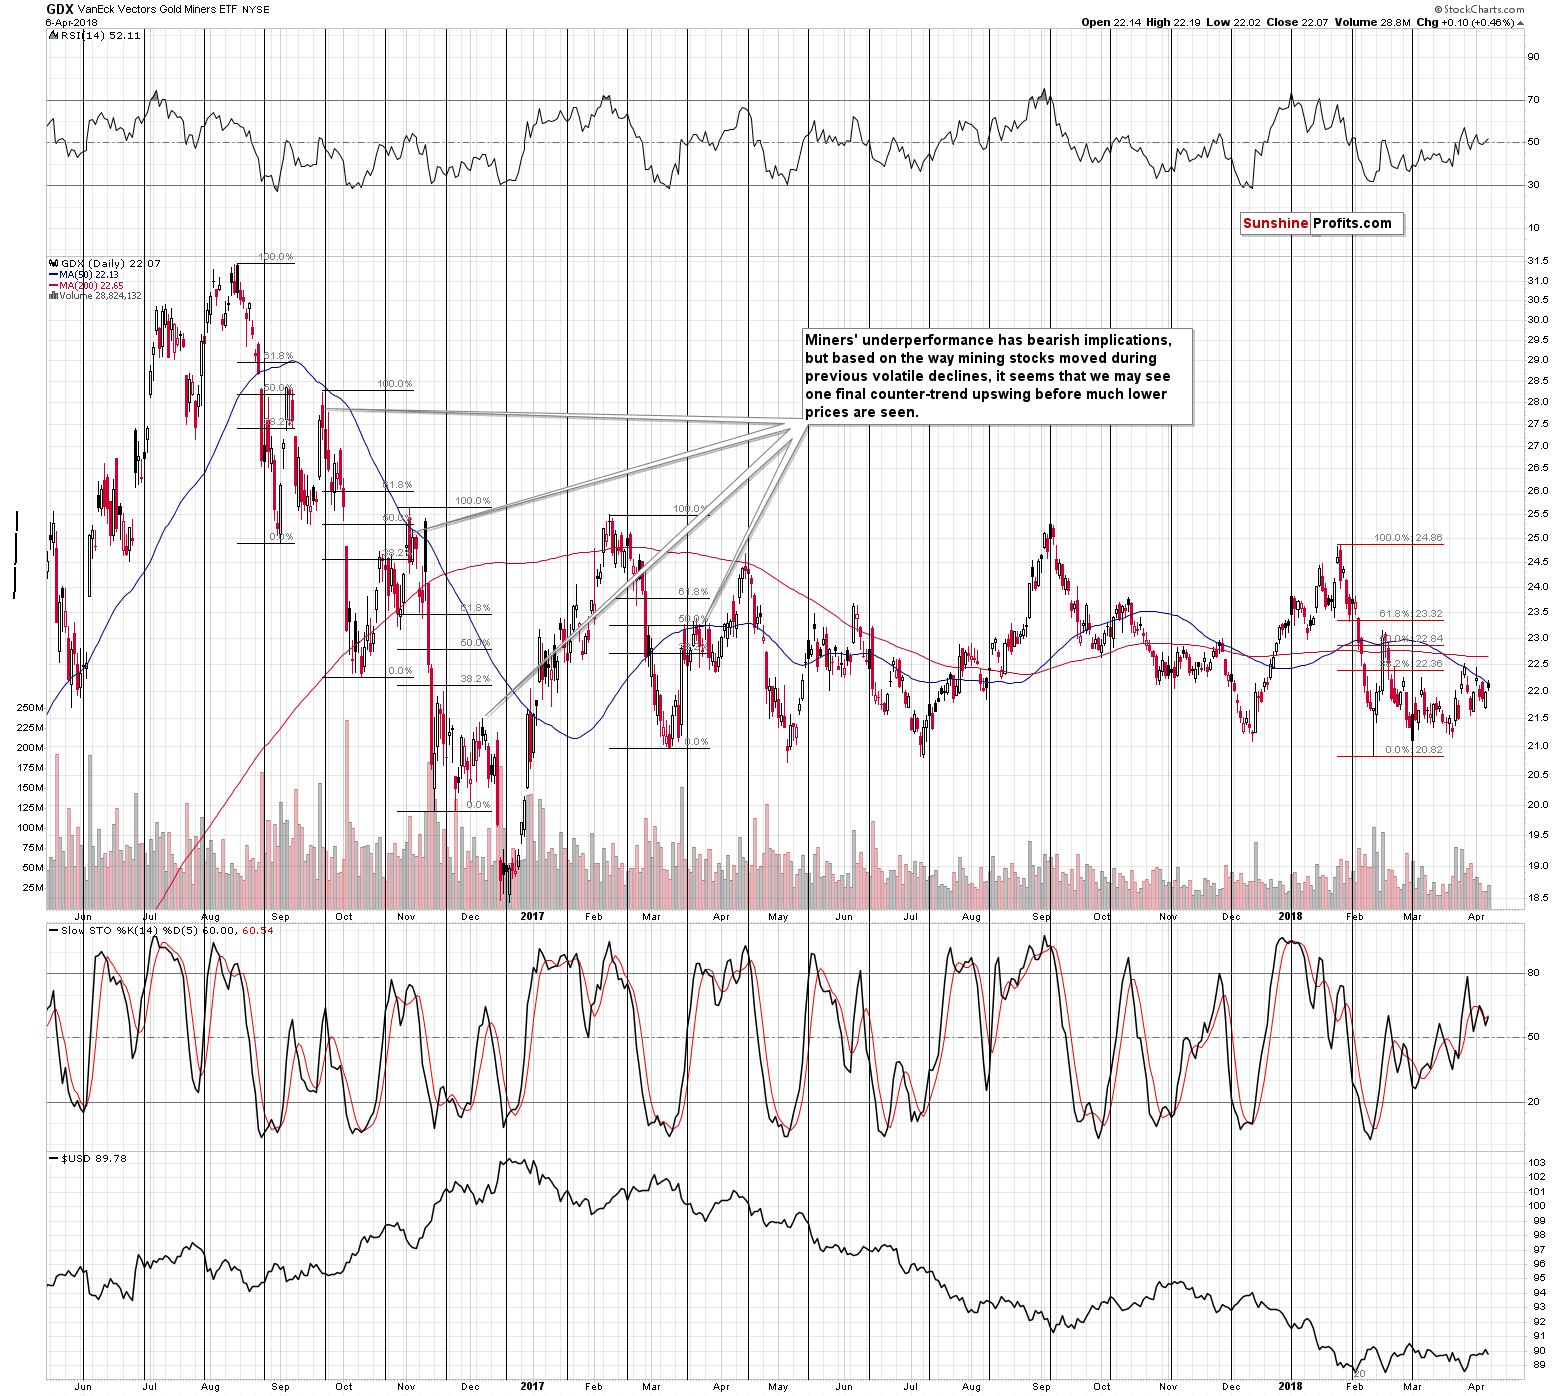
Still, in light of the continuous signs confirming the mining stocks’ underperformance and weakness relative to gold, it’s crystal clear that the miners’ most important sign points to lower precious metals prices.
Please note that in light of the more-than-confirmed breakdown below the 2017 lows in the gold stocks to gold ratio, the underperformance of gold stocks is likely to be the new normal for the PM sector for the months to come. There may and likely will be very short-term deviations from this rule, though, but the overall trend is likely to remain down. The reason is that there is no meaningful support level near the current ratio level. Conversely, the closest strong support is at the 2015 and 2016 lows and below them.
Silver’s Reversal
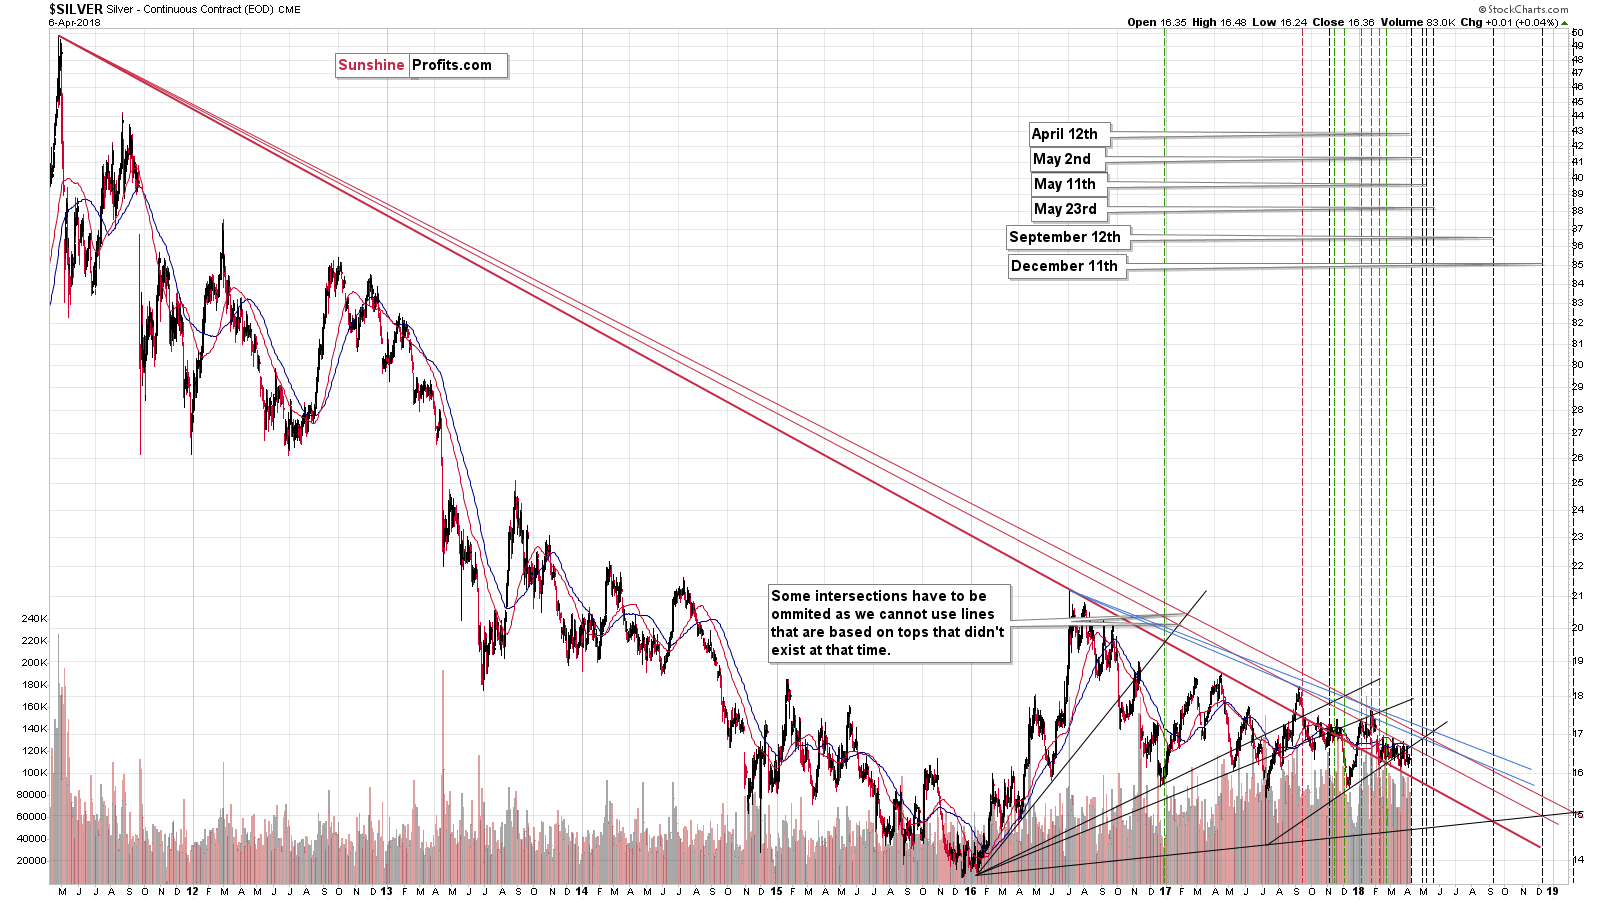
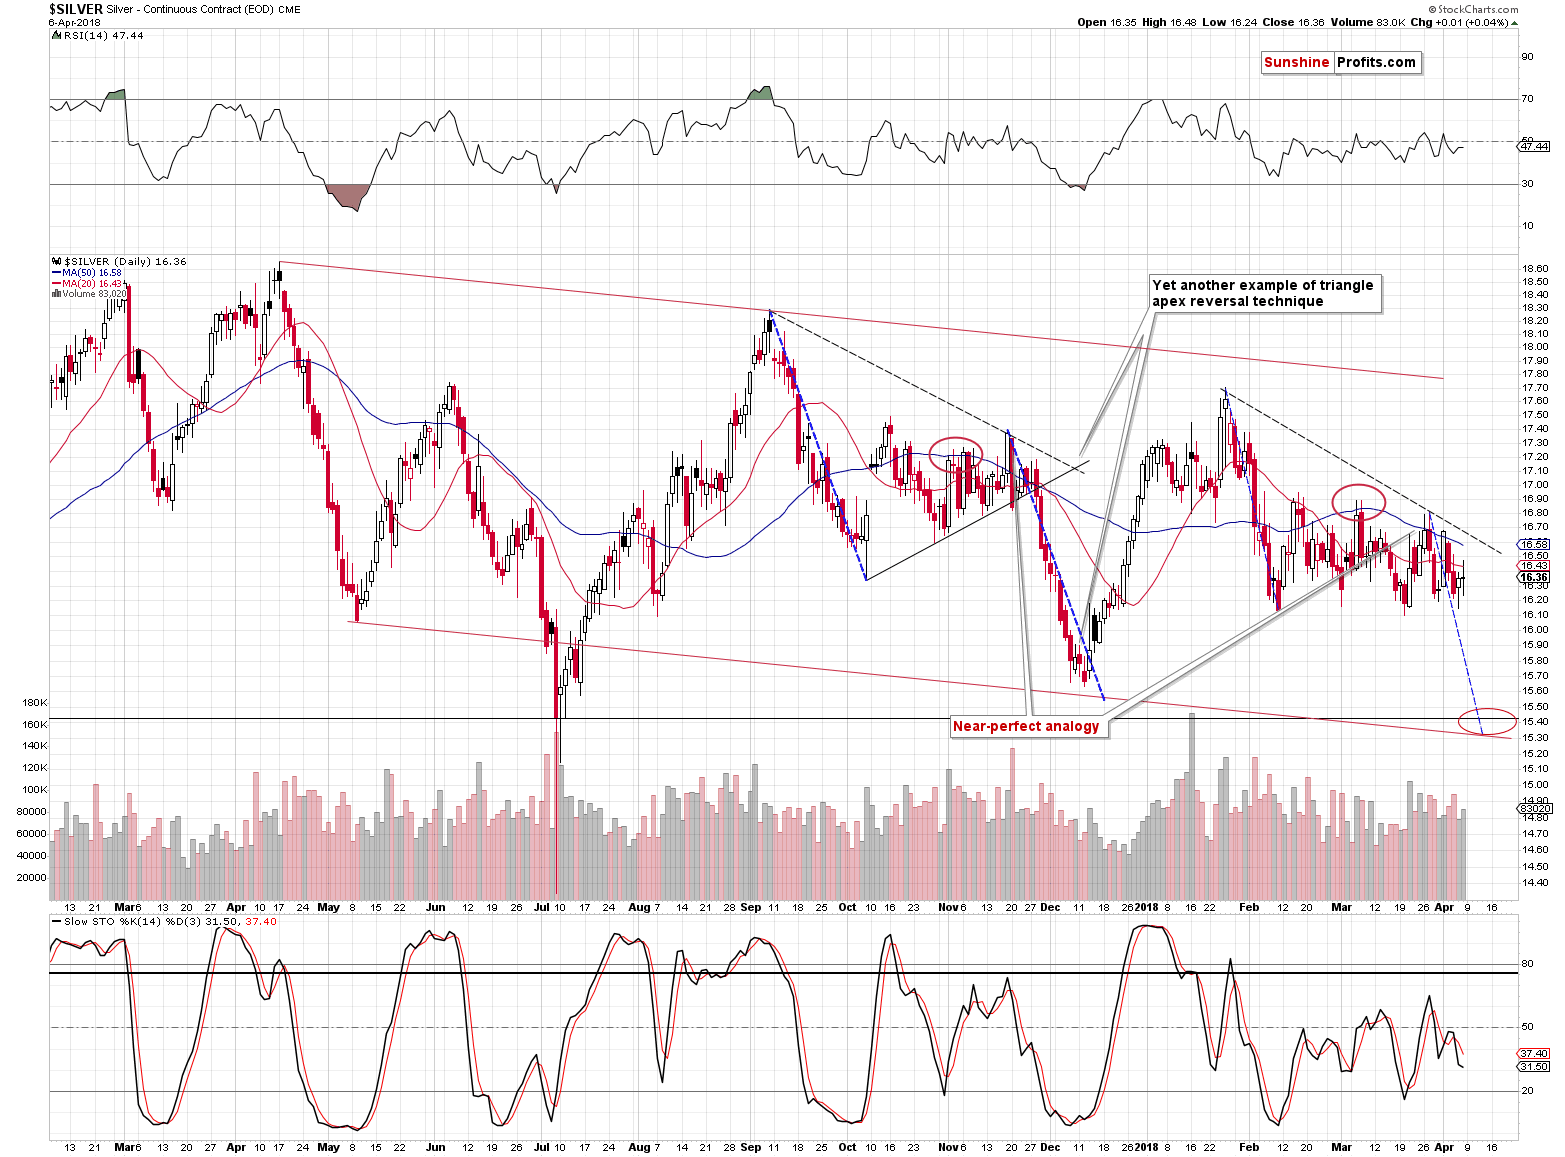
Silver’s triangle-apex-based turning point is still a few days away, so its implications are different than ones of the gold’s and gold stocks’ reversal. Namely, silver is likely to reverse close to the end of this week and in light of its self-similar pattern, the reversal is likely to be seen at much lower prices.
In terms of the analogy to the pattern that we saw from September 2017 to early December 2017, we are now likely in a situation similar to Nov. 28, 2017 – right before the decline.
If we see a decline shortly and silver does indeed reverse in the final part of this week, then the reversal is likely to be seen in the entire precious metals sector, but it will probably be most visible in the case of the white metal. Similarly, please note that we can currently see short-term upswings in the case of gold and in the case of mining stocks, but not really in the case of silver. It could be the case that the former had to rally before the turning point in order for the latter to have bearish implications – after all, this technique is rarely wrong and many other signals (especially the long-term ones) point to much lower prices.
The EUR/USD Breakdown
The situation in the EUR/USD currency pair developed in tune with what we wrote previously:
(…) the thing that we would like to add today is that despite the increased trade conflict tensions the USD’s value didn’t really decrease, which can be a sign that it really wants to move higher, not lower. That’s in perfect tune with our technical analysis of the USDX and also a factor supporting the scenario in which the EUR/USD pair breaks lower shortly.
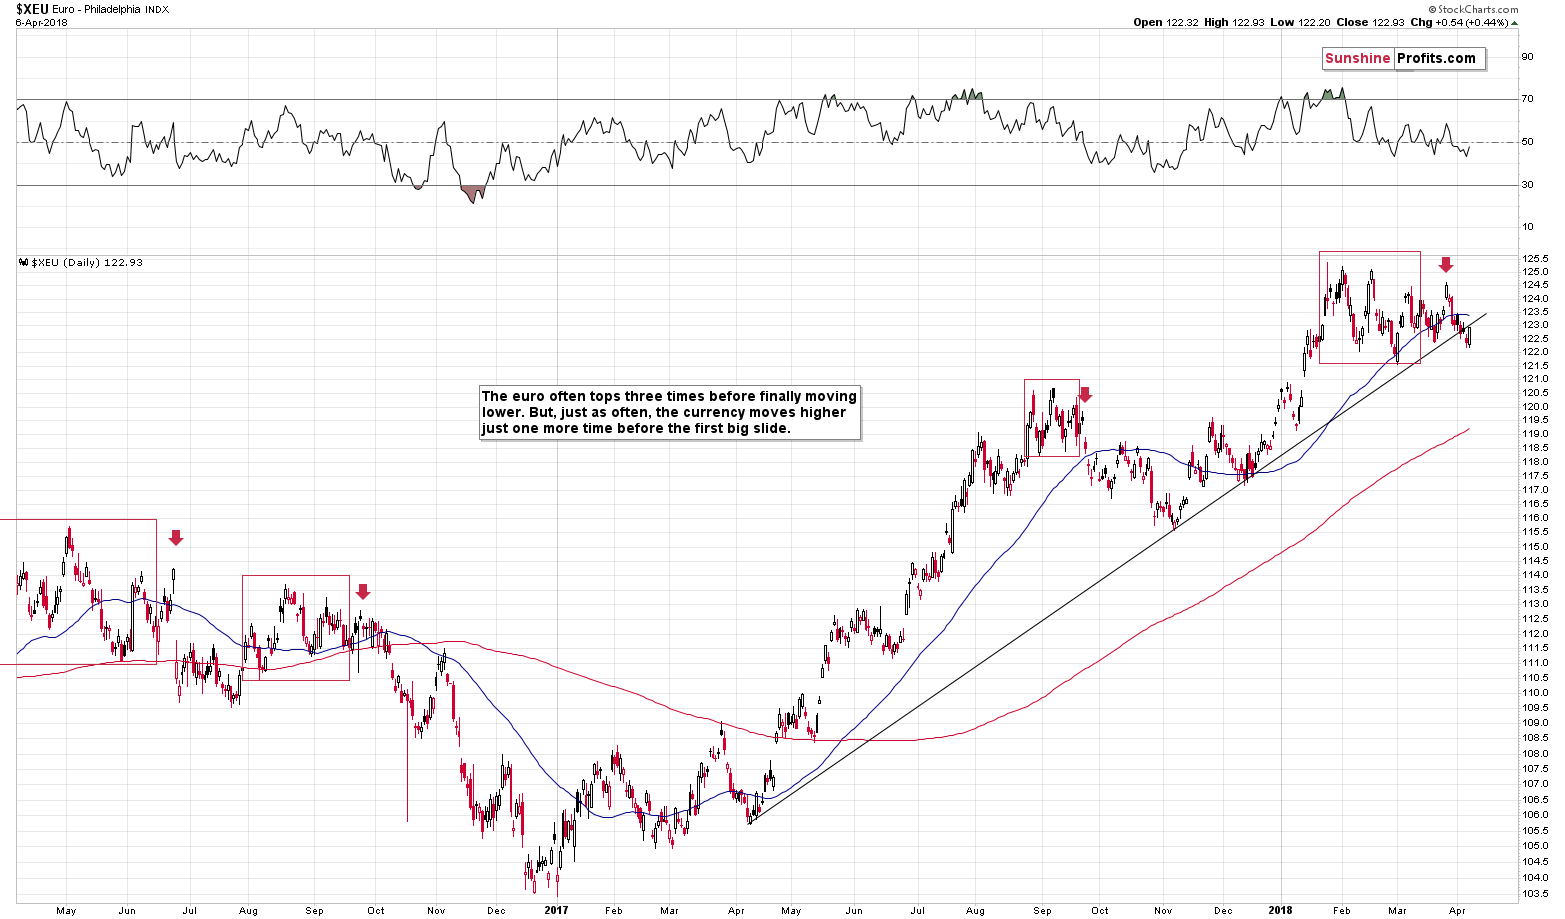
The breakdown is now a fact – it’s clearly visible even from the long-term perspective. In this case, why didn’t traders react to this development in a more meaningful way? Most likely, because it was just one daily close below the support line. The breakdown is not confirmed yet. There are different ways to approach a confirmation of a breakdown. In the case of the precious metals market, it’s usually best to wait for three consecutive closes before viewing a breakdown or breakout as confirmed. In other markets, a two-day rule is more appropriate. Consequently, if we see the euro below the rising support line at today’s close, it will be make the outlook more bearish, and seeing it below it on Monday as well will fully confirm the breakdown and make the outlook very bearish.
Since the breakdown has not been confirmed yet, it’s no wonder that precious metals traders haven’t fully reacted to it. It doesn’t change the fact that the implications of the breakdown are already bearish.
The Euro Index moved higher on Friday but didn’t manage to close the week back above the broken support line. Consequently, the outlook didn’t improve. Conversely, it became more bearish as the European currency closed the day and week without invalidating the breakdown. Given the inverse USD-gold link, and the fact that the EUR/USD is the largest component of the USD Index, the implications for the precious metals market are bearish.
That’s not the only bearish sign from the forex market, though.
Yen’s Time Is Up As Well
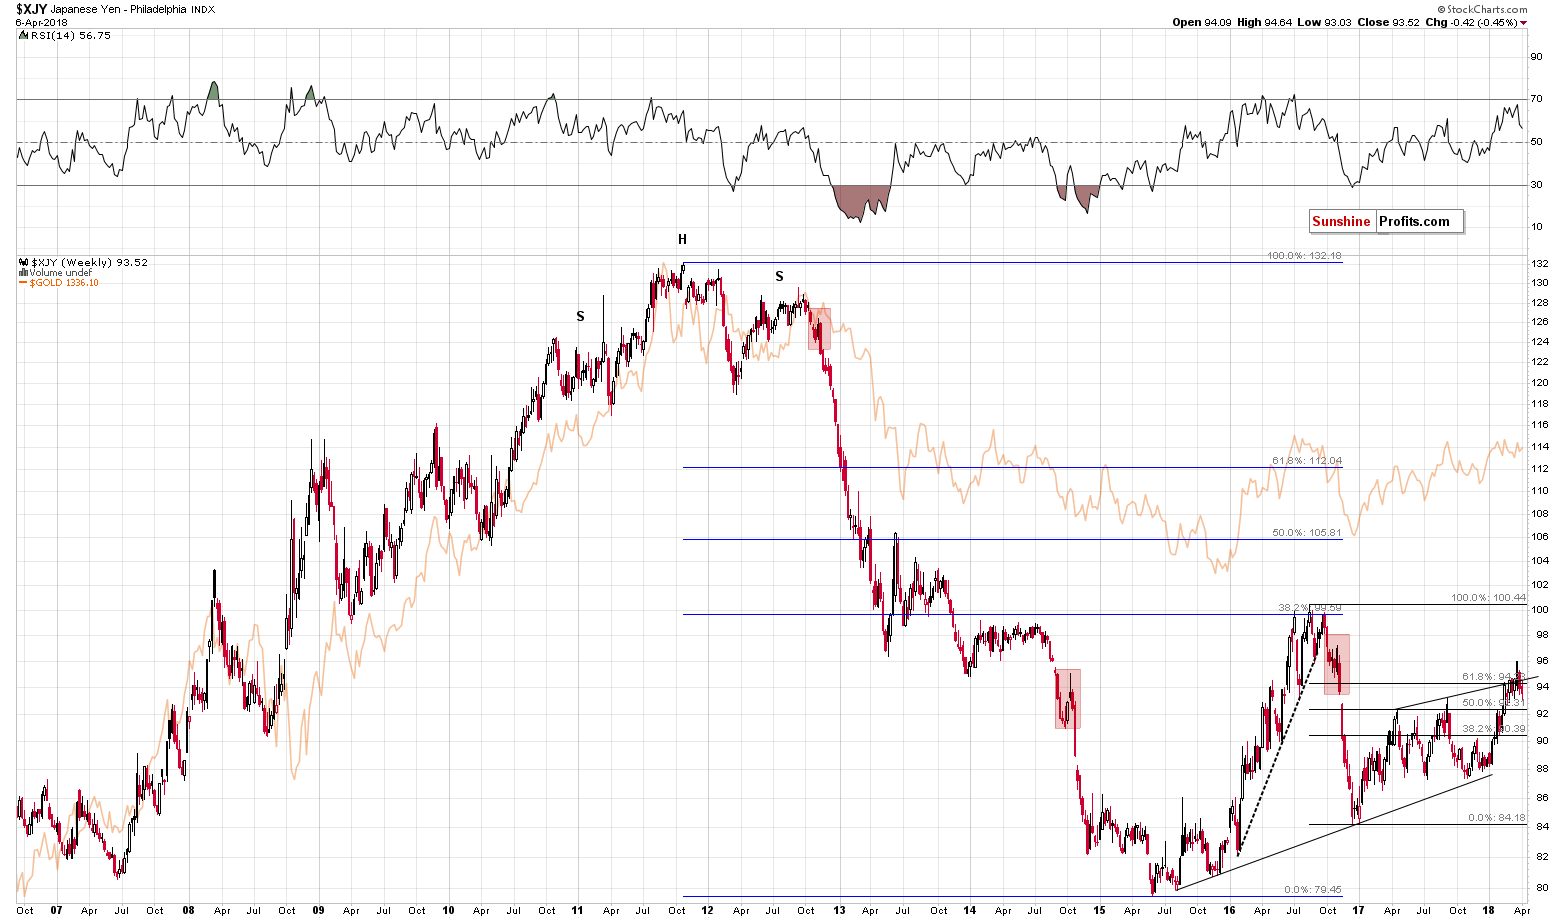
The Japanese currency very often moves in tune with gold, which makes the former an important factor for detecting the outlook for the latter. Consequently, it’s important that the Japanese yen has recently invalidated the breakouts above two strong resistance lines: the 61.8% Fibonacci retracement level and the rising resistance line.
As we explained previously, invalidations of breakouts are often even more meaningful than the breakouts themselves, as it shows that a given market was not able to rally even though it had already broken out and it was technically easy for the price to move higher. This weakness is a very bearish sign for the following weeks for the yen and – in light of the positive link between the two – also for gold.
Gold to Rally Due to Increased Stock Market Volatility? Really?!
We were recently asked if the price of gold is likely to rally because of the increased volatility in stocks. This seems believable at the first sight, as gold is seen as a safe-haven asset and thus people could be buying it when the stock market’s movement becomes chaotic, scary and/or unpredictable.
So, the stock market’s volatile decline in the recent days is likely to become the catalyst for gold’s breakout above the $1,350 - $1,400 trading range, right?
Wrong.
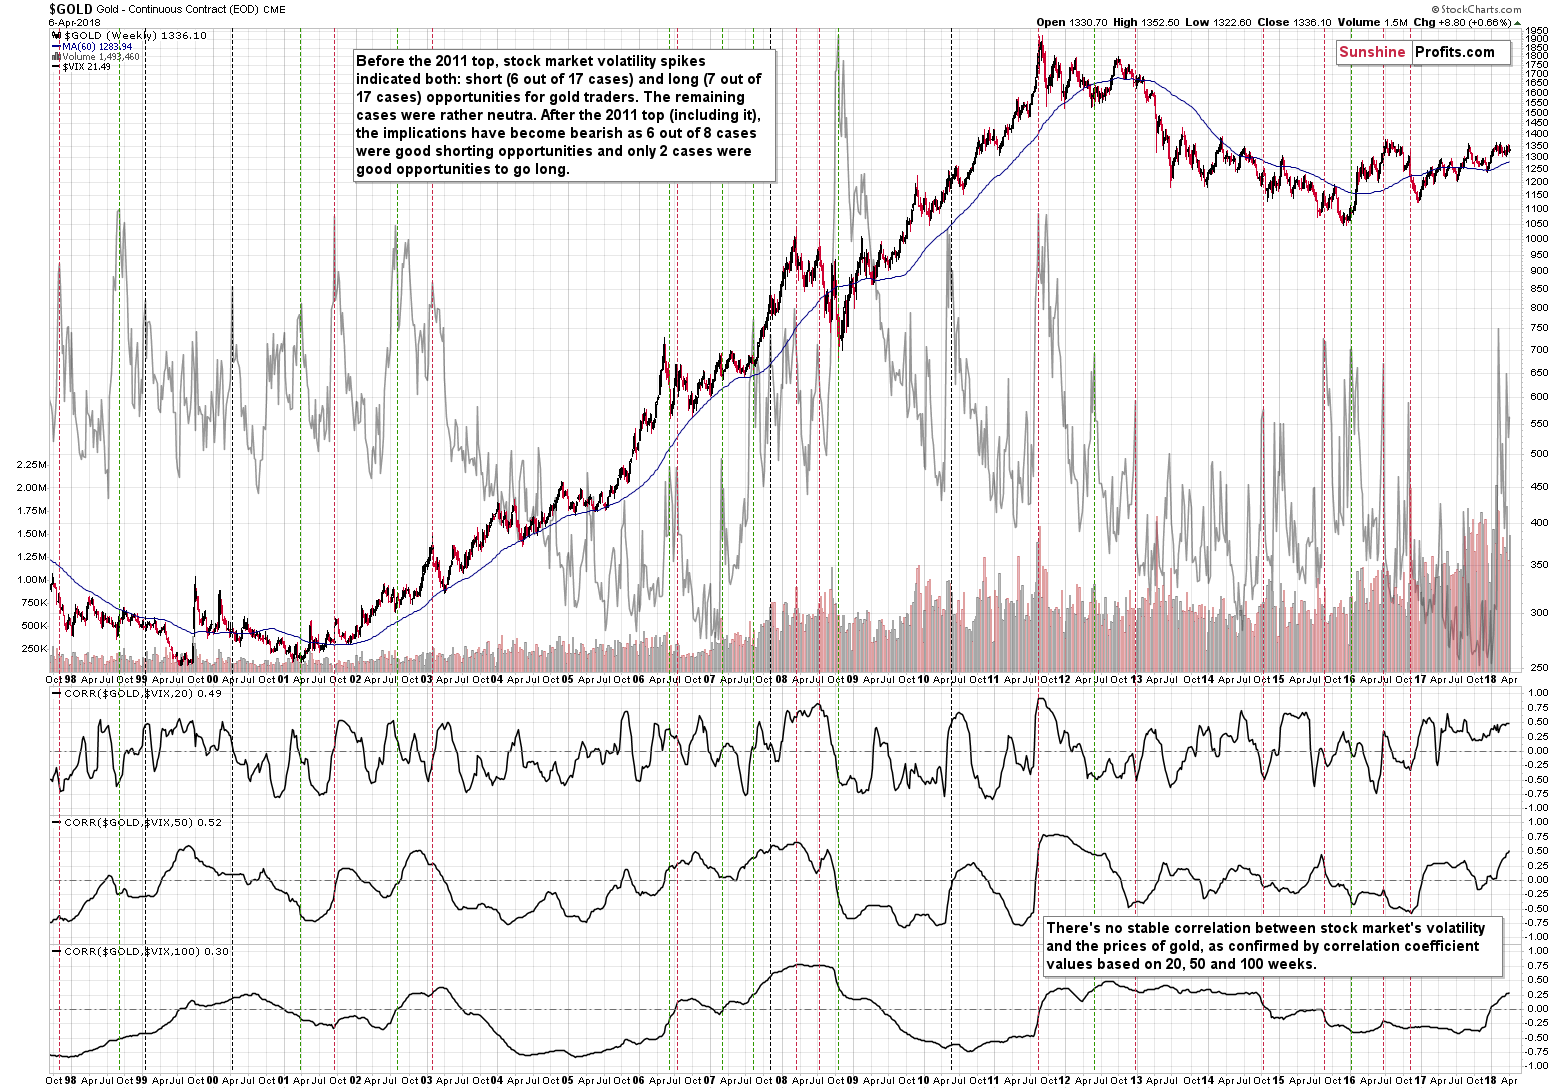
That’s simply not how things work. The above scenario sounds believable, but its not how gold responds to increased volatility and the above chart proves it.
Let’s start with the lower part of the above chart that features both gold and the VIX index, which we use as a proxy for the stock market’s volatility. If gold was to reflect the stocks’ volatility, it should be taking place more or less all the time – or at least for the significant majority of time. That clearly wasn’t the case and the correlation coefficients reflect that.
We checked the relationship between gold and the VIX in terms of correlation in three versions: based on the 20 weeks of data, based on 50 weeks and based on 100 weeks. The value of the correlation coefficient moves back and forth around 0 in all cases (and in all other cases that we checked but that we don’t feature on the above chart to preserve its readability). This means that there is no stable correlation between the two. This alone is something that should make you think that it’s not safe to base the bullish outlook on stocks’ volatility.
But wait, there’s more.
Putting correlations aside, let’s see what happened when the volatility spiked, just like what we saw recently. Maybe the relationship is not present at all times, but it’s there during critical times.
Wrong again. This time a bit less, because there is a mildly strong tendency for gold to reverse its course during the VIX’s spikes. It doesn’t mean that gold always bottoms at that time, though. Remember the 2011 top in gold? It was accompanied by a spike in the VIX – the measure that’s supposed to indicate breakouts and trigger further rallies.
We marked the noteworthy spikes in the VIX with vertical lines on the above chart. Before the 2011 top, there was a similar number of cases that were good opportunities to go long (7 out of 17 cases) as there were good opportunities to go short (6 out of 17 cases). It’s not clear which positions would be better in the remaining cases (too much depends on one’s individual approach). In other words, a spike in the volatility of stocks usually suggested that some kind of move was about to be seen, but it didn’t indicate what kind of move that would be. Consequently, it was not a useful sign for detecting good moments to go long or short – at least not on its own.
Since 2011 things have changed as 75% of cases (6 out of 8) were good shorting opportunities. The remaining 2 cases were good opportunities to go long. So, on average, it seems that as far as the current stage of the gold market is concerned, spikes in the VIX should be viewed a sell signs for gold rather than buy signs.
Naturally, the above is not strong enough on its own to make the outlook bearish, but it’s a useful confirmation technique that can supplement other, more reliable, signals.
During the most recent spike in the VIX, gold was just after a short-term upswing and the rally stopped shortly. It seems like it is yet another time when the increased volatility in the stock market confirms that we currently have a great shorting opportunity.
Summary
Summing up, it seems that we’re about to see a decline in precious metals based on the recent move higher and the triangle-apex-based reversals in gold and gold stocks. The Euro Index’s inability to invalidate the breakdown below its medium-term support line and invalidation of the breakouts in the case of the Japanese yen both point to lower PM prices and the same goes for the continuous weakness in mining stocks. The sudden jump in the volatility of the general stock market seems to have confirmed that the top is already in. The outlook remains bearish.
As always, we will keep you – our subscribers – informed.
To summarize:
Trading capital (supplementary part of the portfolio; our opinion): Full short positions (200% of the full position) in gold, silver and mining stocks are justified from the risk/reward perspective with the following stop-loss orders and initial target price levels:
- Gold: initial target price: $1,218; stop-loss: $1,382; initial target price for the DGLD ETN: $53.98; stop-loss for the DGLD ETN $37.68
- Silver: initial target price: $14.63; stop-loss: $17.33; initial target price for the DSLV ETN: $33.88; stop-loss for the DSLV ETN $21.48
- Mining stocks (price levels for the GDX ETF): initial target price: $19.22; stop-loss: $23.54; initial target price for the DUST ETF: $39.88; stop-loss for the DUST ETF $21.46
In case one wants to bet on junior mining stocks' prices (we do not suggest doing so – we think senior mining stocks are more predictable in the case of short-term trades – if one wants to do it anyway, we provide the details), here are the stop-loss details and initial target prices:
- GDXJ ETF: initial target price: $27.82; stop-loss: $36.14
- JDST ETF: initial target price: $94.88 stop-loss: $41.86
Long-term capital (core part of the portfolio; our opinion): No positions (in other words: cash)
Insurance capital (core part of the portfolio; our opinion): Full position
Important Details for New Subscribers
Whether you already subscribed or not, we encourage you to find out how to make the most of our alerts and read our replies to the most common alert-and-gold-trading-related-questions.
Please note that the in the trading section we describe the situation for the day that the alert is posted. In other words, it we are writing about a speculative position, it means that it is up-to-date on the day it was posted. We are also featuring the initial target prices, so that you can decide whether keeping a position on a given day is something that is in tune with your approach (some moves are too small for medium-term traders and some might appear too big for day-traders).
Plus, you might want to read why our stop-loss orders are usually relatively far from the current price.
Please note that a full position doesn’t mean using all of the capital for a given trade. You will find details on our thoughts on gold portfolio structuring in the Key Insights section on our website.
As a reminder – “initial target price” means exactly that – an “initial” one, it’s not a price level at which we suggest closing positions. If this becomes the case (like it did in the previous trade) we will refer to these levels as levels of exit orders (exactly as we’ve done previously). Stop-loss levels, however, are naturally not “initial”, but something that, in our opinion, might be entered as an order.
Since it is impossible to synchronize target prices and stop-loss levels for all the ETFs and ETNs with the main markets that we provide these levels for (gold, silver and mining stocks – the GDX ETF), the stop-loss levels and target prices for other ETNs and ETF (among other: UGLD, DGLD, USLV, DSLV, NUGT, DUST, JNUG, JDST) are provided as supplementary, and not as “final”. This means that if a stop-loss or a target level is reached for any of the “additional instruments” (DGLD for instance), but not for the “main instrument” (gold in this case), we will view positions in both gold and DGLD as still open and the stop-loss for DGLD would have to be moved lower. On the other hand, if gold moves to a stop-loss level but DGLD doesn’t, then we will view both positions (in gold and DGLD) as closed. In other words, since it’s not possible to be 100% certain that each related instrument moves to a given level when the underlying instrument does, we can’t provide levels that would be binding. The levels that we do provide are our best estimate of the levels that will correspond to the levels in the underlying assets, but it will be the underlying assets that one will need to focus on regarding the signs pointing to closing a given position or keeping it open. We might adjust the levels in the “additional instruments” without adjusting the levels in the “main instruments”, which will simply mean that we have improved our estimation of these levels, not that we changed our outlook on the markets. We are already working on a tool that would update these levels on a daily basis for the most popular ETFs, ETNs and individual mining stocks.
Our preferred ways to invest in and to trade gold along with the reasoning can be found in the how to buy gold section. Additionally, our preferred ETFs and ETNs can be found in our Gold & Silver ETF Ranking.
As a reminder, Gold & Silver Trading Alerts are posted before or on each trading day (we usually post them before the opening bell, but we don't promise doing that each day). If there's anything urgent, we will send you an additional small alert before posting the main one.
=====
Latest Free Trading Alerts:
Is Bitcoin worthless? Depreciation brings such questions as it has in the past. Bitcoin traders might be worried by such statements. But should they be anxious? In the whirlwind of opinions, we can find a theme which might allow profits on our hypothetical positions to grow even further.
Not Quite Worthless, Potentially Profitable
=====
Hand-picked precious-metals-related links:
PRECIOUS-Gold steady as investors await fresh move in U.S.-China trade spat
=====
In other news:
Bad Omen for Markets From First Signs of Yield Curve Inversion
China Is Studying Yuan Devaluation as a Tool in Trade Spat
China and US exchange further threats over trade as markets slump
More turmoil at Germany's biggest bank: Deutsche Bank's CEO is out
=====
Thank you.
Sincerely,
Przemyslaw Radomski, CFA
Founder, Editor-in-chief, Gold & Silver Fund Manager
Gold & Silver Trading Alerts
Forex Trading Alerts
Oil Investment Updates
Oil Trading Alerts

