

Is Bitcoin worthless? Depreciation brings such questions as it has in the past. Bitcoin traders might be worried by such statements. But should they be anxious? In the whirlwind of opinions, we can find a theme which might allow profits on our hypothetical positions to grow even further.
The fact that Bitcoin is going down prompts all sort of analyses to come out. No big surprise that some of them are pretty bearish. In a piece on CNBC, we read:
Bitcoin is likely to fare worse than other assets in the coming months because it has no fundamental worth, an investment research firm said in a note Thursday.
London-based Capital Economics explained that the cryptocurrency has been quite closely correlated to the S&P 500 since the price started to fall from its record high at the end of last year.
But the correlation has been coincidental and related to specific factors. For bitcoin, the recent fall in value has been due to a plethora of factors including rising concern over regulation, a ban on cryptocurrency advertising from major internet platforms and some banks banning customers from buying it via credit cards.
(...)
"Bitcoin's correlation with equity prices has strengthened recently, but we think that this will be just temporary. We still think that bitcoin is essentially worthless, meaning that it is likely to fare much worse than other assets in the coming months," Capital Economics said.
This is pretty extreme. Is there any merit to this? Our take here is that you need to break the statement into two parts. The first part is the assertion that any recent correlation between Bitcoin and stocks has been coincidental. This is not a very precise thing to measure. What do we mean by correlation here? The general co-movement of assets? The precise measure of 1-day correlation over a 30-day period? Something else? A short glance at gold and silver correlations shows that there is more than just one way to define even a precise measure? So, the assessment that stocks and Bitcoin have been correlated is tenuous at best. Now, if we do focus on the rolling 90-day correlation between Bitcoin and the S&P500, the correlation coefficient stands at around 4%. Widening the horizon doesn’t help, with the coefficient still visibly below 10%. Long story short, this means that there is actually no visible coincidence in the returns of Bitcoin and stocks. So much for the idea that Bitcoin and stocks actually move together. Now, it seems that stating that the correlation has been coincidental doesn’t seem to be precise. There probably was no correlation at all in the first place, at least in terms of precise measures. This fits in quite well with the idea we have been writing about for some time now – namely, that Bitcoin is not driven by factors driving other assets.
The second part of the statement is that Bitcoin is “worthless.” In fact, Bitcoin doesn’t produce anything, its valuation is problematic and its exchange rate is mostly defined by what market participants are willing to pay for it. But wait, isn’t this the case with other assets as well? If this seems ridiculous, take a second to analyze this. There are certainly stocks traded in the market which are not worth the price people are willing to pay for them. Think about Enron – a company which rapidly went from being the next hot thing to zero. In some sense, all assets depend on what people are willing to pay for them. You could find more such examples – currencies which went bust (Argentine peso), banks (Lehman Brothers), tech stocks, junk bonds and so on. So, as long as Bitcoin is in the market and people are willing to pay for it, we wouldn’t call it worthless. We would rather recast this statement as “Bitcoin might be a lot less stable than established asset classes.” The idea here is that Bitcoin is not worthless but a lot more volatile than stocks, bonds and so on, on average. So, while the currency is not bound to go to zero but rather it might be extremely volatile. This is the theme which allows us to profit on moves in Bitcoin irrespective of whether the move is up or down. We have to be on the lookout for signs of a continuation of a trend or a reversal.
Bitcoin Continues Move down
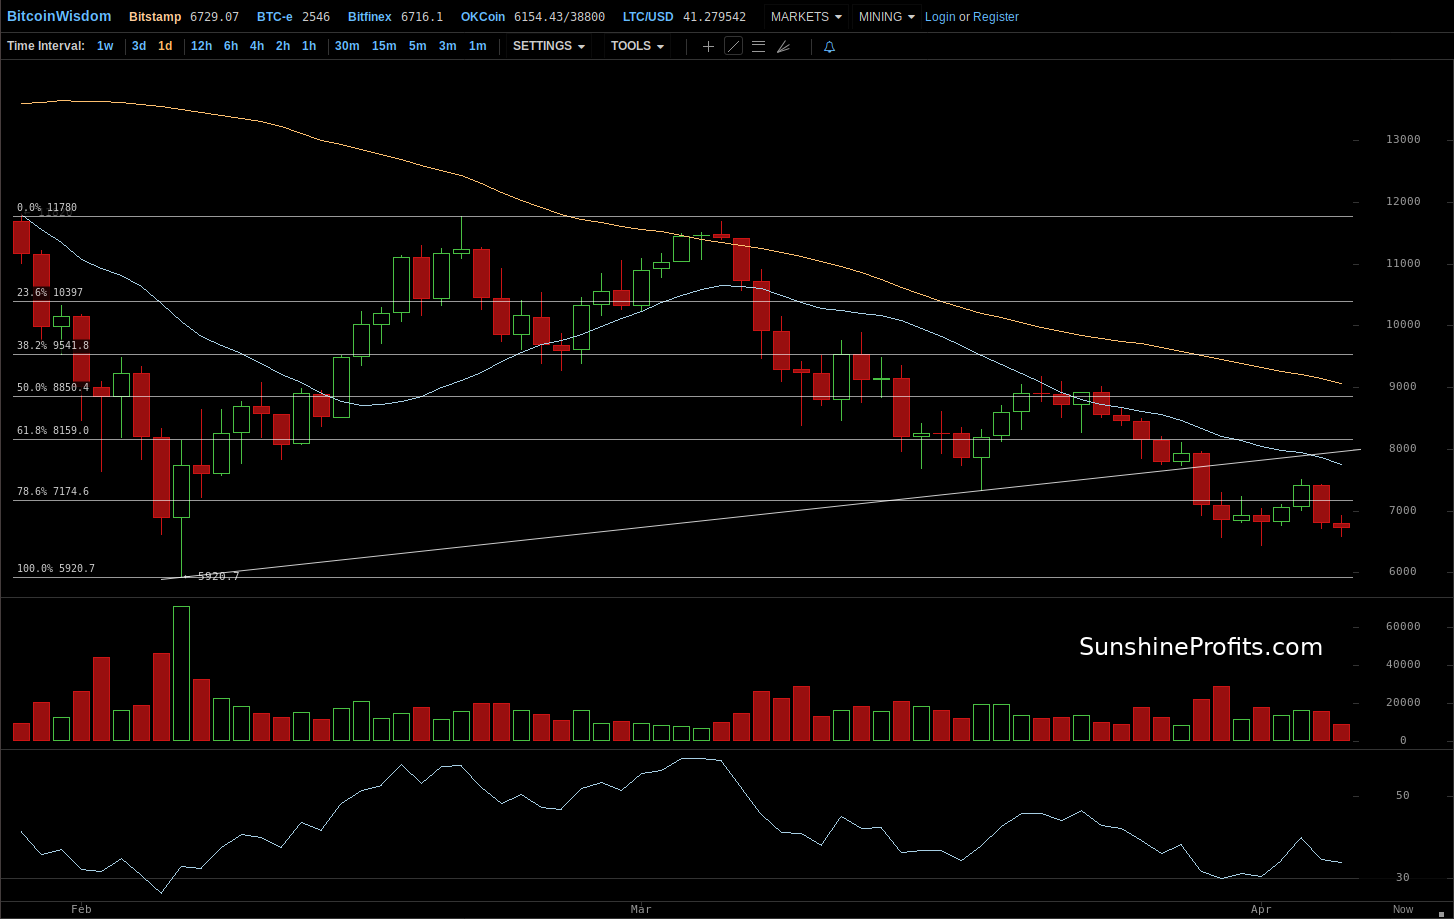
The short-term BitStamp chart shows the decline from around $12,000 and, more recently, from $9,000. Bitcoin is now below $7,000, after a couple of days of depreciation. It is also firmly below the rising resistance line based on recent local bottoms. In terms of the Fibonacci retracement levels, Bitcoin is now below the 78.6% level, which in itself is not that important, but what might lend this level additional importance is the fact that Bitcoin tested this level, going above it quite briefly, but came back below it. This is an additional bearish indication. The one level left is the 100% one, at slightly below $6,000. This means that Bitcoin is not far from the level at which all of the recent correction from $6,000 to $12,000 would be erased. $6,000 is the one level which might cause the current move to pause. If this level is taken out, we might see more serious declines.
Acceleration in Sight
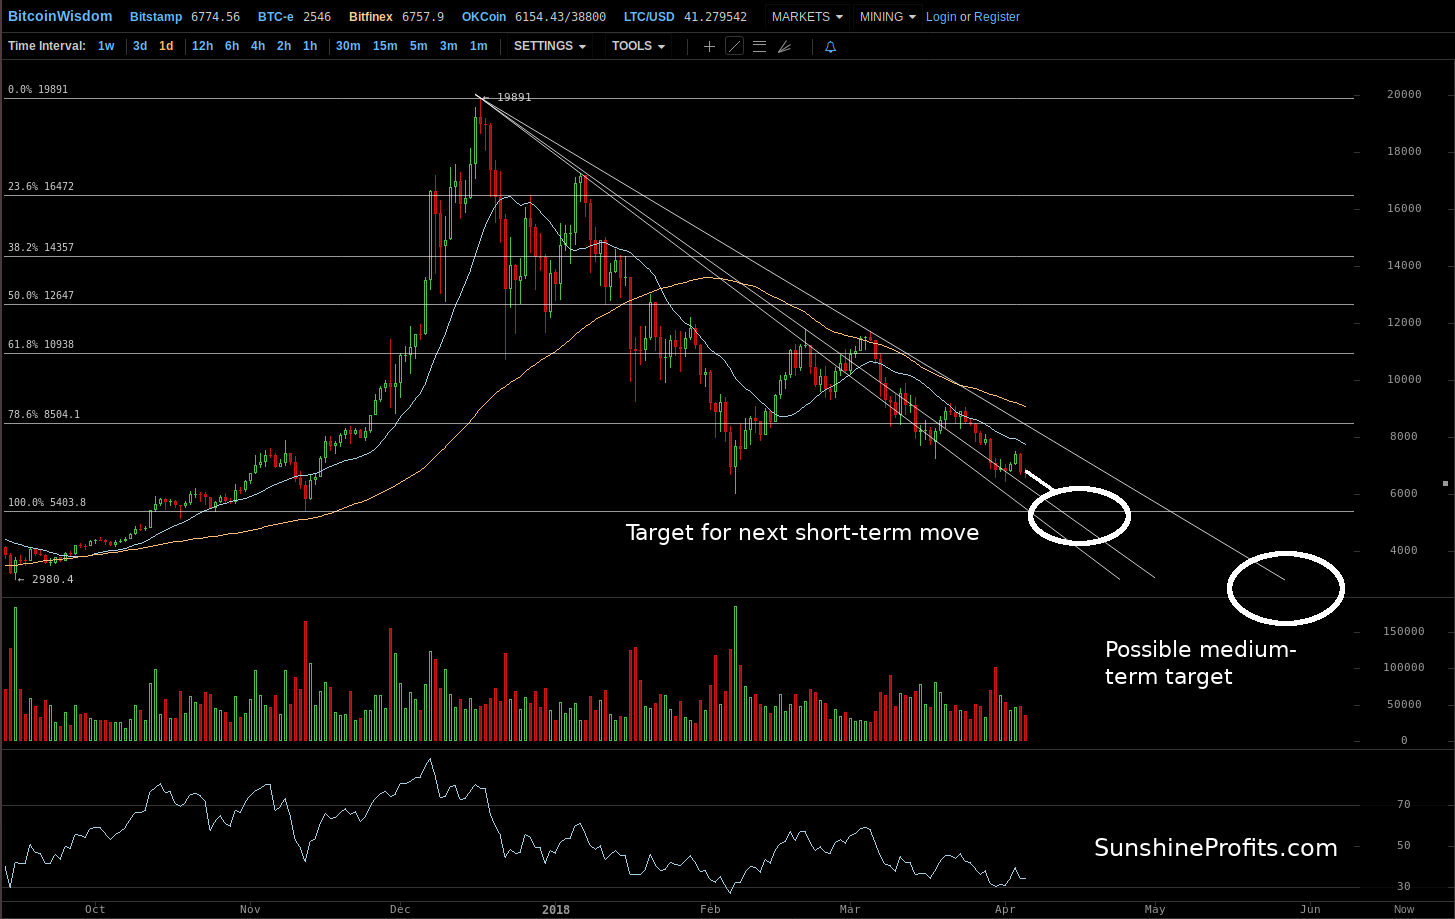
On the long-term Bitfinex chart, we see that the currency is below one of the three declining trend lines based on local tops. The second line is very close – we saw Bitcoin test it and now it looks like it’s coming back to this line. This might mean that the decline is accelerating slightly, but we do have the third, lowest, line, which might suggest that the move down is yet to unfold in a more meaningful way.
Based on the Fibonacci retracement levels, we are below the 78.6% level (a different one than in the case of the short-term chart). The 100% level at $5,400 is not very far and it might be a very important one. Recall that based on the previous chart, one of the local bottoms around $6,000 (early February) might be an important support level. Combine that with $5,400 from the chart above, and you get $5,500-6,000 as a potentially very significant area where we could see a rebound.
If this area might bring a rebound and it’s not that far away, why don’t we close the already profitable hypothetical positions? The first reason is that there still seems to be room for declines, as Bitcoin is not oversold in terms of the RSI and the recent move has been in line with the trend down. So, Bitcoin might break down below $5,500 and accelerate significantly. Even more importantly, if this level is broken, the next one is around $3,000, so the move might be quite volatile. The second reason is that even if we see a move to the upside, the reversal might be quite sharp and there might not be time to get back in, so it might be worth to simply wait out any potential short-lived rebound. If we see a move up and a sharp reversal, the indications might be even more bearish than they are now, and the profits on the hypothetical positions might grow even further.
If you have enjoyed the above analysis and would like to receive free follow-ups, we encourage you to sign up for our daily newsletter – it’s free and if you don’t like it, you can unsubscribe with just 2 clicks. If you sign up today, you’ll also get 7 days of free access to our premium daily Gold & Silver Trading Alerts. Sign me up!
Thank you.
Regards,
Mike McAra
Bitcoin Trading Strategist
Bitcoin Trading Alerts
