

Briefly: in our opinion, full (250% of the regular size of the position) speculative short position in gold, silver, and mining stocks are justified from the risk/reward perspective at the moment of publishing this Alert.
Silver soared - and silver plunged. The history repeated itself to the letter. Practically each time after silver finally shows strength relative to gold, and silver investors cheer, the rally is invalidated, and a massive decline follows. While we think that silver's investment potential for the long run is enormous and we have special plans for the white metal in our long-term investment strategy, it doesn't prevent us from using the above mechanism as a reliable sell signal. We shorted the silver market on the day of the exact top and just one day later, silver already erased most of its May-June rally. Yesterday's closing price was the lowest in June. There's still huge potential in this trade, but one may be wondering if it's due to the decline's potential continuation, or perhaps based on the rally that might follow such a dramatic daily plunge...
In short, the former is much more likely. The decline seems to have only begun.
Let's take a look at the charts for details.
Silver and the Rest of the Squad
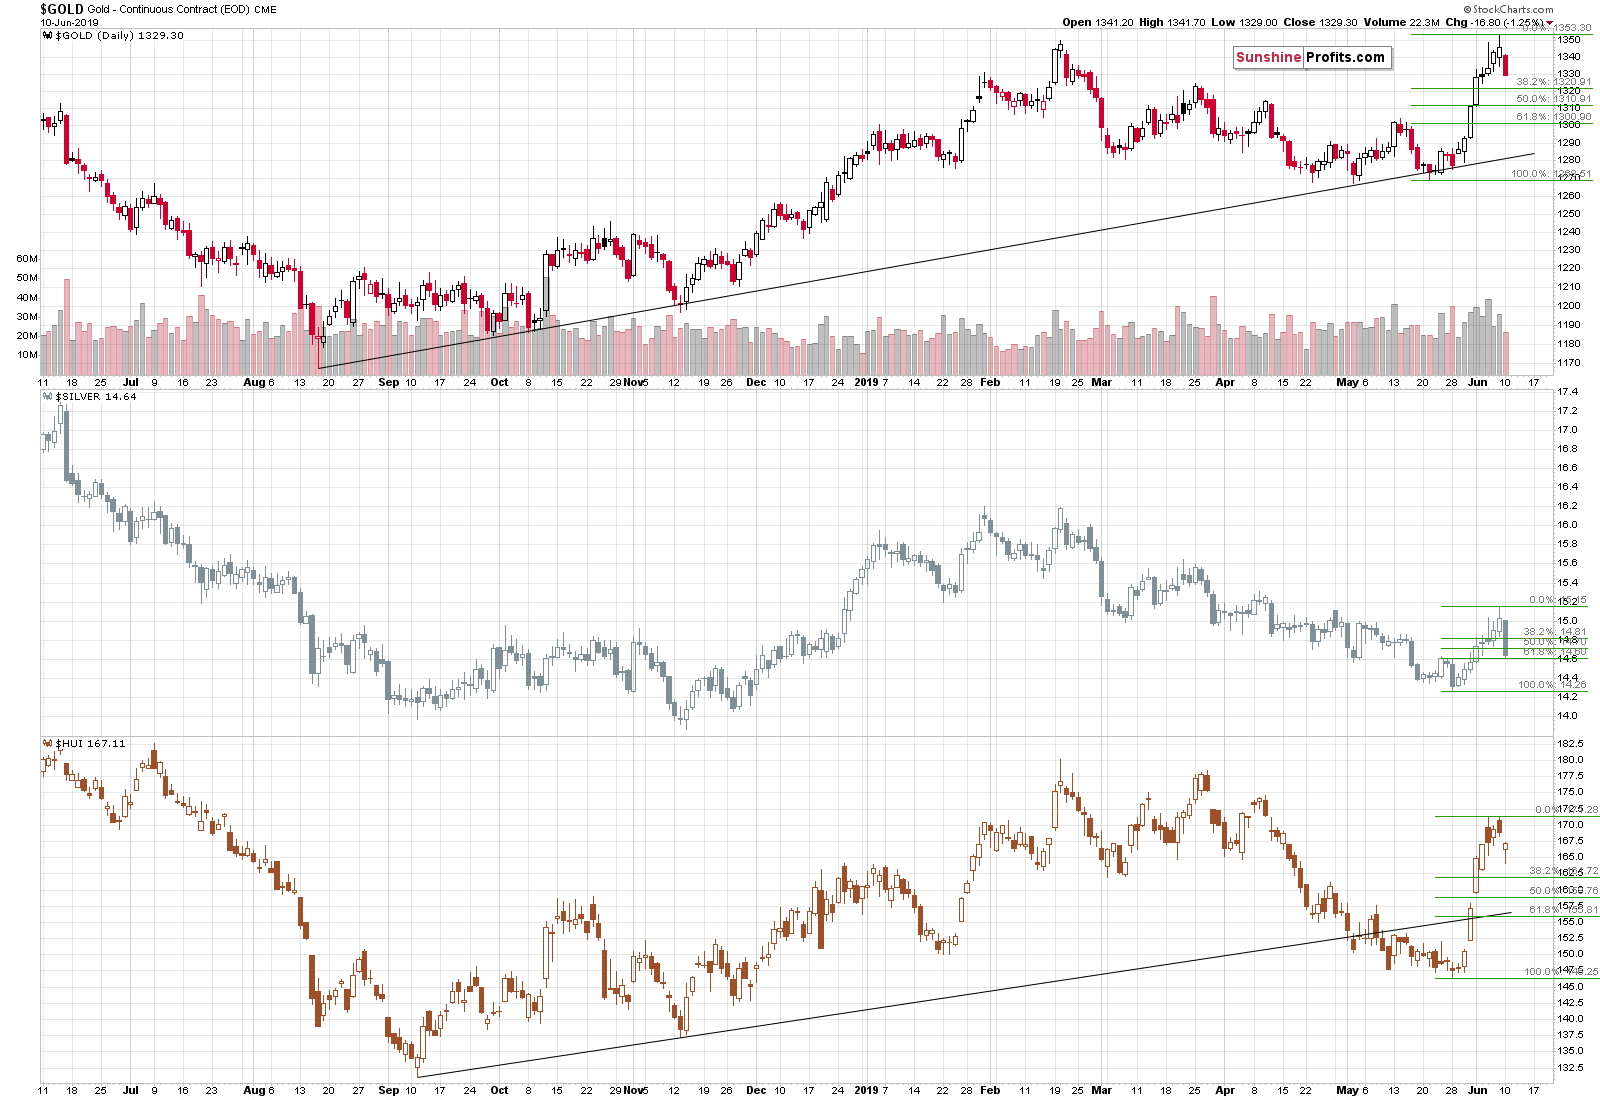
On the above short-term chart, we can see that silver's decline is indeed the most profound one. Gold and mining stocks declined as well, but they haven't moved to even their respective 38.2% Fibonacci retracement levels. There are two good reasons to think that the decline will continue:
- The long-term analogies based on huge volume spikes in gold that we outlined yesterday (the implications are profound - please be sure to examine them).
- The analogy to the most recent decline from about $1,350 - the late-February decline. Gold paused a bit after the initial daily decline, but the slide accelerated in the following days.
Based on the latter analogy, we can expect gold to erase the entire May-June rally - likely this month. Based on the former analogy, we should be expecting gold to move well below the previous 2019 lows in the following weeks.
Let's move back to silver for a moment.
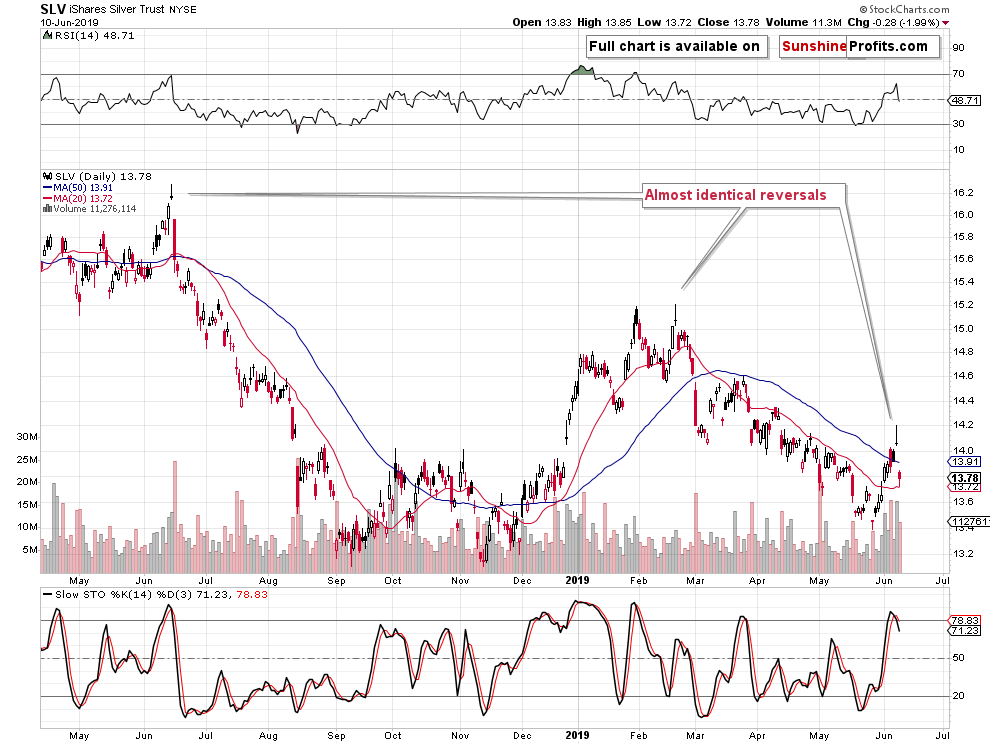
In yesterday's Alert, we wrote the following about the above SLV ETF chart:
Friday's session took a very specific shape. It was a reversal candlestick pattern known as the gravestone doji. There were two cases in the recent past when we saw practically identical move after a very similar preceding rally. It was in the second half of February 2019 and it was almost exactly a year ago - in June 2018. In both cases, shortly after silver reversed in the aforementioned way, it erased the entire preceding rally and then declined much move. The implications here are very bearish.
So far SLV erased "only" most of the rally. But let's keep in mind that it was just one trading day. Give silver a few more days, and it will likely be at new 2019 lows.
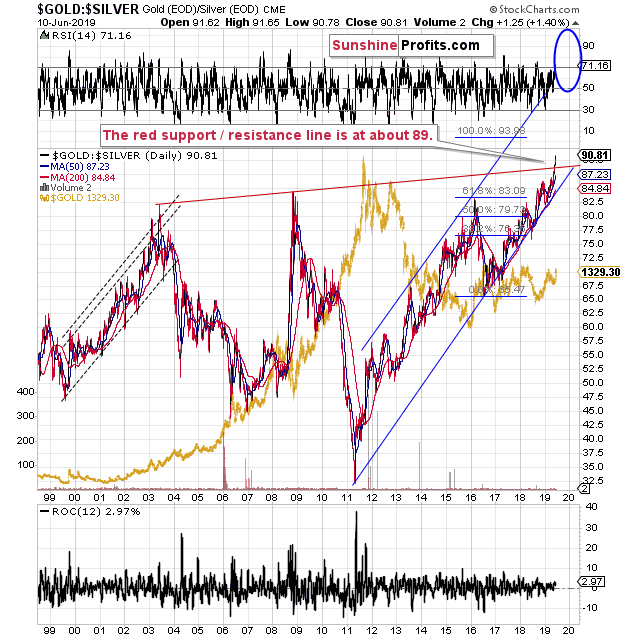
Remember how everyone and their brother told you that the gold to silver ratio moved to the previous highs and that it was topping. Practically nobody noticed that the ratio actually broke above the previous highs and that the real long-term resistance is much higher - at the 100 level. The recent slide in silver is one of the implications. More of them will follow in the next weeks and months. Silver is likely to move below its 2015 low relatively soon (perhaps even in June) and that's when quite a few investors will start to panic.
Many will scream "manipulation", while forgetting that they choose to ignore the breakout in the all-important gold to silver ratio many weeks before and follow gold-and-silver-promoting materials instead of analyses.
Visiting the Miners
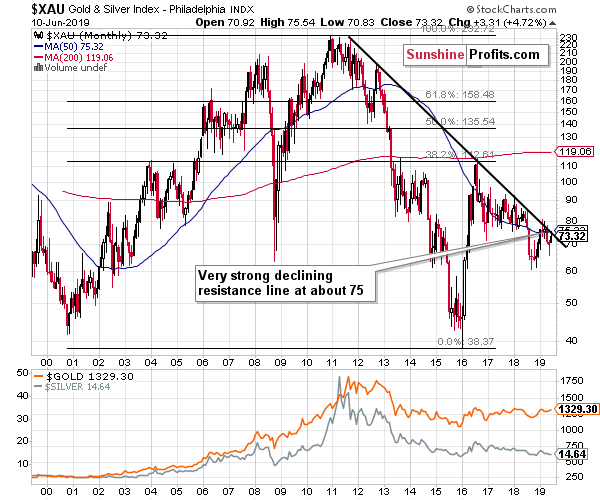
On Friday, we wrote the following about the XAU Index:
The very long-term and very strong (based on multiple important tops) declining resistance line is at about 75. The XAU Index just closed at 74.41. While a temporary move above this line is quite possible - after all, it happened earlier this year - a big move above it is very unlikely. Invalidation of the small breakout would be much more likely, and another powerful slide would likely be in the cards.
We didn't have to wait long before the market did just that. We saw a tiny move above the 75 level (Friday's intraday high was 75.54) and then an invalidation thereof. The XAU Index closed the week at 74.33 and it closed at 73.32 yesterday. The decline seems to have just begun.
Before summarizing, let's take a look at the USD Index.
The USD Index Is About Done Bottoming
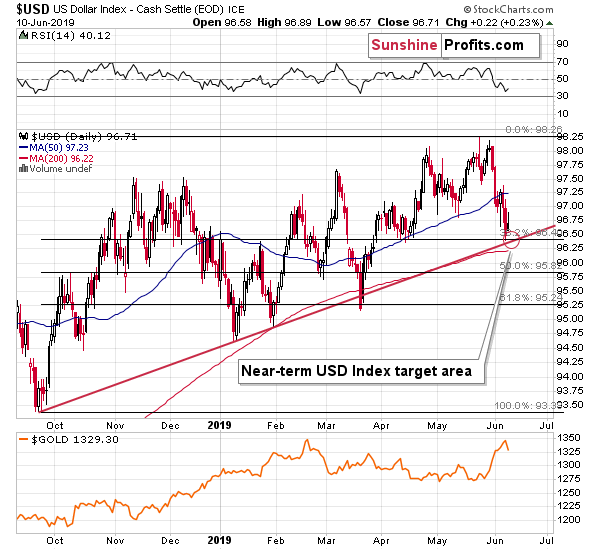
Let's start by quoting what we wrote about the above USD Index chart yesterday:
In Friday's intraday Alert, we wrote that situation on the USD Index chart is much better than it appeared at the first sight. The most bullish situation for a given market is when everything bad that could have happened... Has indeed happened. The USD Index has been bombarded by bearish news in the past 5 trading days, starting last Friday. And yet, the US currency is far from its yearly lows. In fact, it's more or less at its January highs, at its rising short-term support line. The USD index is holding up very well relative to everything that happened recently, and this strength is a bullish sign.
As you can see, the U.S. currency seems to have bottomed in the middle of our target area - at the moment of writing these words it's already up by 0.3 in today's pre-market trading. The implications for the precious metals market are very bearish.
Interestingly, the USD Index gave away some of the early gains and ended the session only 0.22 higher. This makes gold's, and - especially - silver's declines even more bearish, because it means that both metals were able to decline on such little help from the USDX. It's a bearish sign then only a tad of bearish influence results in visible downswings and that's exactly what we have right now in case of the USD-gold-silver link.
Summary
Summing up, it seems that we have just seen a major top in the precious metals market. We had a series of factors that were positive for the precious metals market and negative for the USD Index, but it seems that what could have happened based on them, has already happened. Based on the resistance levels that were reached, and relative performance of gold, silver, and mining stocks, we are very likely to see lower prices this week and in the weeks ahead. Gold and silver decline visibly yesterday, and they are down also in today's pre-market trading - it seems that we shorted the market right at the top.
As always, we'll keep you - our subscribers - informed.
To summarize:
Trading capital (supplementary part of the portfolio; our opinion): Full short position (250% of the full position) in gold, silver, and mining stocks is justified from the risk/reward perspective with the following stop-loss orders and exit profit-take price levels:
- Gold: profit-take exit price: $1,241; stop-loss: $1,382; initial target price for the DGLD ETN: $51.87; stop-loss for the DGLD ETN $38.67
- Silver: profit-take exit price: $13.81; stop-loss: $15.72; initial target price for the DSLV ETN: $39.38; stop-loss for the DSLV ETN $26.97
- Mining stocks (price levels for the GDX ETF): profit-take exit price: $17.61; stop-loss: $24.17; initial target price for the DUST ETF: $34.28; stop-loss for the DUST ETF $13.37
In case one wants to bet on junior mining stocks' prices (we do not suggest doing so - we think senior mining stocks are more predictable in the case of short-term trades - if one wants to do it anyway, we provide the details), here are the stop-loss details and target prices:
- GDXJ ETF: profit-take exit price: $24.71; stop-loss: $35.67
- JDST ETF: profit-take exit price: $78.21 stop-loss: $30.97
Long-term capital (core part of the portfolio; our opinion): No positions (in other words: cash)
Insurance capital (core part of the portfolio; our opinion): Full position
Whether you already subscribed or not, we encourage you to find out how to make the most of our alerts and read our replies to the most common alert-and-gold-trading-related-questions.
Please note that the in the trading section we describe the situation for the day that the alert is posted. In other words, it we are writing about a speculative position, it means that it is up-to-date on the day it was posted. We are also featuring the initial target prices, so that you can decide whether keeping a position on a given day is something that is in tune with your approach (some moves are too small for medium-term traders and some might appear too big for day-traders).
Plus, you might want to read why our stop-loss orders are usually relatively far from the current price.
Please note that a full position doesn't mean using all of the capital for a given trade. You will find details on our thoughts on gold portfolio structuring in the Key Insights section on our website.
As a reminder - "initial target price" means exactly that - an "initial" one, it's not a price level at which we suggest closing positions. If this becomes the case (like it did in the previous trade) we will refer to these levels as levels of exit orders (exactly as we've done previously). Stop-loss levels, however, are naturally not "initial", but something that, in our opinion, might be entered as an order.
Since it is impossible to synchronize target prices and stop-loss levels for all the ETFs and ETNs with the main markets that we provide these levels for (gold, silver and mining stocks - the GDX ETF), the stop-loss levels and target prices for other ETNs and ETF (among other: UGLD, DGLD, USLV, DSLV, NUGT, DUST, JNUG, JDST) are provided as supplementary, and not as "final". This means that if a stop-loss or a target level is reached for any of the "additional instruments" (DGLD for instance), but not for the "main instrument" (gold in this case), we will view positions in both gold and DGLD as still open and the stop-loss for DGLD would have to be moved lower. On the other hand, if gold moves to a stop-loss level but DGLD doesn't, then we will view both positions (in gold and DGLD) as closed. In other words, since it's not possible to be 100% certain that each related instrument moves to a given level when the underlying instrument does, we can't provide levels that would be binding. The levels that we do provide are our best estimate of the levels that will correspond to the levels in the underlying assets, but it will be the underlying assets that one will need to focus on regarding the signs pointing to closing a given position or keeping it open. We might adjust the levels in the "additional instruments" without adjusting the levels in the "main instruments", which will simply mean that we have improved our estimation of these levels, not that we changed our outlook on the markets. We are already working on a tool that would update these levels on a daily basis for the most popular ETFs, ETNs and individual mining stocks.
Our preferred ways to invest in and to trade gold along with the reasoning can be found in the how to buy gold section. Additionally, our preferred ETFs and ETNs can be found in our Gold & Silver ETF Ranking.
As a reminder, Gold & Silver Trading Alerts are posted before or on each trading day (we usually post them before the opening bell, but we don't promise doing that each day). If there's anything urgent, we will send you an additional small alert before posting the main one.
=====
Latest Free Trading Alerts:
On Friday, it was announced that the U.S. added merely 75,000 jobs in May. Needless to say, a severe disappointment on the downside. The talk of an oncoming recession, and the interest rate cut speculations - were boosted. Is it justified? How close are we actually to the end of the business cycle? Should we buy gold now?
May Payrolls Disappoint. Fed to the Rescue? And Gold?
=====
Thank you.
Sincerely,
Przemyslaw Radomski, CFA
Editor-in-chief, Gold & Silver Fund Manager

