

Briefly: in our opinion, full (250% of the regular size of the position) speculative short position in gold, silver, and mining stocks are justified from the risk/reward perspective at the moment of publishing this Alert.
What a week! Gold rallied $35 and broke to s new 2019 high and it all happened on weekly volume higher than any other we have seen so far this year. This record has profound implications that will most likely be felt for many weeks to come. You see, this kind of strong volume action took place only several times in the past two decades and it was always followed by the very same thing.
By huge declines.
Analyzing Gold's Volume Spikes
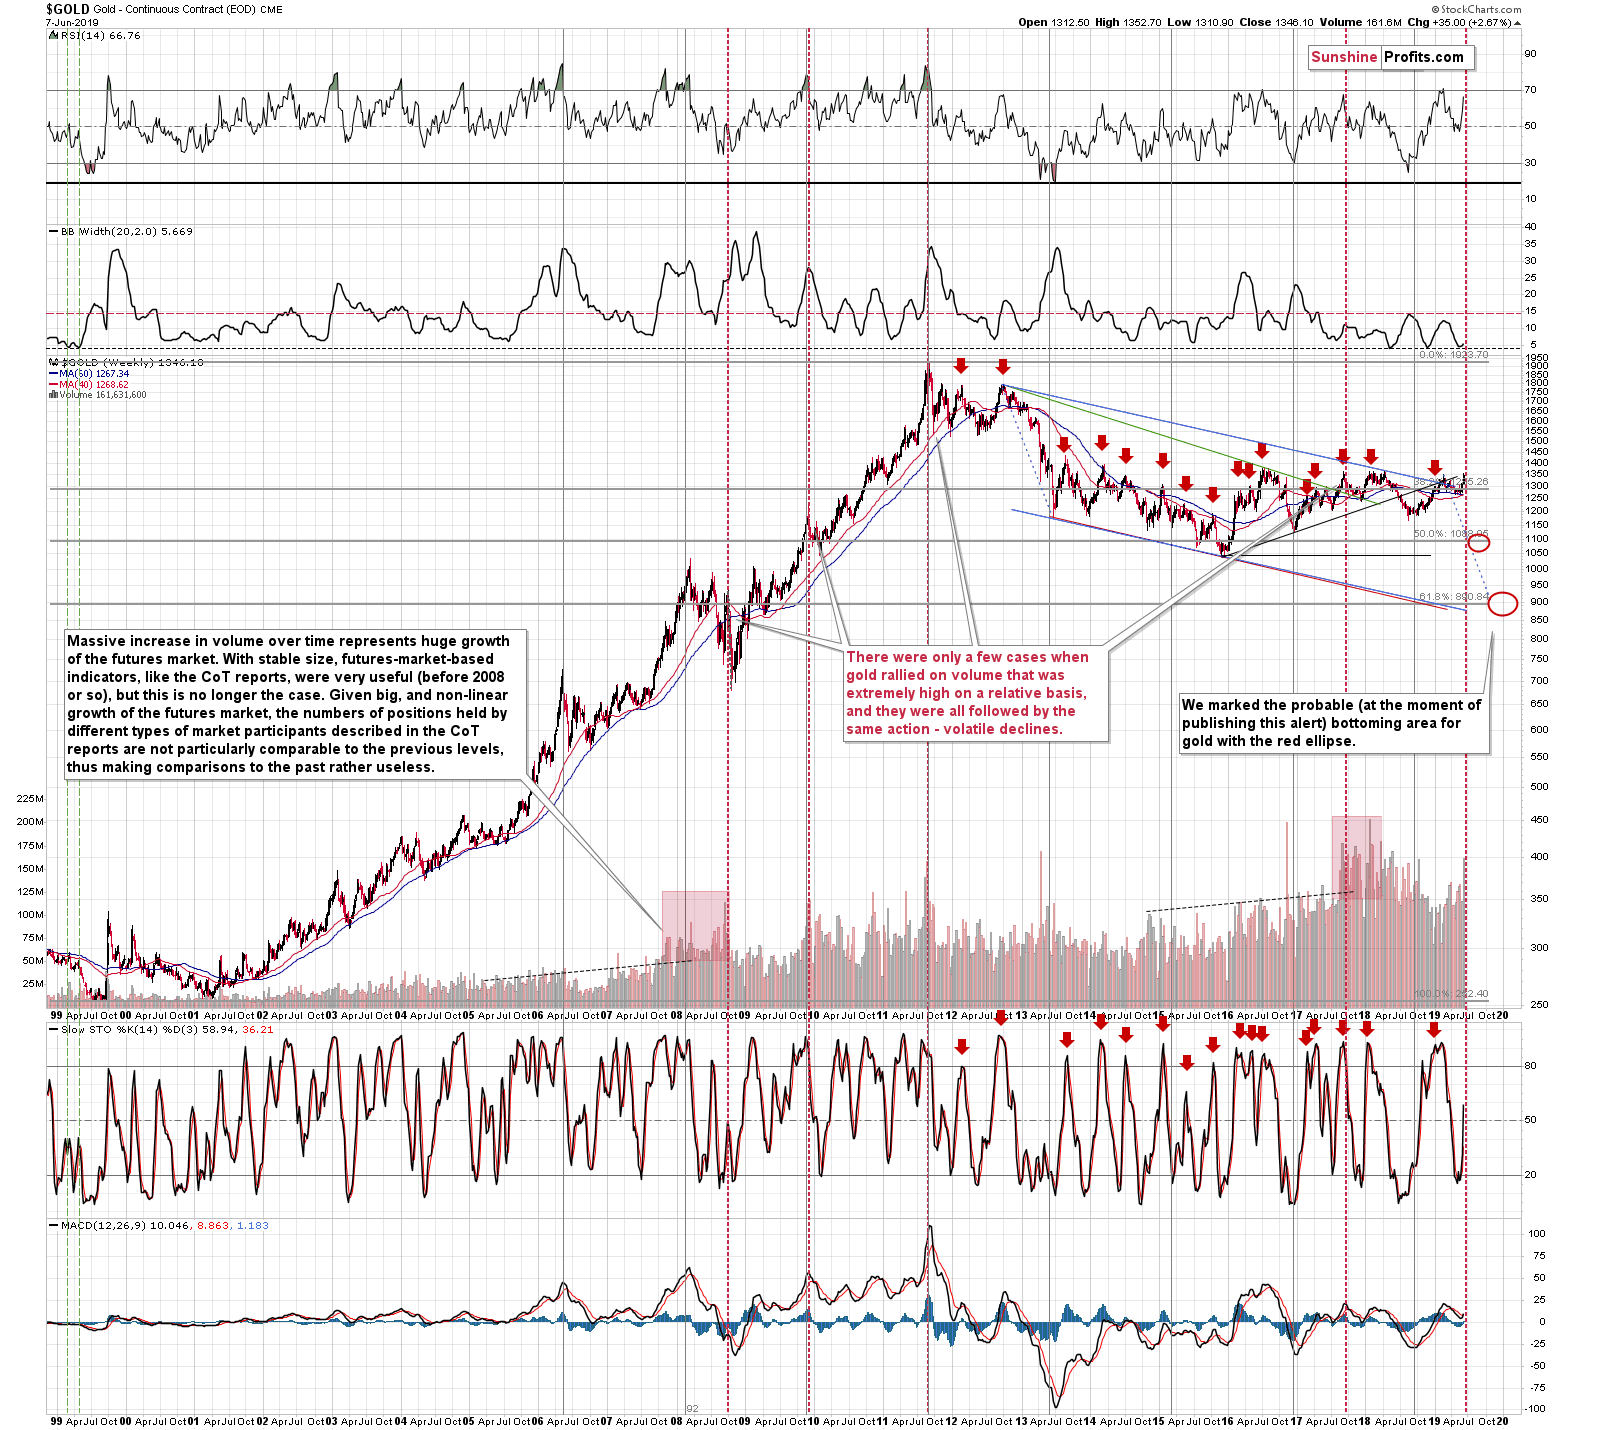
It is rare when gold rallies on extremely huge volume during the week and it is extremely rare when this happens after weeks during which the volume was relatively low. The relativity requirement is more important than it appears at the first sight. The futures market grows in general and the volume increases - this is the case in most futures markets, not only in case of gold futures that the above chart represents. So, by looking at absolute volume levels only, we would not know if what we see is really an anomaly or a normal consequence of the above-mentioned trend. This process is rather gradual, so if we see rapid increases in volume, not slow ones, it suggests that something extraordinary has happened. That's what makes volume spikes so important.
The volume spikes represent different situations when we see them during gold's declines and when we see them during gold's rallies. It's rather obvious why it's best to compare apples to apples, so it's no surprise that in order to check what happened in cases that are similar to the current ones, it's best to focus on the huge-volume weekly rallies.
We marked these similar cases with red vertical lines. There were four cases that were very similar when looking at gold from the broad perspective. There was one more in the more recent past that is clearer once we zoom in. The four above-mentioned cases are:
- the late 2008 top that was almost immediately followed by a huge decline
- the late 2009 top that was followed by a notable decline that took a few months
- the 2011 top - no comment is necessary here
- the mid-2017 top - one of the most important tops of the recent years that was followed by several-month-long decline
Since all similar cases point to the same outcome, the implications are obvious. History tends to rhyme, so gold is likely to slide in the following months, not to mention weeks.
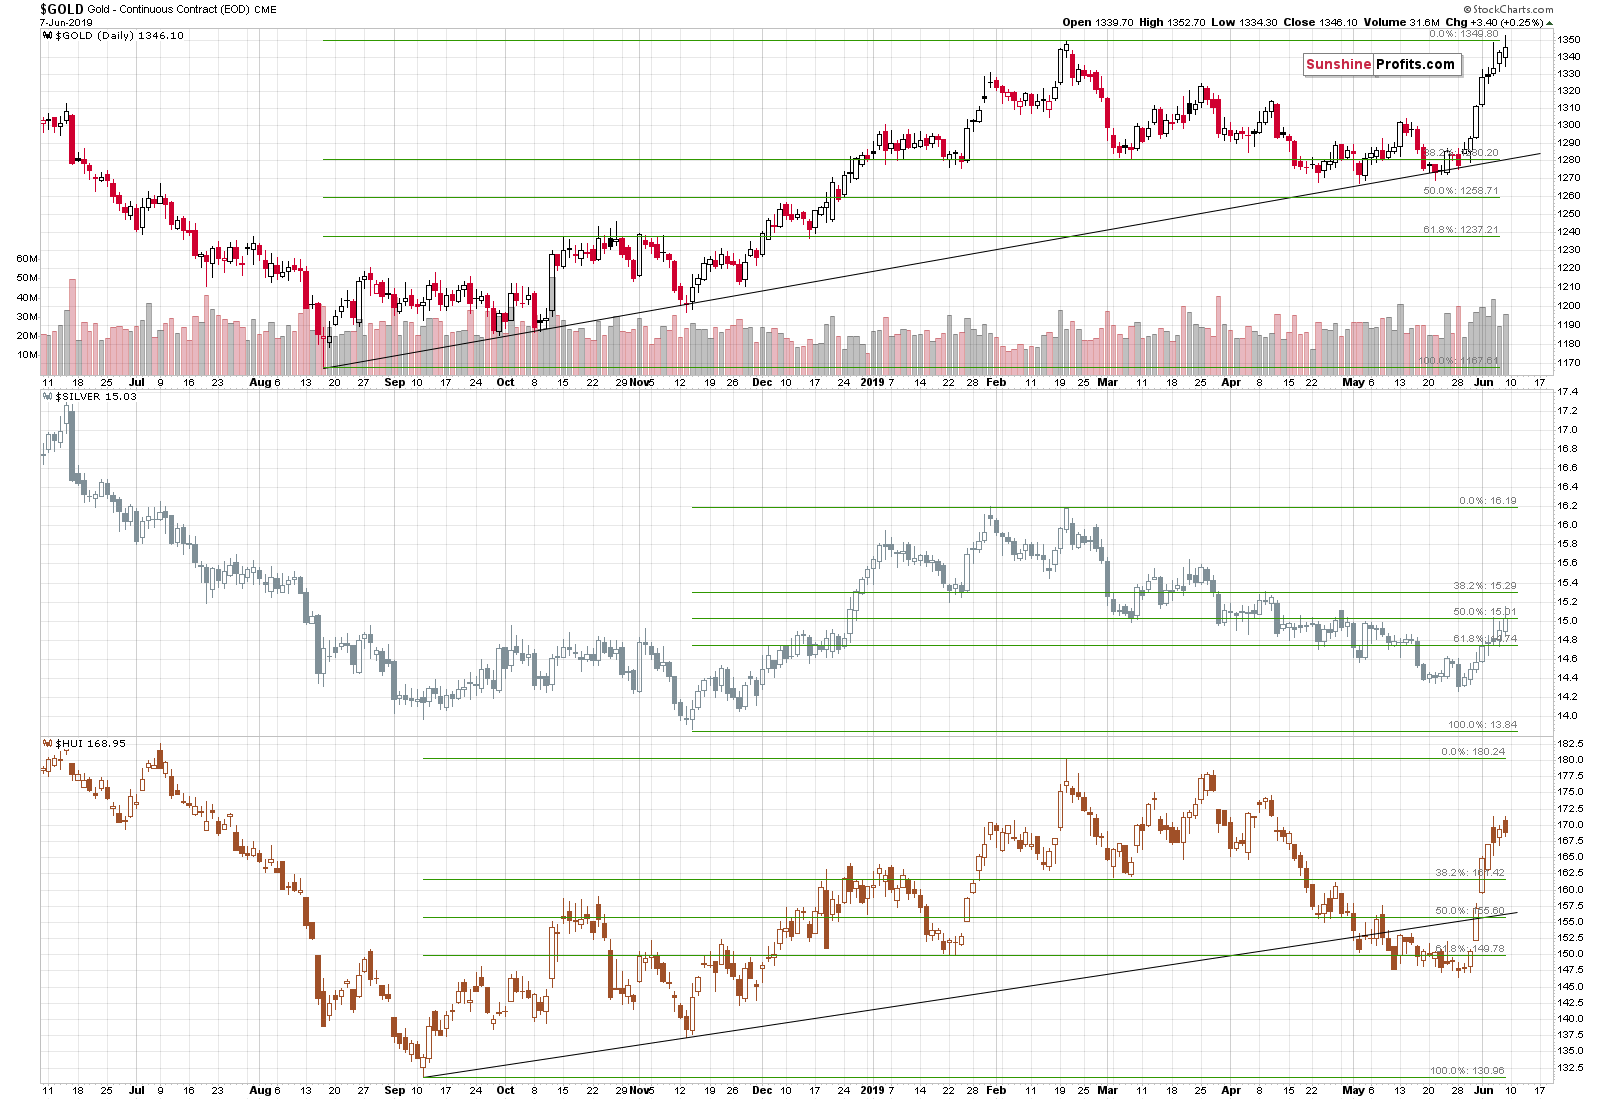
Speaking of weekly declines, let's zoom in a bit, and quote what we previously wrote about the chart below:
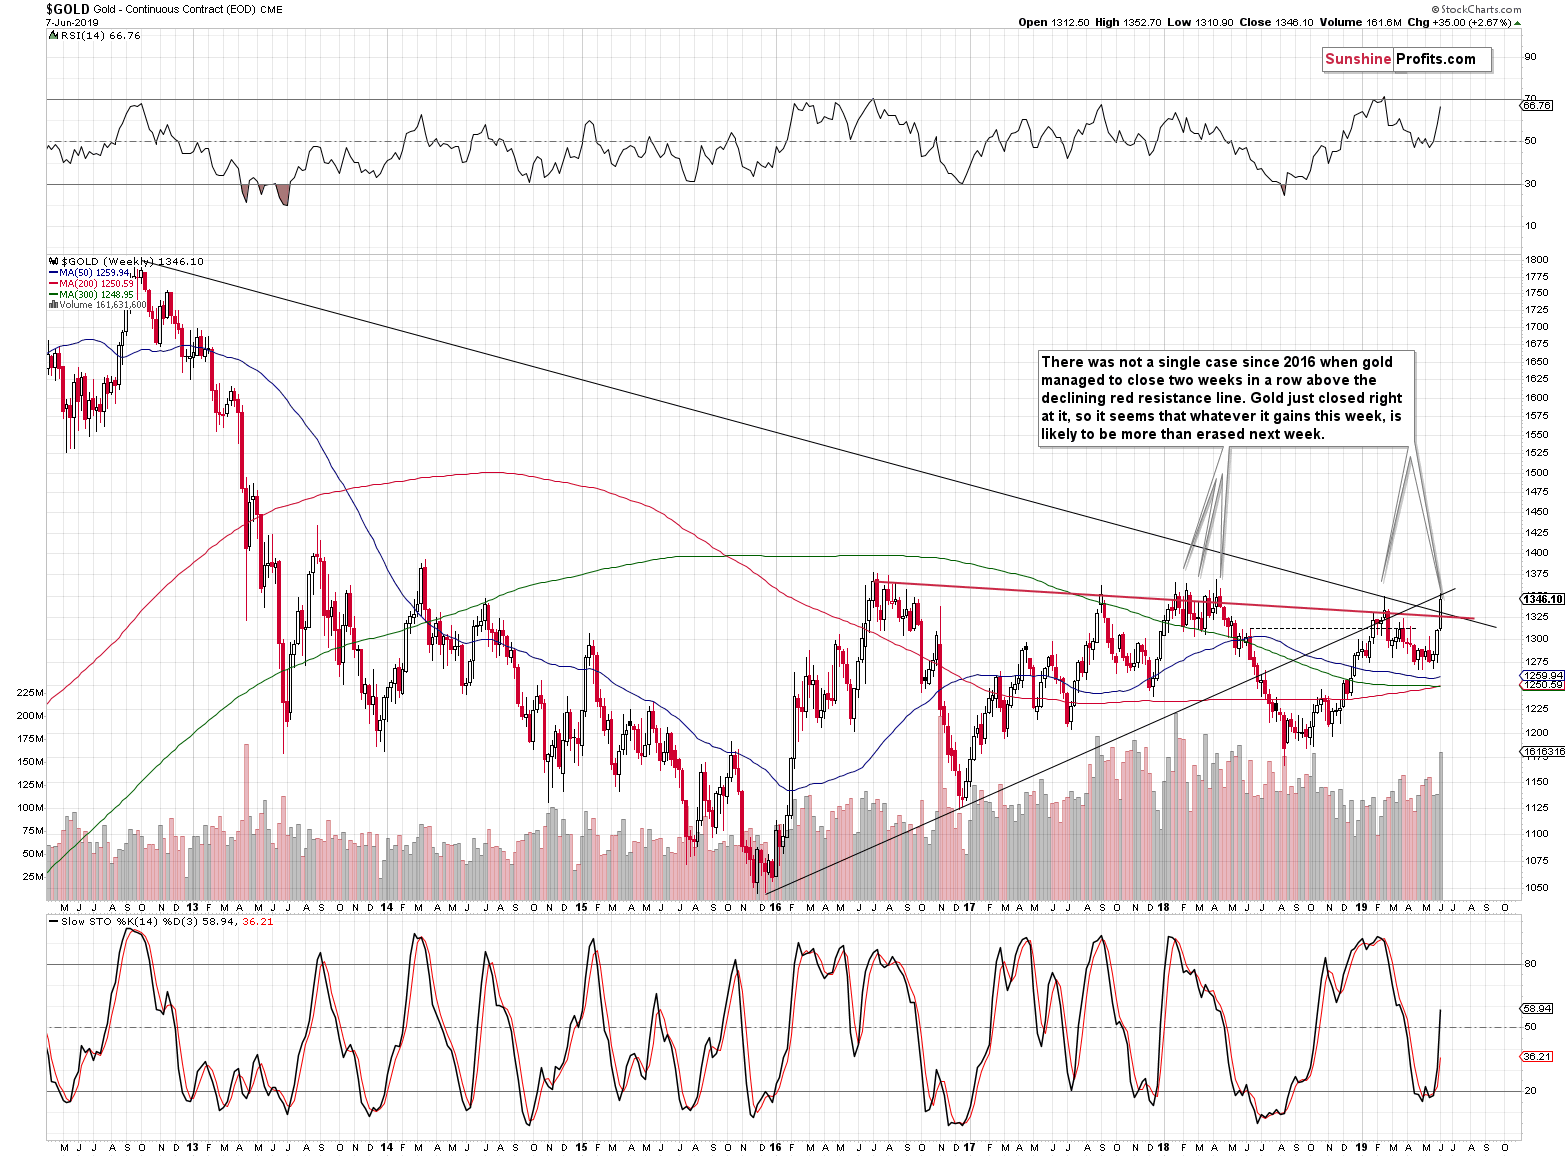
Gold is approaching its long-term resistance created by the previous highs. There is one very interesting rule regarding this resistance. No matter how volatile or promising the rally above the red resistance line was, it was always (in the last couple of years) invalidated in the following week. Given today's pre-market rally in gold, it seems that we might see a weekly close above it. This means that the next week would quite likely include the invalidation of the current breakout and the beginning of another slide lower.
The above remains up-to-date. Since the previous week has indeed resulted in gold's close above the declining red resistance line, we are now likely to see breakout invalidation.
Just a few paragraphs above, we wrote about another huge-volume spike that would be visible on the next chart. It's the January 2018 spike. The volume is higher than the mid-2017 spike, but overall the former seems more significant on a relative basis. Anyway, the January 2018 spike... Resulted in declines anyway. Not right away, but this was the end of the rally, so the bearish implications thereof remain intact.
While looking at gold's performance in the long run, it's good to compare it with the long-term performance of gold miners. After all, the major rallies in the entire precious metals sector should be accompanied by miners' strength - not only local strength, but something apparent from the bigger perspective. And what do we see?
Where Is Miners' Outperformance?
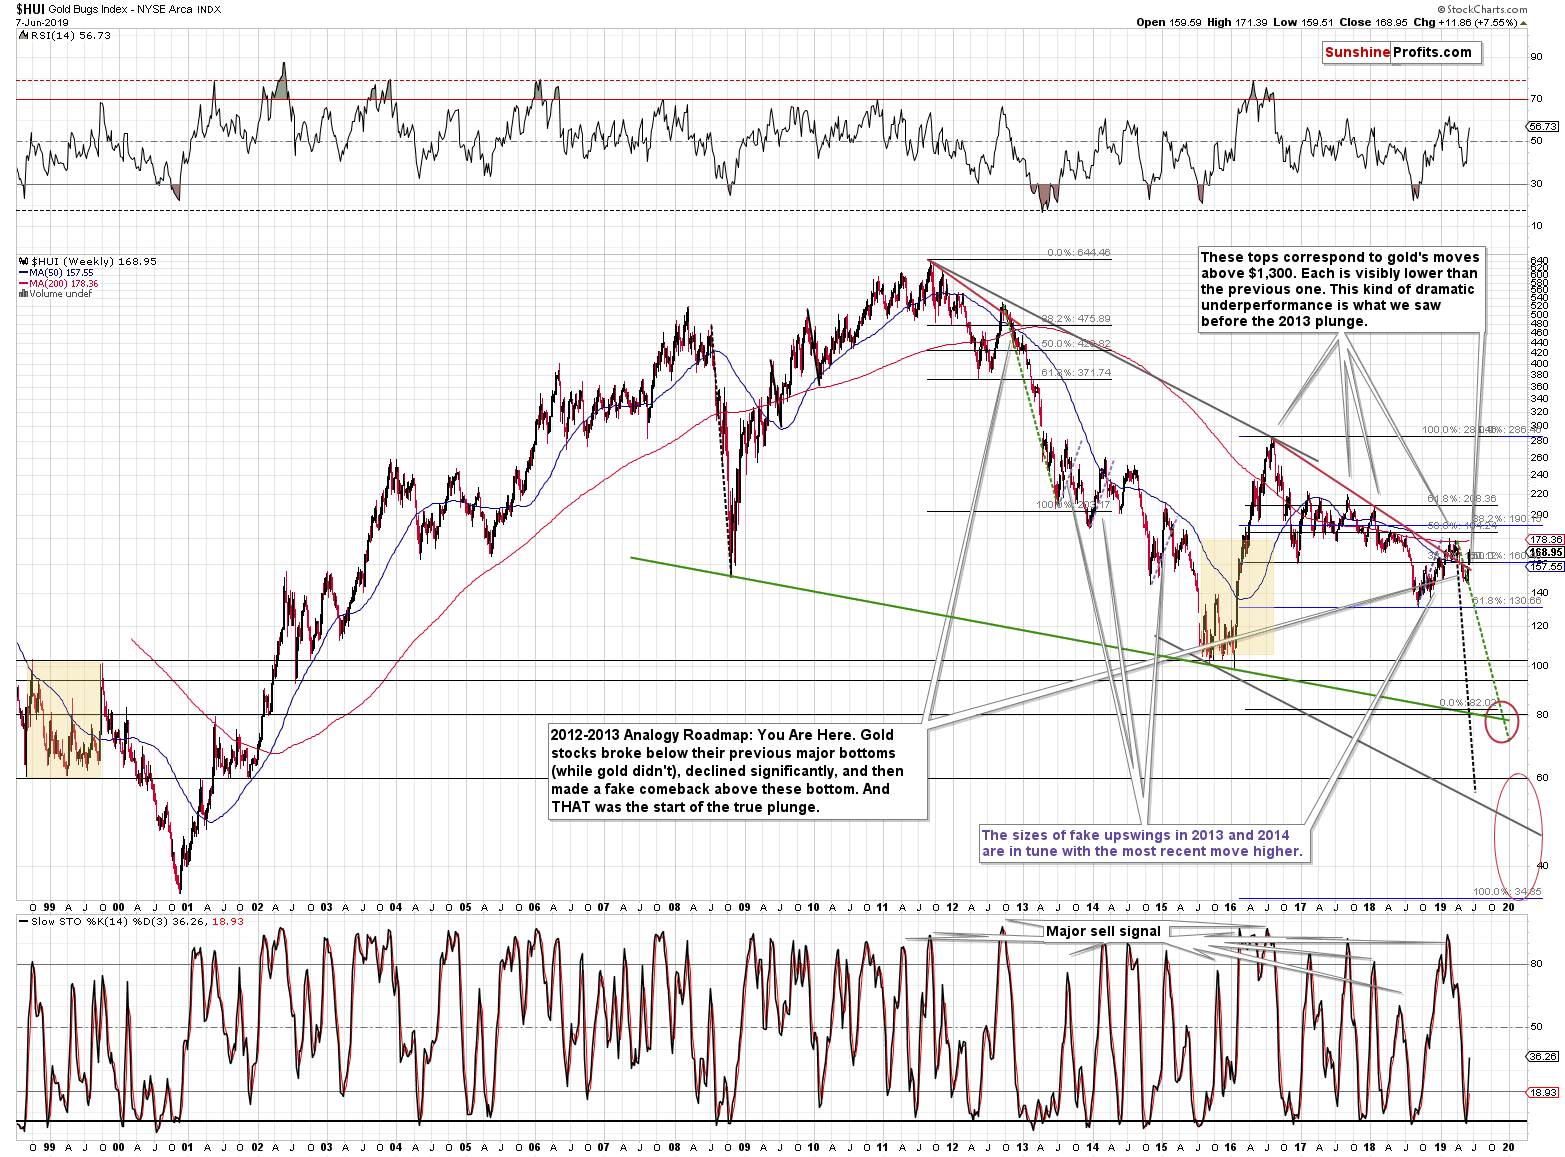
Well, we see that there was a correction in 2016 after the massive decline and that gold miners have been declining ever since. Gold miners are almost as low as they were in 2008 when the entire PM sector bottomed (gold was trading at about $700 back then). Or as high as when they were in mid-2002, when gold was below $350 - about $1,000 lower than where it closed on Friday.
Despite the very recent rally, the situation in the mining stocks remains very bearish - they simply lack long-term strength, and this suggests that the entire precious metals sector has not yet bottomed.
While we're at the mining stocks' long-term picture, let's take a look at another long-term chart - the one of the XAU Index.
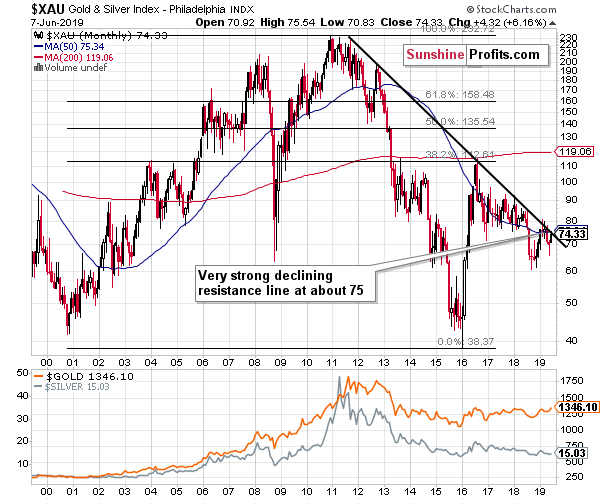
On Friday, we wrote the following:
The very long-term and very strong (based on multiple important tops) declining resistance line is at about 75. The XAU Index just closed at 74.41. While a temporary move above this line is quite possible - after all, it happened earlier this year - a big move above it is very unlikely. Invalidation of the small breakout would be much more likely, and another powerful slide would likely be in the cards.
We didn't have to wait long before the market did just that. We saw a tiny move above the 75 level (Friday's intraday high was 75.54) and then an invalidation thereof. The XAU Index closed the week at 74.33. The implications are bearish.
Something interesting took place in the underlying precious metals as well.
Digging Deeper into the Recent PMs Rally
Quoting our June 5 comments:
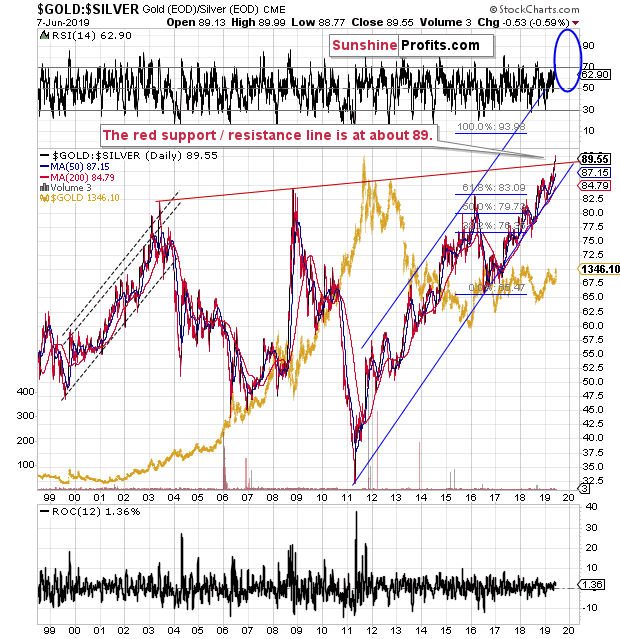
The performance of the gold to silver ratio - its relentless rally - suggests that the medium-term remains intact. The metals are moving lower in the next several months. But, since we saw two breakouts - above the previous long-term highs, and above the rising red resistance line - we could see some kind of corrective action in the short term.
This action could easily translate into temporary silver outperformance that would confirm the end of the rally.
It's not something that's likely to change the medium-term outlook, though.
That's exactly what happened. The rising red support/resistance line is at about 89. Friday's intraday low in the ratio was 88.77 and it closed the week at 89.55 This line was touched only on a very temporary basis, but still, it happened. This means that the breakout was already verified and while an additional move to the 89 level is not impossible, it's now less likely. In other words, the rally in the ratio may now continue and the same goes for the decline in the precious metals market. After all, the really big moves in the precious metals sector are usually accompanied by the opposite moves in the gold to silver ratio. The 2008 slide and the 2011 rally serve as examples.
The pullback in the ratio has translated into silver's quick outperformance of gold just as we described it on Friday. This is a classic confirmation that the rally is ending. And it's not only silver's movement relative to gold's price action that suggests it. It's quite clear even based on the shape of Friday's session. It's clearer when we look at silver through its proxy - the SLV ETF. Let's take a look below for details.
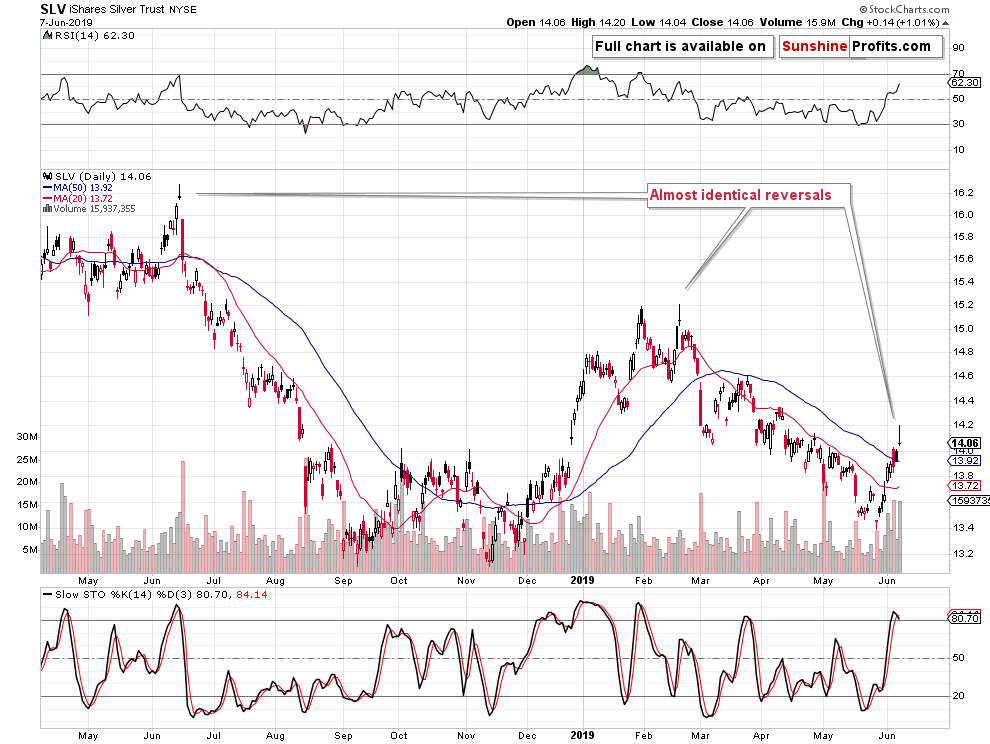
Friday's session took a very specific shape. It was a reversal candlestick pattern known as the gravestone doji. There were two cases in the recent past when we saw practically identical move after a very similar preceding rally. It was in the second half of February 2019 and it was almost exactly a year ago - in June 2018. In both cases, shortly after silver reversed in the aforementioned way, it erased the entire preceding rally and then declined much move. The implications here are very bearish.
And when while we are talking about the intraday movement, let's consider how gold, silver, and mining stocks moved relative to each other.
Gold moved above the previous high but failed to close the week above them. The small attempt to move higher was invalidated before the end of the day. Silver's intraday rally was even more profound than the one of gold, which means that for a while, silver was outperforming. And the miners? They erased their entire intraday rally and closed the day lower. They underperformed.
Even though it may not seem significant, especially for those, who have just started to investigate the precious metals market, this is exactly what tends to happen right at the top or very close to it: miners refuse to follow gold's lead higher, while silver catches up.
Before summarizing, let's take a look at the USD Index.
The USD Index Is About Done Bottoming
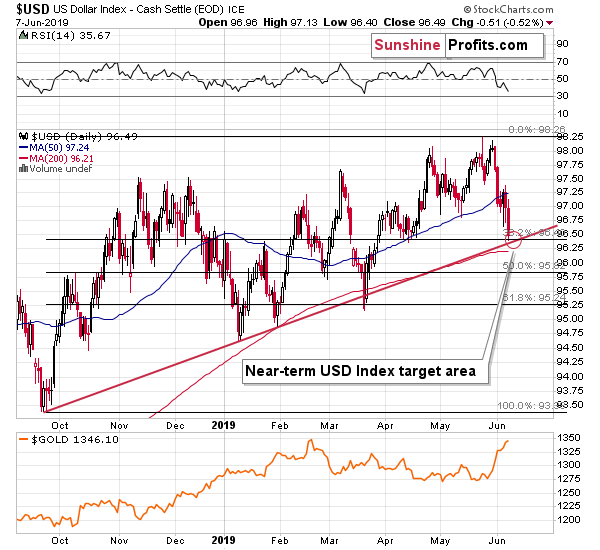
In Friday's intraday Alert, we wrote that situation on the USD Index chart is much better than it appeared at the first sight. The most bullish situation for a given market is when everything bad that could have happened... Has indeed happened. The USD Index has been bombarded by bearish news in the past 5 trading days, starting last Friday. And yet, the US currency is far from its yearly lows. In fact, it's more or less at its January highs, at its rising short-term support line. The USD index is holding up very well relative to everything that happened recently, and this strength is a bullish sign.
As you can see, the U.S. currency seems to have bottomed in the middle of our target area - at the moment of writing these words it's already up by 0.3 in today's pre-market trading. The implications for the precious metals market are very bearish.
Summary
Summing up, it seems that we have just seen a major top in the precious metals market. We had series of factors that were positive for the precious metals market and negative for the USD Index, but it seems that what could have happened based on them, has already happened. Based on the resistance levels that were reached, and relative performance of gold, silver, and mining stocks, we are very likely to see lower prices this week and in the weeks ahead. Given how gold performed after previously rallying to the current levels, it seems that the entire recent rally will be erased this week.
In today's trading so far, gold is down by about $15 and silver is down by about $0.30 at the moment of writing these words - it seems that we shorted the market right at the top.
As always, we'll keep you - our subscribers - informed.
To summarize:
Trading capital (supplementary part of the portfolio; our opinion): Full short position (250% of the full position) in gold, silver, and mining stocks is justified from the risk/reward perspective with the following stop-loss orders and exit profit-take price levels:
- Gold: profit-take exit price: $1,241; stop-loss: $1,382; initial target price for the DGLD ETN: $51.87; stop-loss for the DGLD ETN $38.67
- Silver: profit-take exit price: $13.81; stop-loss: $15.72; initial target price for the DSLV ETN: $39.38; stop-loss for the DSLV ETN $26.97
- Mining stocks (price levels for the GDX ETF): profit-take exit price: $17.61; stop-loss: $24.17; initial target price for the DUST ETF: $34.28; stop-loss for the DUST ETF $13.37
In case one wants to bet on junior mining stocks' prices (we do not suggest doing so - we think senior mining stocks are more predictable in the case of short-term trades - if one wants to do it anyway, we provide the details), here are the stop-loss details and target prices:
- GDXJ ETF: profit-take exit price: $24.71; stop-loss: $35.67
- JDST ETF: profit-take exit price: $78.21 stop-loss: $30.97
Long-term capital (core part of the portfolio; our opinion): No positions (in other words: cash)
Insurance capital (core part of the portfolio; our opinion): Full position
Whether you already subscribed or not, we encourage you to find out how to make the most of our alerts and read our replies to the most common alert-and-gold-trading-related-questions.
Please note that the in the trading section we describe the situation for the day that the alert is posted. In other words, it we are writing about a speculative position, it means that it is up-to-date on the day it was posted. We are also featuring the initial target prices, so that you can decide whether keeping a position on a given day is something that is in tune with your approach (some moves are too small for medium-term traders and some might appear too big for day-traders).
Plus, you might want to read why our stop-loss orders are usually relatively far from the current price.
Please note that a full position doesn't mean using all of the capital for a given trade. You will find details on our thoughts on gold portfolio structuring in the Key Insights section on our website.
As a reminder - "initial target price" means exactly that - an "initial" one, it's not a price level at which we suggest closing positions. If this becomes the case (like it did in the previous trade) we will refer to these levels as levels of exit orders (exactly as we've done previously). Stop-loss levels, however, are naturally not "initial", but something that, in our opinion, might be entered as an order.
Since it is impossible to synchronize target prices and stop-loss levels for all the ETFs and ETNs with the main markets that we provide these levels for (gold, silver and mining stocks - the GDX ETF), the stop-loss levels and target prices for other ETNs and ETF (among other: UGLD, DGLD, USLV, DSLV, NUGT, DUST, JNUG, JDST) are provided as supplementary, and not as "final". This means that if a stop-loss or a target level is reached for any of the "additional instruments" (DGLD for instance), but not for the "main instrument" (gold in this case), we will view positions in both gold and DGLD as still open and the stop-loss for DGLD would have to be moved lower. On the other hand, if gold moves to a stop-loss level but DGLD doesn't, then we will view both positions (in gold and DGLD) as closed. In other words, since it's not possible to be 100% certain that each related instrument moves to a given level when the underlying instrument does, we can't provide levels that would be binding. The levels that we do provide are our best estimate of the levels that will correspond to the levels in the underlying assets, but it will be the underlying assets that one will need to focus on regarding the signs pointing to closing a given position or keeping it open. We might adjust the levels in the "additional instruments" without adjusting the levels in the "main instruments", which will simply mean that we have improved our estimation of these levels, not that we changed our outlook on the markets. We are already working on a tool that would update these levels on a daily basis for the most popular ETFs, ETNs and individual mining stocks.
Our preferred ways to invest in and to trade gold along with the reasoning can be found in the how to buy gold section. Additionally, our preferred ETFs and ETNs can be found in our Gold & Silver ETF Ranking.
As a reminder, Gold & Silver Trading Alerts are posted before or on each trading day (we usually post them before the opening bell, but we don't promise doing that each day). If there's anything urgent, we will send you an additional small alert before posting the main one.
Thank you.
Sincerely,
Przemyslaw Radomski, CFA
Editor-in-chief, Gold & Silver Fund Manager

