

Briefly: in our opinion, full speculative long positions (150% of the regular position size) in mining stocks are justified from the risk/reward point of view at the moment of publishing this Alert. In our view, no positions in gold or silver are currently justified from the risk to reward point of view. We expect to change our position soon (very likely this week).
In yesterday's analysis, we wrote that a reversal was likely just around the corner, and we went into greater detail when covering silver.
Today, we will update yesterday's analysis and tell you about more (in fact "just-in") signs that the market is about to correct.
Which market is about to correct? Probably all, or most of them.
Let's start with reminding what we wrote yesterday about silver's similarity to what happened in 2008. In fact, we will quote it almost entirely, because practically everything is relevant in the following part of today's discussion.
Silver Now and in 2008
How did silver perform then in 2008?
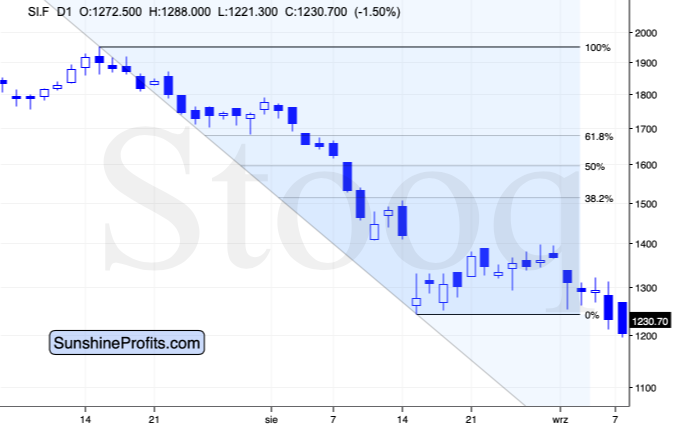
It corrected to the nearest strong horizontal resistance level and the relatively round number of $14. It was about midway between the bottom and the 38.2% Fibonacci retracement. There was a second bottom after the initial one, two days later.
How about the current situation?
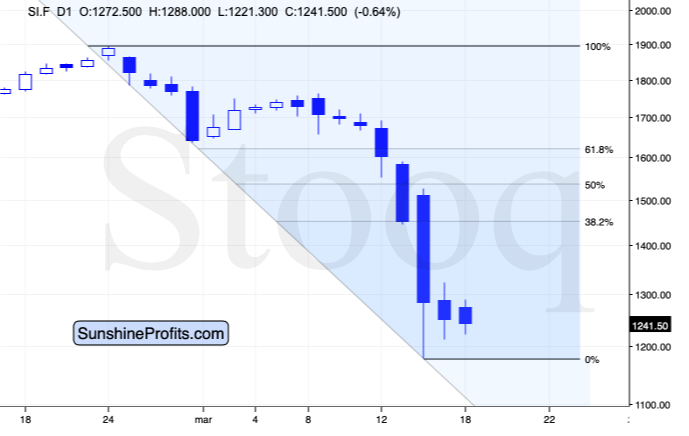
Silver moved lower today, and while it didn't move between yesterday's and Monday's intraday low, it's already very close. It will take silver only about 35 cents more to decline below yesterday's low and to make this rebound extremely similar to what happened in 2008. Then again, that's just a cherry on the analytical cake, and the analogy to 2008 will remain intact even if the shape of today's session is a bit different.
Silver is now a bit lower than it was in 2008 in nominal terms, so the midpoint between the recent low and the 38.2% Fibonacci retracement is below the $14 level. Is there any significant horizontal resistance located over there? Of course, there is!
It's the 2015 bottom - it formed at $13.62. This target is aligned with the mid-point between the recent low and the 38.2% Fibonacci retracement.
And the analogy to 2012-2013? Please note at what pace silver declined from the very first top (blue line). During the first very volatile slide, it corrected only after it reached the declining blue line. Guess what? Copying the same line to the recent final top (the 2019 one) provides us with a line that was just reached recently. This suggests that silver is about to rebound before moving again.
How high did silver rally during the analogous correction in 2013? It moved up by about 12.7%. Applying this kind of rally to the recent low in silver provides us with $11.77 * 1.127 = $13.26 as the target for the next local bottom. Of course, this analogy is not as precise as the 2008 one, so it can be used as its confirmation - this target is very close to the 2015 low.
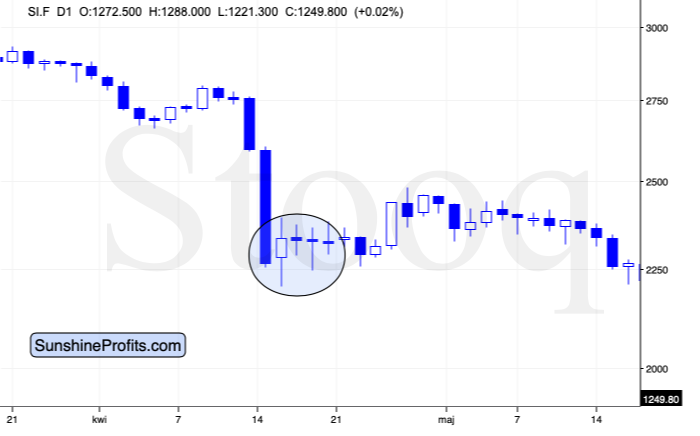
One more note regarding the 2013 corrective upswing. Please note that two days after the initial bottom, silver formed another local low and then rallied in the following days. That's exactly the same way silver bottomed (temporarily) in 2008.
Today is the day that's two days after the initial bottom, so if silver moves temporarily lower today, please keep in mind that it's normal, and it doesn't invalidate the scenario in which silver now corrects higher.
This could be what's likely ahead for the stock market and other commodities as well. The S&P 500 futures are lower so far today, but this might be the final move lower before their corrective rally. Crude oil moved lower as well and it might be bottoming shortly (we just cashed in profits on our short position in crude oil about an hour ago). In tune with the above, mining stocks could decline early today, only to move back up later and/or in the following days - we are not exiting our long positions in the miners at this time.
In fact, the best risk to reward opportunity continues to be in the mining stocks in our view, even though silver is about to correct upwards.
It is often the case that silver outperforms mining stocks in the final part of a given rally, but after examining how corrective upswings were shaped in different parts of the PM market during the 2008, 2011, and 2013 declines, it seems that this rule doesn't really apply in case of quick rebounds within bigger declines.
If we see signs that miners are underperforming gold and that silver would still have some sizable upside potential, we might switch our long positions from miners to silver. It's too early to say if we're going to do it or not.
Also, we would like to take this opportunity to explain why we are aiming to profit on miners' rebound only. It's not because we're not forecasting gold or silver at (temporarily) higher prices. The corrective upswing is likely to take place, and it seems that it's already in progress. The point is that miners are usually the first to rally after a bottom, and they became ridiculously oversold in the short run recently, which made their run-up most likely and created the most favorable risk to reward setup. That's why our focus is over here right now. There will be many times, when diversification between gold, silver, and miners is the way to go, but right now, concentrating on the miners seems to be a better choice. This choice proved to be very lucrative over the last few days (especially that we entered the long positions in the miners in the final 25 minutes of Friday's session, almost right at the intraday low).
Now, silver moved a bit below its initial bottom before reversing higher. As we explained yesterday, it's not a big deal as a 100% perfect alignment with 2008 in intraday terms was only a cherry on the analytical cake. The important fact is this:
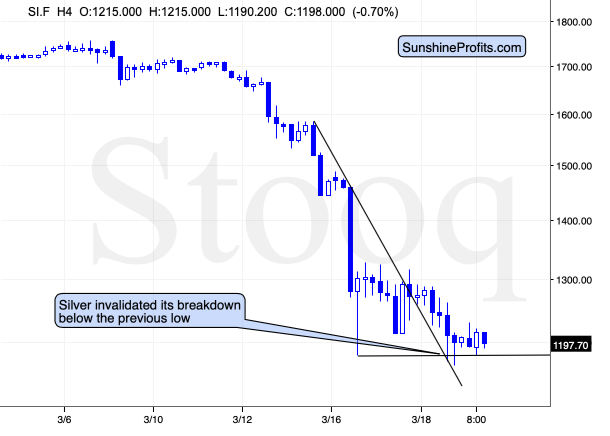
Silver invalidated the breakout, reversing in a relatively clear manner. And it managed to do so despite the intraday decline in the stock market, and soaring USD Index. This relative strength is very important, because that's what tells us that the market doesn't really want to move in a given direction (down) before an earlier move in the opposite direction (up) for at least some time.
The invalidation of the breakdown itself is a bullish sign, and the same goes for the breakout above the declining resistance line. In fact, the breakdown below the previous March low was a verification of the breakout above that resistance line.
Based on the above chart, silver is ripe for a corrective upswing - likely to about $13.50 or so.
It's not only silver that reversed and invalidated its breakdown.
Breakdown Invalidation in Stocks
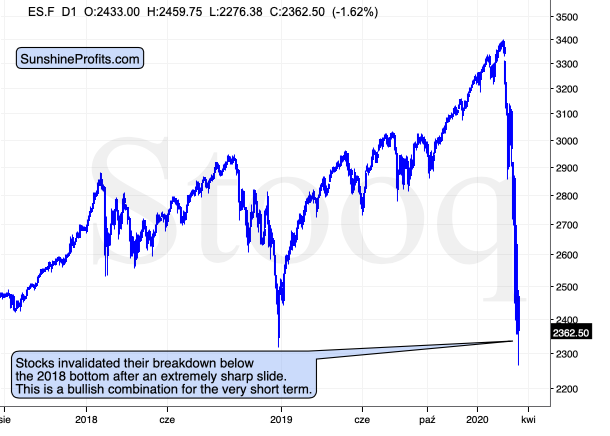
The same thing happened in the stock market. The above chart features the S&P 500 futures and it's clear that yesterday's attempt to break below the 2018 low, was unsuccessful. If bulls were strong enough to push the price up despite the breakdown below such an important support, then they are very likely strong enough to generate at least a small corrective upswing.
The shape of yesterday's candlestick along with big volume on which it formed, also suggest that a very short-term rally here is very likely.
And what about the USD Index? It's been rallying relentlessly in the last couple of days. It's not surprising, because you knew based on our previous analyses, that the long-term outlook for the USDX was very bullish. But can this vertical climb really continue without any corrections?
That's not likely.
The USDX in Perspective
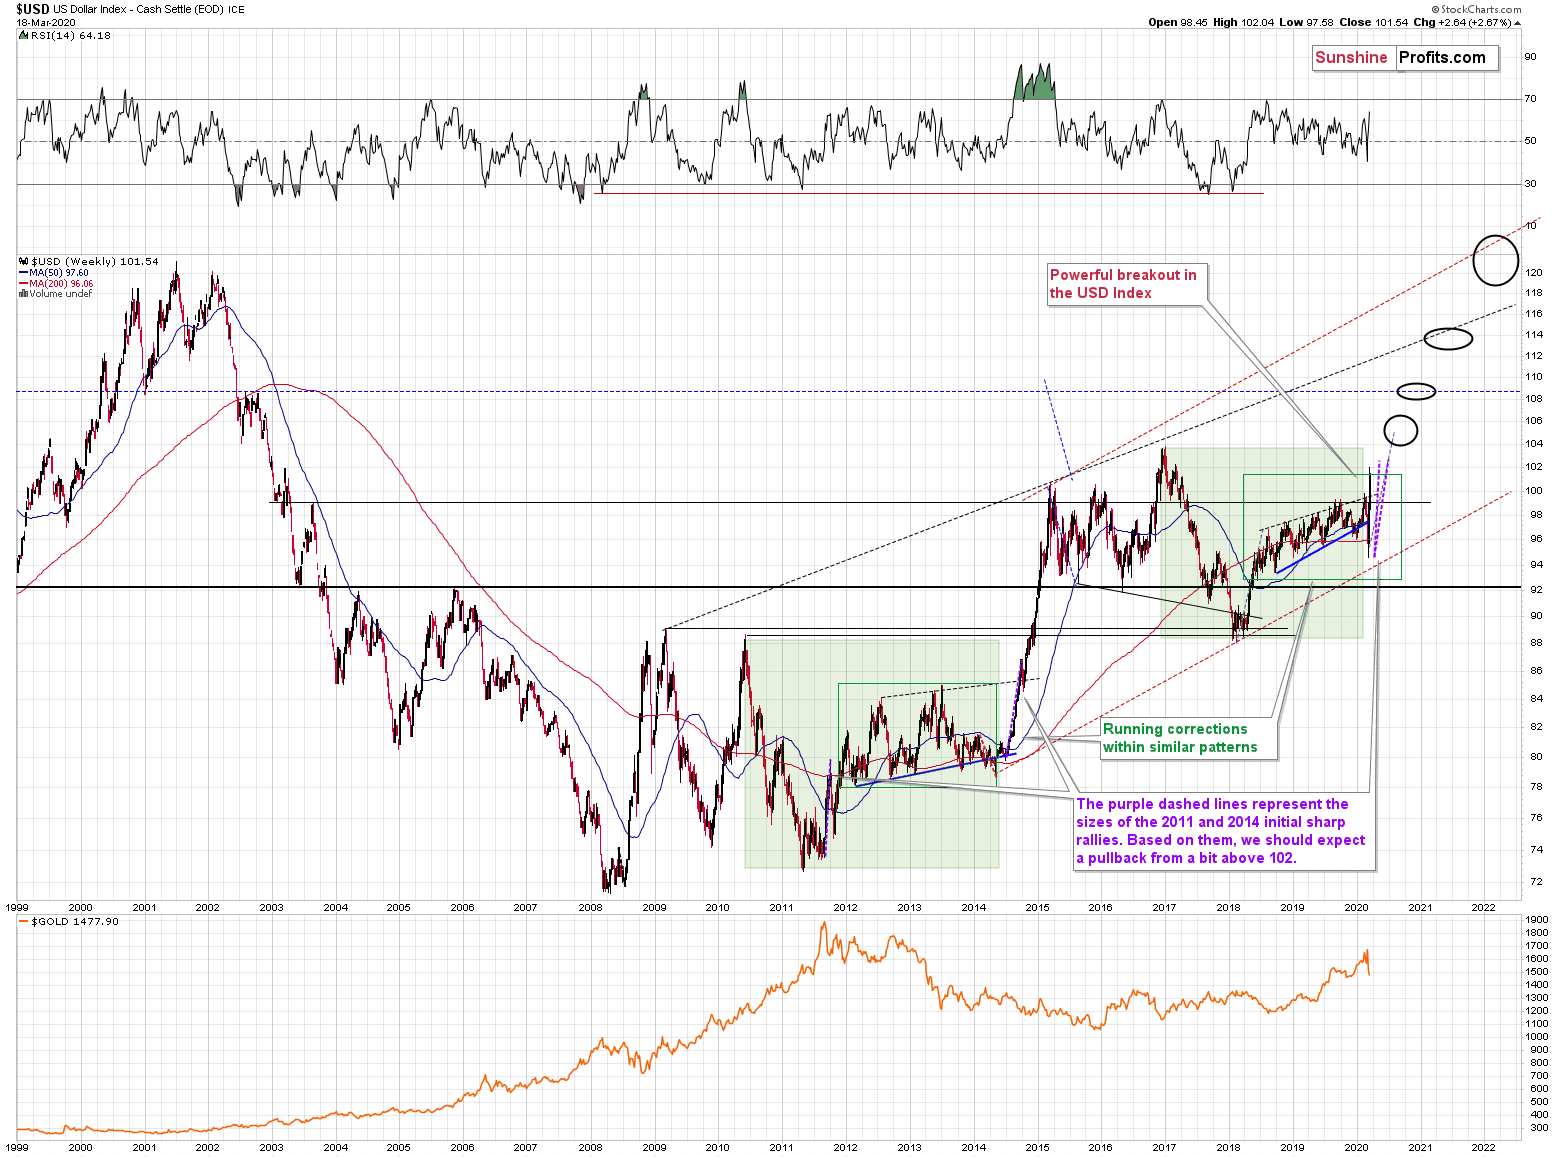
The most similar situation to what we see right now (at least from the USDX perspective) is what happened in 2014. We've been writing about this similarity for months and we marked the analogous multi-year cases with green rectangles. This analogy was particularly useful during the recent breakdown below the rising blue support line. It looked scary from the bulls' point of view, but the same thing happened in 2014, so it was a relatively normal course of action that actually heralded a huge rally.
This rally is now underway. Yet, just because it is underway, it doesn't mean that it will continue without any corrections. Conversely, based on the very same analogy, it seems that a correction is due... Right now.
We marked the first part of the huge 2014 rally in the USD Index with purple dashed line, and we copied it to the current situation. We also did the same thing with the 2011 rally as it was similarly sharp. Interestingly, in both cases, the USDX rallied by almost the same amount (percentagewise). If the size of the initial rally is similar also this time, we can expect the USD Index to top... Above the 102 level and relatively close to 103. And where did the USD Index move earlier today?
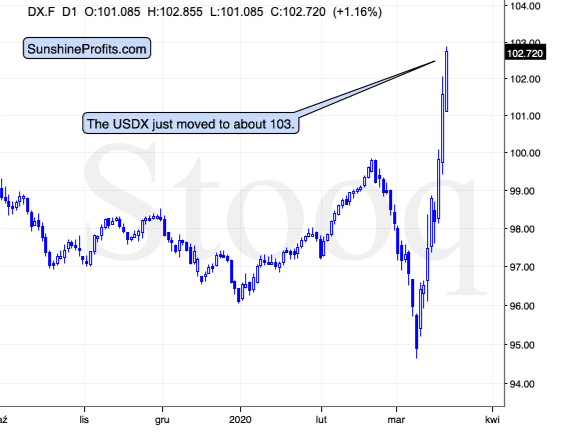
It just moved to about 103. If the history is to repeat itself, as it so often does, then the USD Index is likely to correct. Back in 2014, the USD Index declined back to the previously broken highs, so this time, the situation could be similar. The most recently broken high is just below the 100 level, so that's where we would expect the USDX to bottom before soaring once again.
Crude oil also invalidated its breakdown below its declining support line based on the 2009 and 2016 bottoms.
Gold and the Miners in Focus
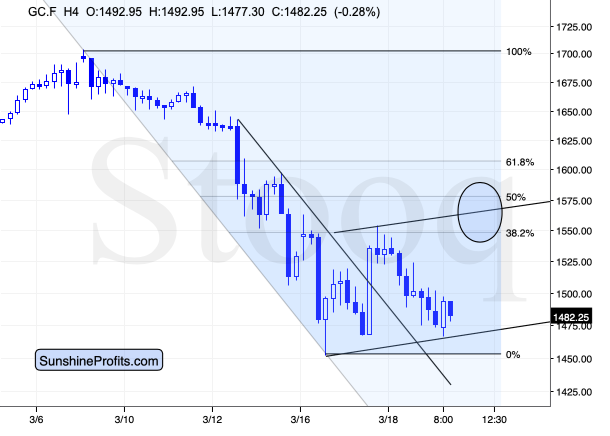
Gold didn't make a new low despite the major rally in the USD Index. Therefore, it's very likely that gold is not ready to slide further before rallying at least in the short term.
Based on the Fibonacci retracement levels, the recent March high, and the rising border of what might be a flag pattern, it seems that gold would top between $1,550 and $1,610, with the middle of the area being the most likely target.
And miners?
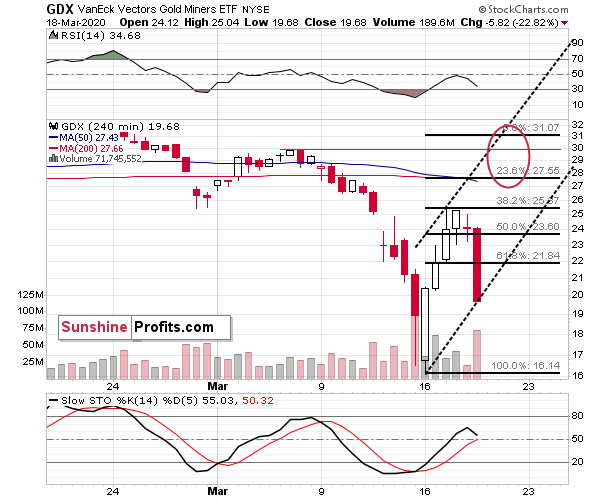
Miners declined strongly yesterday, but let's keep in mind that while silver, general stock market and crude oil moved to new lows, gold tested its lows, and the USD Index soared to new yearly highs - but the miners didn't move to new lows. They closed yesterday's session very visibly above the previous lows. While they finally declined, it's no wonder that they did - they finally had to give in to the pressure of other markets.
However, since the corrective upswing in the stock market is most likely still ahead and both: gold and silver are likely to move higher shortly, miners are likely to soar once again as well.
Technically, yesterday's decline might even be viewed as useful, as it allows for using the analogous tool that we applied to the gold market - the upper border of what might be a flag pattern. Or as some might prefer to call it, the ABC (zigzag) correction.
This technique suggests a comeback to the March high, or even higher, but it seems relatively extreme. After all, neither gold, nor stocks, are likely to get back to their March highs.
In this case, the above technique might be used for something else. It might help to put the size of the upcoming rally into proper perspective. Meaning - if gold rallies to its upper border of the consolidation pattern, but GDX is "only" at $27, it might actually be a sign of weakness in the latter.
Yesterday's decline might seem unpleasant for anyone holding a long position, but given that miners showed strength by not moving even close to their recent lows, given that the upside potential remains intact, and given that the decline provided us with a better point of reference, it seems that it was not that negative after all.
Summary
Summing up, the 2020 top in the precious metals market is in, and we are likely in the early stage of a 2008-like slide that appears to be about even worse than what happened that year. Still, it seems that we'll see a corrective upswing in gold, silver, and miners shortly.
The profits on the new long positions in the miners are already very profitable, but it seems they will become even more so before we close them.
After the corrective upswing is over, we plan to get back on the short side of the precious metals market.
By the way, we recently opened a possibility to extend one's subscription for a year with a 10% discount in the yearly subscription fee (the profits that you took have probably covered decades of subscription fees...). It also applies to our All-Inclusive Package (if you didn't know - we just made huge gains shorting crude oil and are also making money on both the decline and temporary rebound in stocks). The boring time in the PMs is over and the time to pay close attention to the market is here - it might be a good idea to secure more access while saving 10% at the same time. You can proceed using the following link and in case you have some questions, please don't hesitate to contact us:
Secure more access at a discount.
As always, we'll keep you - our subscribers - informed.
To summarize:
Trading capital (supplementary part of the portfolio; our opinion): Full speculative long positions (150% of the full position) in mining stocks (but not in gold nor silver) are justified from the risk/reward perspective with the following binding exit profit-take price levels:
Senior mining stocks (price levels for the GDX ETF): binding profit-take exit price: $26.89; stop-loss: none (the volatility is too big to justify a SL order in case of this particular trade); binding profit-take level for the NUGT ETF: $17.63; stop-loss for the NUGT ETF: none (the volatility is too big to justify a SL order in case of this particular trade)
Junior mining stocks (price levels for the GDXJ ETF): binding profit-take exit price: $35.37; stop-loss: none (the volatility is too big to justify a SL order in case of this particular trade); binding profit-take level for the JNUG ETF: $13.93; stop-loss for the JNUG ETF: none (the volatility is too big to justify a SL order in case of this particular trade)
Long-term capital (core part of the portfolio; our opinion): No positions (in other words: cash)
Insurance capital (core part of the portfolio; our opinion): Full position
Whether you already subscribed or not, we encourage you to find out how to make the most of our alerts and read our replies to the most common alert-and-gold-trading-related-questions.
Please note that the in the trading section we describe the situation for the day that the alert is posted. In other words, it we are writing about a speculative position, it means that it is up-to-date on the day it was posted. We are also featuring the initial target prices, so that you can decide whether keeping a position on a given day is something that is in tune with your approach (some moves are too small for medium-term traders and some might appear too big for day-traders).
Plus, you might want to read why our stop-loss orders are usually relatively far from the current price.
Please note that a full position doesn't mean using all of the capital for a given trade. You will find details on our thoughts on gold portfolio structuring in the Key Insights section on our website.
As a reminder - "initial target price" means exactly that - an "initial" one, it's not a price level at which we suggest closing positions. If this becomes the case (like it did in the previous trade) we will refer to these levels as levels of exit orders (exactly as we've done previously). Stop-loss levels, however, are naturally not "initial", but something that, in our opinion, might be entered as an order.
Since it is impossible to synchronize target prices and stop-loss levels for all the ETFs and ETNs with the main markets that we provide these levels for (gold, silver and mining stocks - the GDX ETF), the stop-loss levels and target prices for other ETNs and ETF (among other: UGLD, DGLD, USLV, DSLV, NUGT, DUST, JNUG, JDST) are provided as supplementary, and not as "final". This means that if a stop-loss or a target level is reached for any of the "additional instruments" (DGLD for instance), but not for the "main instrument" (gold in this case), we will view positions in both gold and DGLD as still open and the stop-loss for DGLD would have to be moved lower. On the other hand, if gold moves to a stop-loss level but DGLD doesn't, then we will view both positions (in gold and DGLD) as closed. In other words, since it's not possible to be 100% certain that each related instrument moves to a given level when the underlying instrument does, we can't provide levels that would be binding. The levels that we do provide are our best estimate of the levels that will correspond to the levels in the underlying assets, but it will be the underlying assets that one will need to focus on regarding the signs pointing to closing a given position or keeping it open. We might adjust the levels in the "additional instruments" without adjusting the levels in the "main instruments", which will simply mean that we have improved our estimation of these levels, not that we changed our outlook on the markets. We are already working on a tool that would update these levels on a daily basis for the most popular ETFs, ETNs and individual mining stocks.
Our preferred ways to invest in and to trade gold along with the reasoning can be found in the how to buy gold section. Additionally, our preferred ETFs and ETNs can be found in our Gold & Silver ETF Ranking.
As a reminder, Gold & Silver Trading Alerts are posted before or on each trading day (we usually post them before the opening bell, but we don't promise doing that each day). If there's anything urgent, we will send you an additional small alert before posting the main one.
Thank you.
Sincerely,
Przemyslaw Radomski, CFA
Editor-in-chief, Gold & Silver Fund Manager

