

Briefly: In our opinion, full (150% of the regular full position) speculative short positions in gold, silver and mining stocks are justified from the risk/reward perspective at the moment of publishing this alert.
In Friday’s Alert we wrote that we would discuss one of the analogies that we mentioned, in greater detail. Today we deliver. The implications are very important even though the analogy is not visible at first sight as it’s not “direct”.
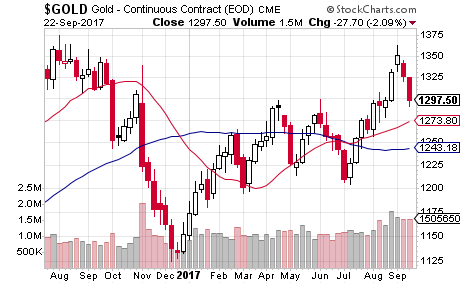
Before moving to details, let’s discuss what happened recently (chart courtesy of http://stockcharts.com).
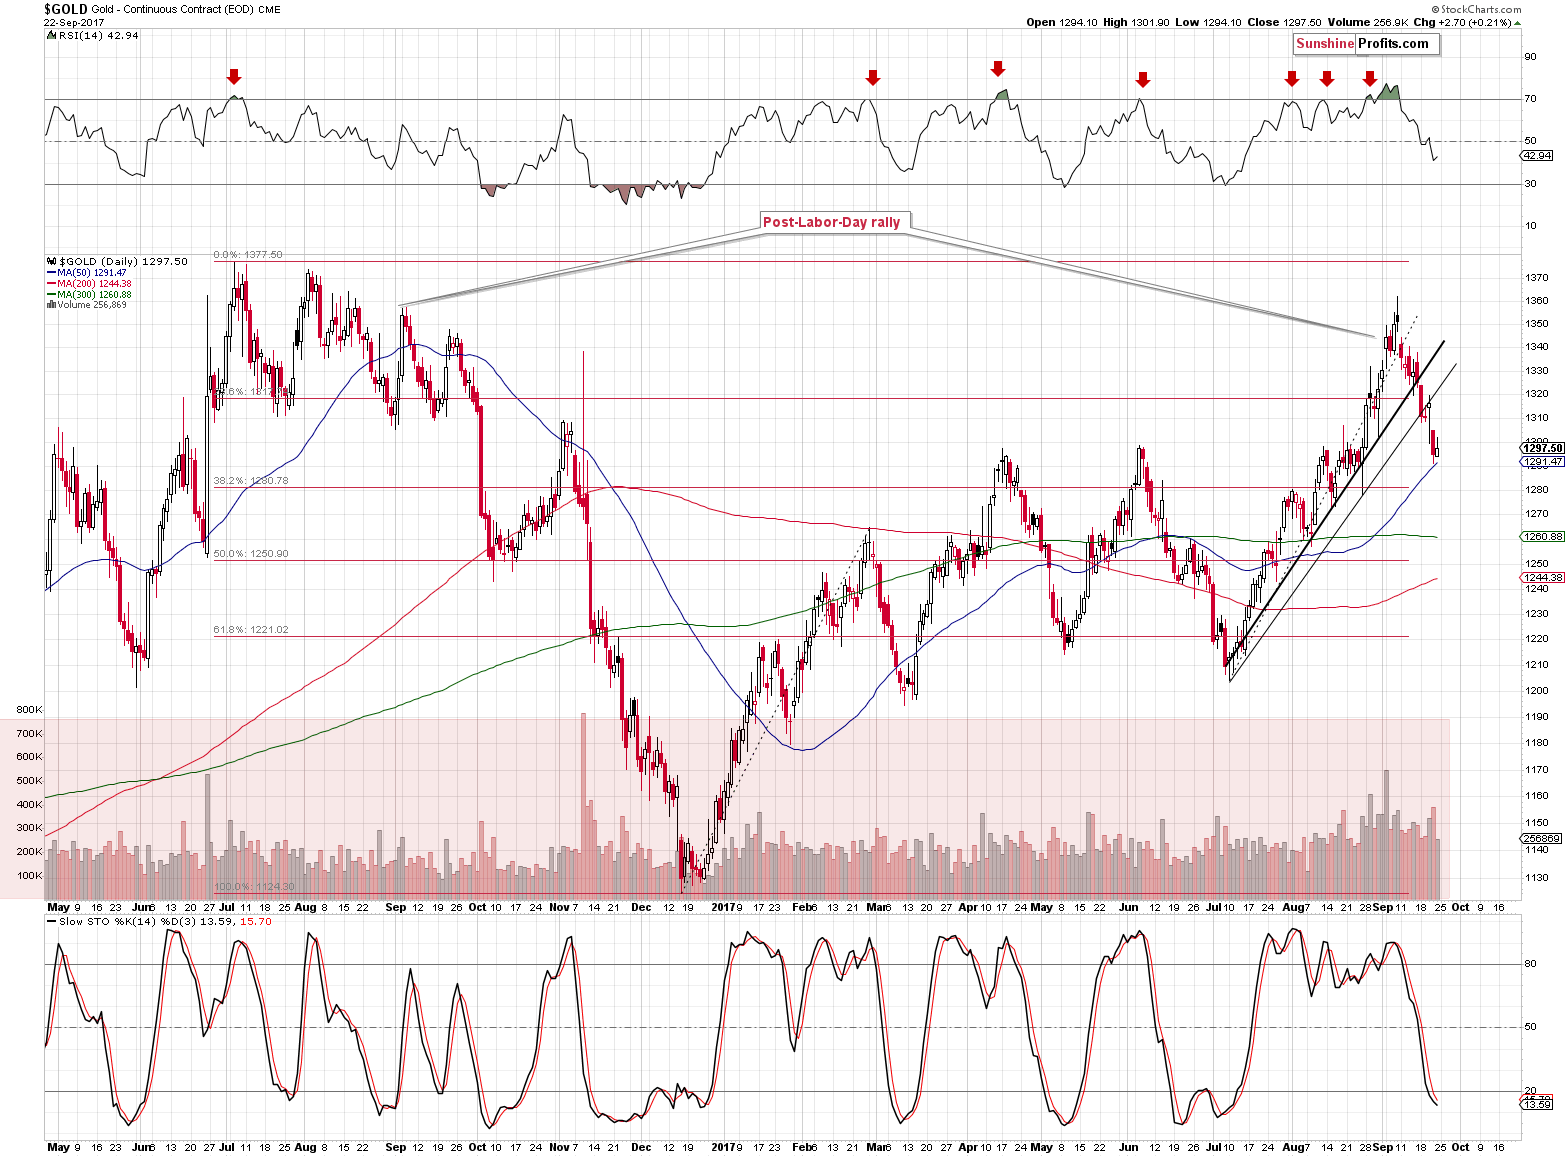
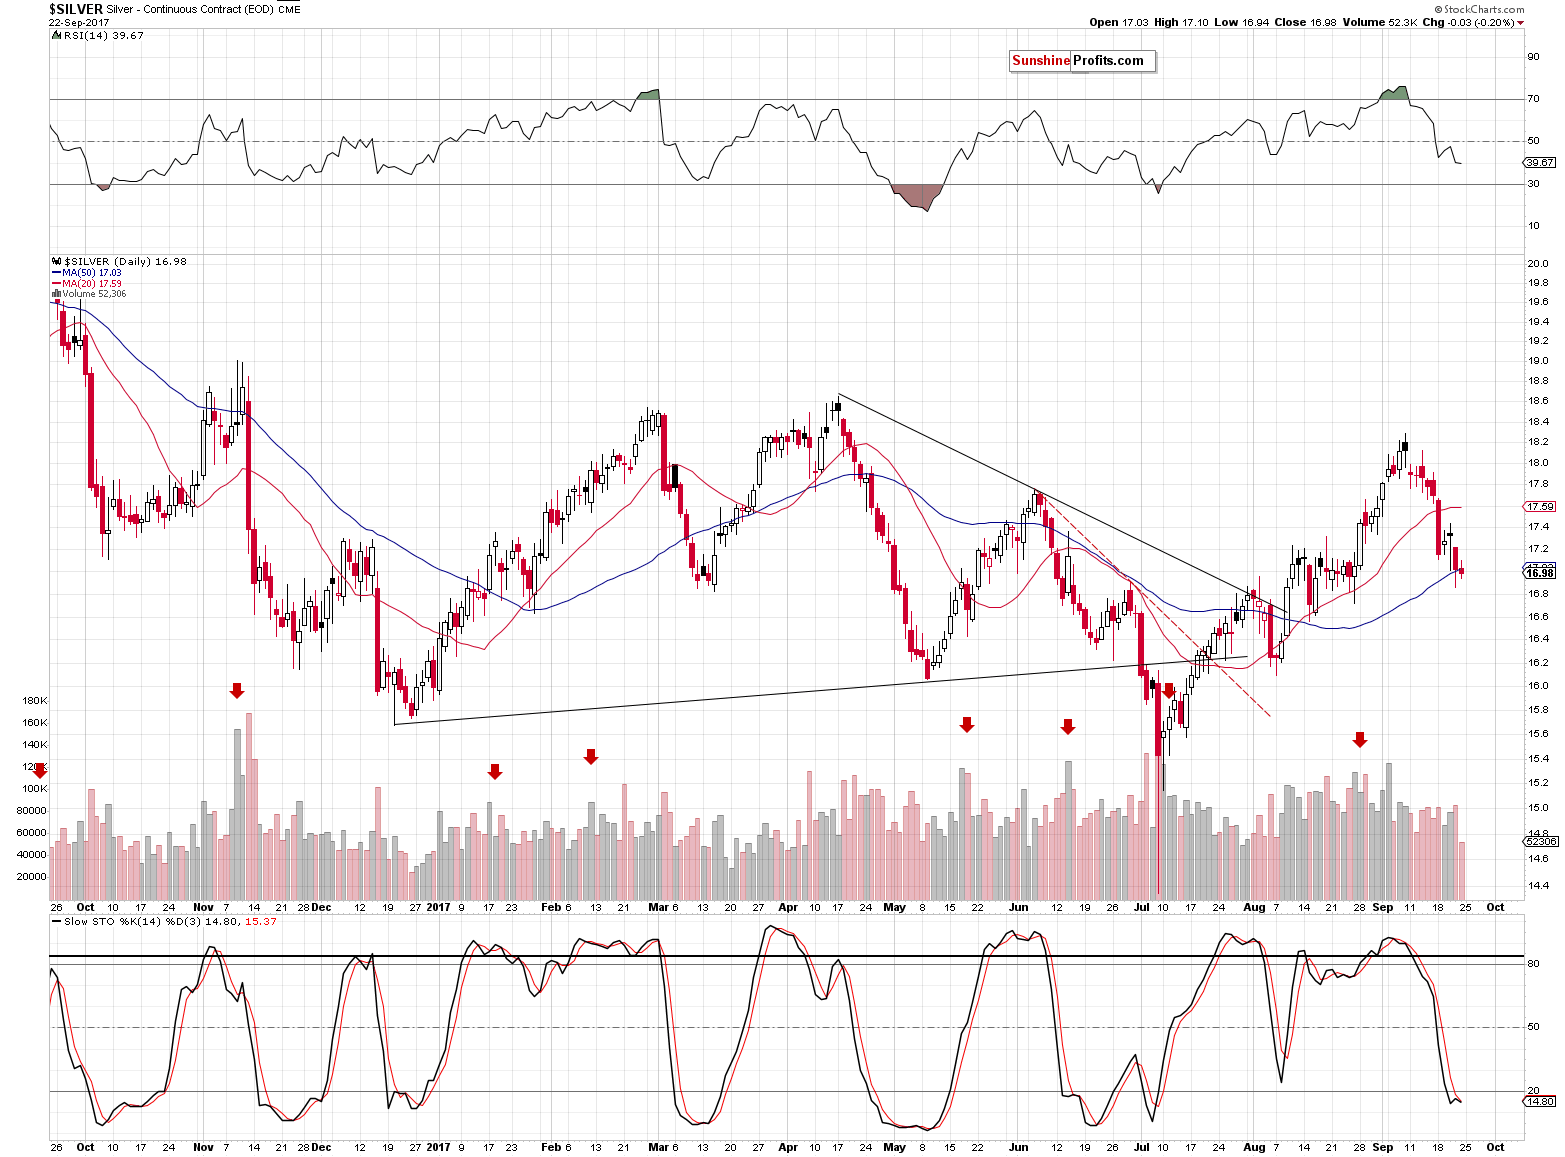
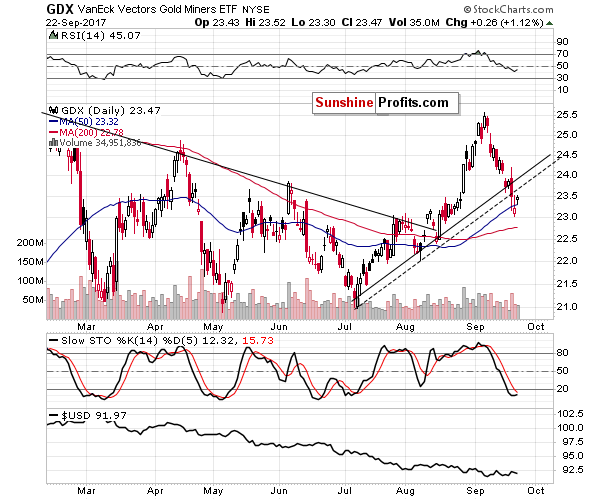
The above charts all show a similar thing – gold, silver and mining stocks paused and the important thing that’s visible in all of them is that the volume was relatively low. This means that the fact that the decline didn’t continue is rather inconsequential – it doesn’t seem that it was an important reversal. Conversely, it seems that it was simply a pause.
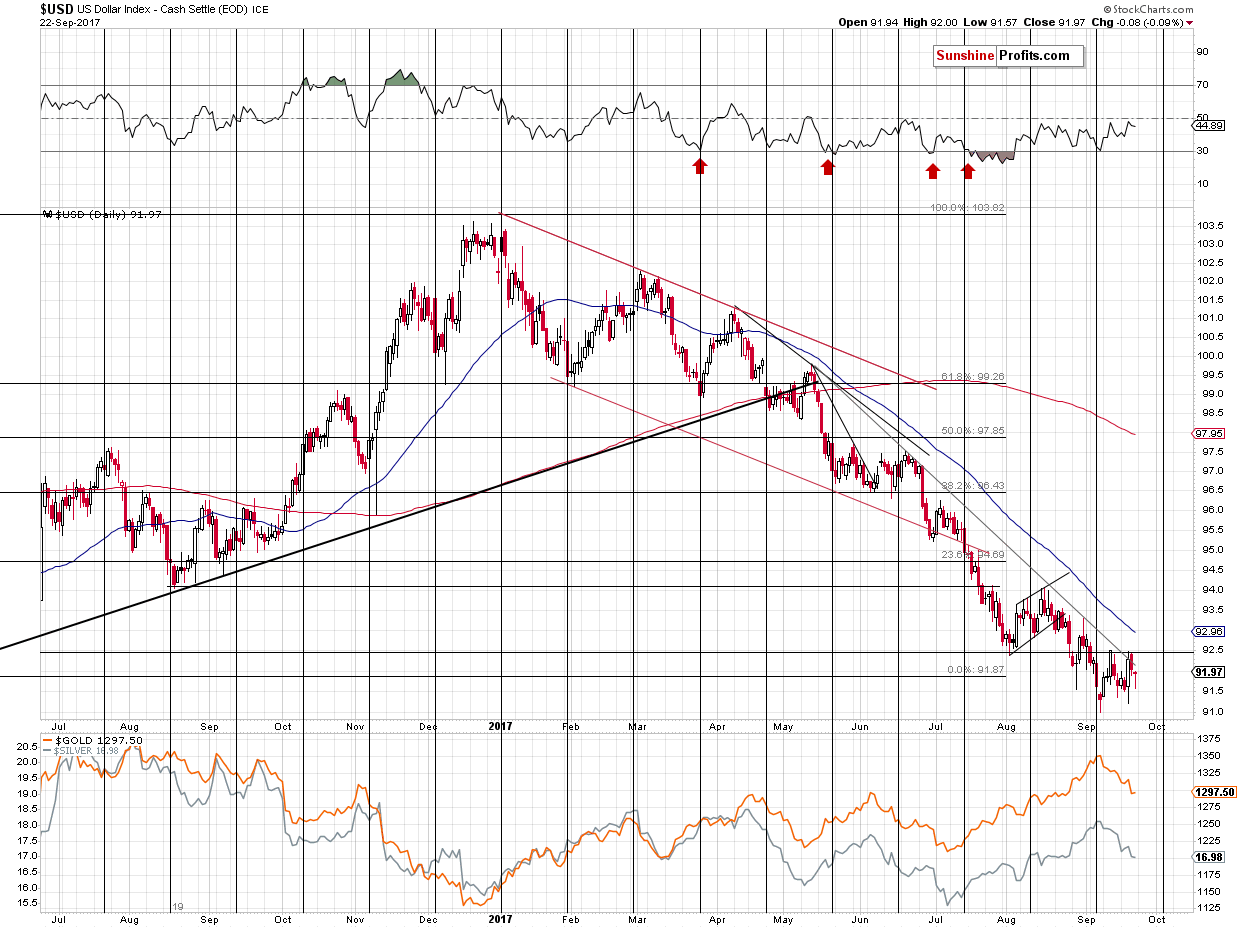
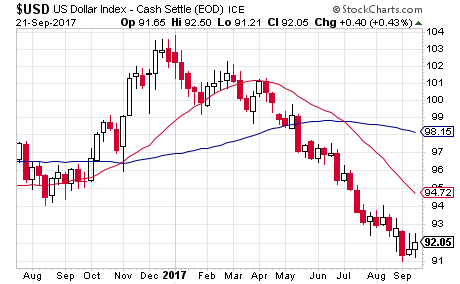
The additional bearish sign comes from comparing the above to the action in the USD Index. The latter moved a bit lower on Friday and didn’t manage to break above the short-term, declining resistance line before the end of the week. The thing is that in the previous weeks the PM market reacted to the USD’s declines after moving to the resistance line by rallying. This time it is not the case. In fact, the precious metals’ reaction has been providing bearish signals for days – the USD has been moving back and forth this month, while the precious metals market has declined decisively. The outlook for the latter remains bearish.
Having said that, let’s move to the most interesting part – the important analogy that we mentioned previously. Let’s start by quoting Friday’s alert and discussing the chart that we featured.
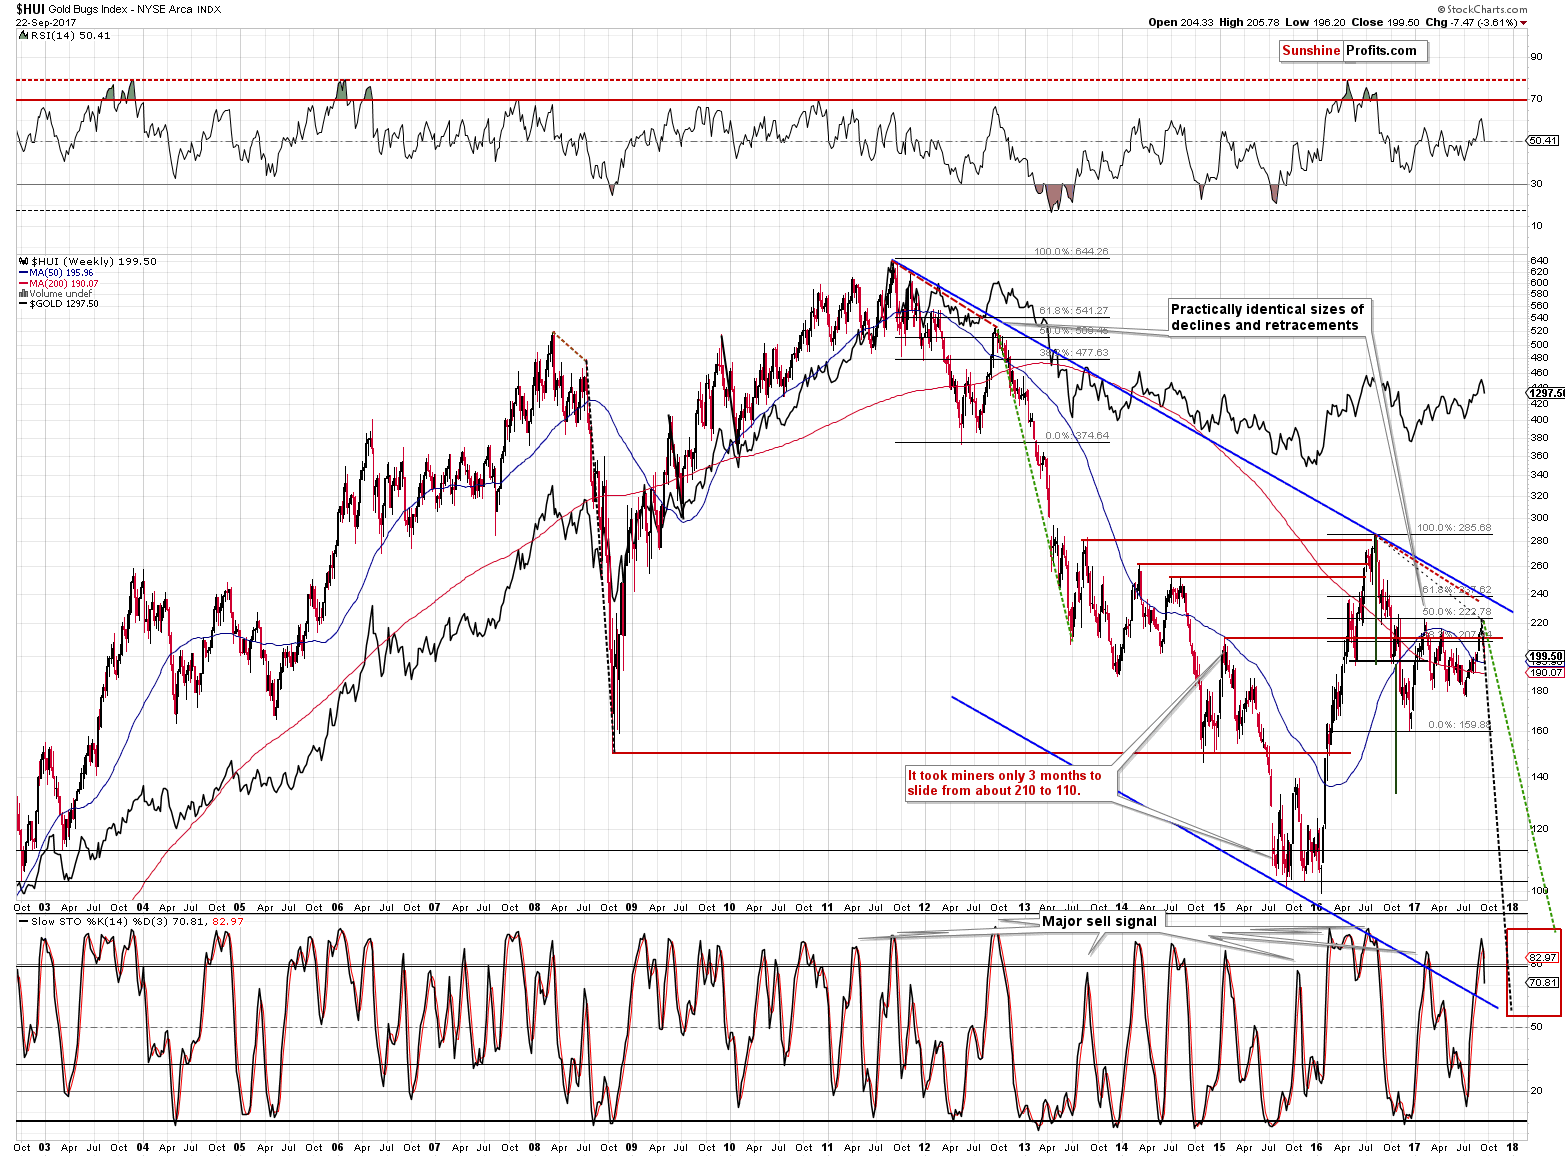
There is also an analogy to the 2008 rally and subsequent decline, less visible at first sight (we’ll discuss it in greater detail in future alerts), but still important. The distance between the tops was different back then than it is now, but the pace of the decline between them was almost identical (compare the dashed lines connecting them). That’s yet another reason to believe that the most recent top in the HUI Index was indeed the final one and that much bigger declines are to follow.
The pace of decline is not the only thing that makes the two situations (the 2016 top – today and the distance between two 2008 tops) alike.
Please take a look at the charts below without looking at the time axis.
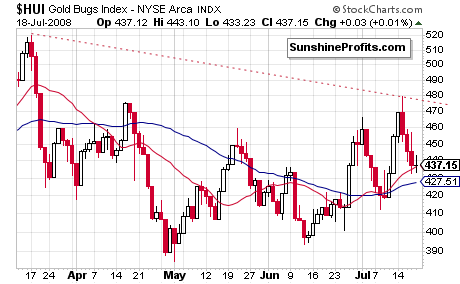
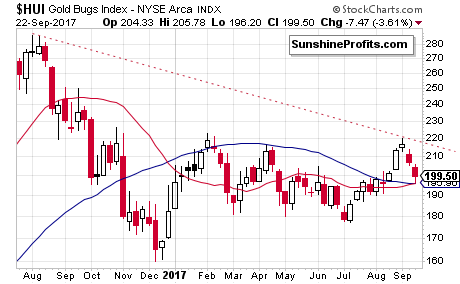
Identical? No. Similar? You bet. A decline for about 1/3 of the time, then a rally, then a few local bottoms and another rally to the previous local high. The performance of the red moving average is also similar. The more similar a given pattern is, the more likely the follow-up action is to be alike as well.
Both charts feature the HUI Index. The thing that makes them hard to spot for the average investor and analyst is that they are not created based on the same candlestick type. The first chart is based on daily candlesticks and the second one is based on the weekly ones. The first chart shows the HUI’s performance in a few months and the second features its performance in more than a year. Most people don’t know that the markets have a fractal nature and that they often are self-similar (roughly speaking, the pattern becomes similar once you zoom in or zoom out).
The fact that both patterns were preceded by sharp rallies in the HUI Index further increases the credibility of the analogy.
What happened in 2008 after the cut-off point of the above chart? The HUI Index declined by almost 300 points in a very sharp manner. Consequently, based on the above self-similar pattern, we’re likely to see a big and sharp move lower relatively soon – it’s likely that it’s already underway.
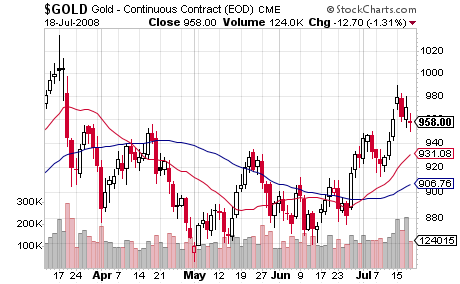
The analogy is also visible in gold. In this case the pattern is not as aligned. The interesting thing, however, is that in both cases, gold moved quite high before the final top formed – even above the previous local highs.
The patterns are not identical in case of both gold and gold stocks, but the fact that they are similar to a big extent is remarkable, because based on what happened in the USD Index in both cases, one could expect the price patterns to be completely different.
Back in 2008, the USD was trading back and forth, while in the past year we’ve seen a decisive rally followed by an even more decisive and steady decline. The price patterns were indeed very different, so the degree of similarity in the case of gold and – in particular – gold stocks is indeed remarkable.
Not everything about the USD patterns seems different, though.
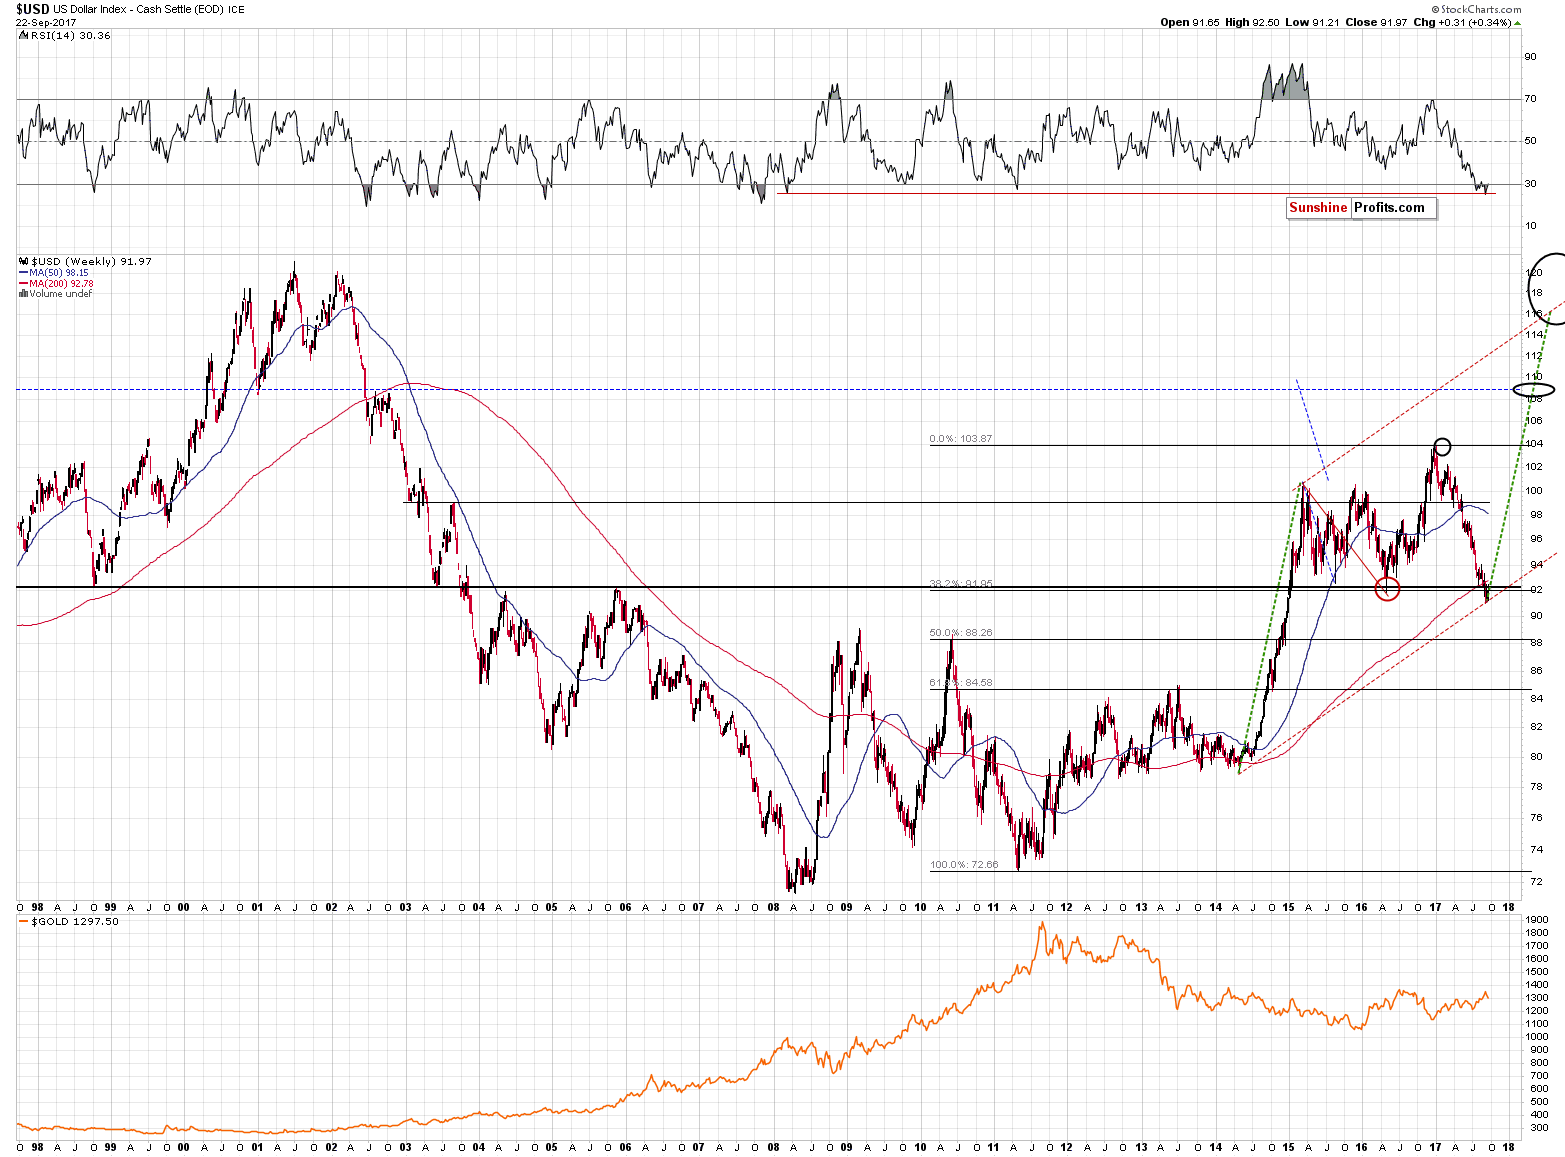
Namely, the RSI hit levels not seen since the 2008 bottom, which means that the most recent situation similar to what we’re seeing right now was precisely the time before the huge 2008 upswing.
In 2008, the above pattern was followed by roughly a 16-index-point rally, so the implications for the USD are currently very bullish. Naturally, this makes them very bearish for the precious metals sector.
Summing up, the analogy to the 2008 pre-plunge price swings is quite visible in the case of gold and very visible in the case of gold stocks. The implications are very bearish, especially in light of a different analogy (RSI) in the case of the USD Index and multiple bearish signs that we have already seen: palladium’s rally and an invalidation of its breakout, extreme monthly volume in gold in August, invalidations of key breakouts in gold and silver and overall excitement that accompanied gold’s move above $1,300.
As always, we will keep you – our subscribers – informed.
To summarize:
Trading capital (supplementary part of the portfolio; our opinion): Short positions (150% of the full position) in gold, silver and mining stocks are justified from the risk/reward perspective with the following stop-loss orders and initial target price levels / profit-take orders:
- Gold: initial target price level: $1,063; stop-loss: $1,366; initial target price for the DGLD ETN: $81.88; stop-loss for the DGLD ETN $38.74
- Silver: initial target price: $13.12; stop-loss: $19.22; initial target price for the DSLV ETN: $46.18; stop-loss for the DSLV ETN $17.93
- Mining stocks (price levels for the GDX ETF): initial target price: $9.34; stop-loss: $26.34; initial target price for the DUST ETF: $143.56; stop-loss for the DUST ETF $21.37
In case one wants to bet on junior mining stocks' prices (we do not suggest doing so – we think senior mining stocks are more predictable in the case of short-term trades – if one wants to do it anyway, we provide the details), here are the stop-loss details and initial target prices:
- GDXJ ETF: initial target price: $14.13; stop-loss: $45.31
- JDST ETF: initial target price: $417.04; stop-loss: $43.12
Long-term capital (core part of the portfolio; our opinion): No positions (in other words: cash)
Insurance capital (core part of the portfolio; our opinion): Full position
Important Details for New Subscribers
Whether you already subscribed or not, we encourage you to find out how to make the most of our alerts and read our replies to the most common alert-and-gold-trading-related-questions.
Please note that the in the trading section we describe the situation for the day that the alert is posted. In other words, it we are writing about a speculative position, it means that it is up-to-date on the day it was posted. We are also featuring the initial target prices, so that you can decide whether keeping a position on a given day is something that is in tune with your approach (some moves are too small for medium-term traders and some might appear too big for day-traders).
Plus, you might want to read why our stop-loss orders are usually relatively far from the current price.
Please note that a full position doesn’t mean using all of the capital for a given trade. You will find details on our thoughts on gold portfolio structuring in the Key Insights section on our website.
As a reminder – “initial target price” means exactly that – an “initial” one, it’s not a price level at which we suggest closing positions. If this becomes the case (like it did in the previous trade) we will refer to these levels as levels of exit orders (exactly as we’ve done previously). Stop-loss levels, however, are naturally not “initial”, but something that, in our opinion, might be entered as an order.
Since it is impossible to synchronize target prices and stop-loss levels for all the ETFs and ETNs with the main markets that we provide these levels for (gold, silver and mining stocks – the GDX ETF), the stop-loss levels and target prices for other ETNs and ETF (among other: UGLD, DGLD, USLV, DSLV, NUGT, DUST, JNUG, JDST) are provided as supplementary, and not as “final”. This means that if a stop-loss or a target level is reached for any of the “additional instruments” (DGLD for instance), but not for the “main instrument” (gold in this case), we will view positions in both gold and DGLD as still open and the stop-loss for DGLD would have to be moved lower. On the other hand, if gold moves to a stop-loss level but DGLD doesn’t, then we will view both positions (in gold and DGLD) as closed. In other words, since it’s not possible to be 100% certain that each related instrument moves to a given level when the underlying instrument does, we can’t provide levels that would be binding. The levels that we do provide are our best estimate of the levels that will correspond to the levels in the underlying assets, but it will be the underlying assets that one will need to focus on regarding the signs pointing to closing a given position or keeping it open. We might adjust the levels in the “additional instruments” without adjusting the levels in the “main instruments”, which will simply mean that we have improved our estimation of these levels, not that we changed our outlook on the markets. We are already working on a tool that would update these levels on a daily basis for the most popular ETFs, ETNs and individual mining stocks.
Our preferred ways to invest in and to trade gold along with the reasoning can be found in the how to buy gold section. Additionally, our preferred ETFs and ETNs can be found in our Gold & Silver ETF Ranking.
As a reminder, Gold & Silver Trading Alerts are posted before or on each trading day (we usually post them before the opening bell, but we don't promise doing that each day). If there's anything urgent, we will send you an additional small alert before posting the main one.
=====
Latest Free Trading Alerts:
The latest FOMC meeting was accompanied by Janet Yellen’s press conference. Let’s analyze the implications of her remarks for the gold market.
Yellen’s September 2017 Press Conference and Gold
S&P 500 index gained 0.06% on Friday, as it continued to trade along the level of 2,500. Is this a topping pattern or just relatively flat correction within an uptrend? Is holding medium-term short position still justified?
Mixed Expectations, Will Stocks Continue Higher?
We saw relatively significant appreciation on Monday, followed by weaker depreciation. What might this mean for the market?
=====
Hand-picked precious-metals-related links:
PRECIOUS-Gold falls as dollar firms, N.Korea worries ease
Investors wary as Tanzania moves to assert more control over mines
Here's why gold will not glitter this Diwali
=====
In other news:
Euro Drops as German Vote Sinks In; Gold Retreats: Markets Wrap
Merkel’s Bloc Regroups After ‘Nightmare Victory’ in Germany
Merkel gets a fourth term but German voters deliver far-right surge
Bank of England warns a consumer debt crisis could cost banks £30bn
Japanese PM Abe says election won't distract him from tackling North Korea
What the U.K. Rating Cut Does (and Doesn't) Tell Us
=====
Thank you.
Sincerely,
Przemyslaw Radomski, CFA
Founder, Editor-in-chief, Gold & Silver Fund Manager
Gold & Silver Trading Alerts
Forex Trading Alerts
Oil Investment Updates
Oil Trading Alerts

