

Briefly: in our opinion, full (250% of the regular size of the position) speculative short position in gold, silver, and mining stocks is justified from the risk/reward perspective at the moment of publishing this Alert.
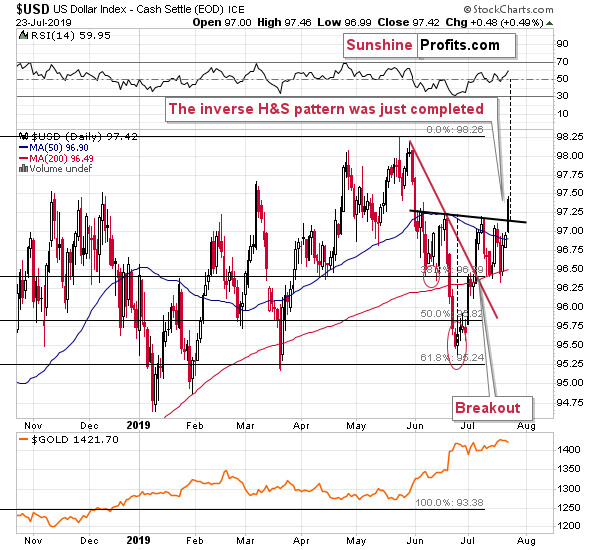
The dam is broken. In general, this means that the water will now run its course lower, until reaching the sea, but in case of the current situation on the currency market it means exactly the opposite. The USD Index just broke above the neck level and completed the inverse head and shoulders formation. And it's means a lot not only for the forex traders, but also for anyone interested in gold or silver.
Let's jump right into details.
The King Dollar Spoke
We previously commented on the USD Index by describing the possible (!) implications of the potential (!) pattern that might have been forming. Until a given pattern is completed, it has practically no direct implications. If it was any other way, a partial pattern would itself become a pattern (a.k.a. formation) with its own name and implications.
What we saw yesterday was a decisive breakout above the neck level of the inverse head-and-shoulders pattern, which means that the short-term outlook for the USD Index just improved in a major way. The rally that follows this kind of formation is likely to be at least as big as the size of the head. We marked it with the vertical, dashed line. Yes, it implies a move well above the previous 2019 high.
It seems that the precious metals investors are not "buying it" yet. The dollar failed to break to new highs many times, so many people are assuming that it will fail once again. However, the inverse H&S pattern tells us that this time it's actually going to soar through the previous highs. This will likely be a big surprise for the PM investors and when people are surprised, they act quickly. This time, the reaction will likely be driven by fear, which will probably make it particularly volatile.
Gold moved higher recently, but it failed to rally above the late-2013 high - it invalidated the initial breakout. Invalidations of breakouts are usually followed by sizable declines, and the current situation in the USD Index perfectly fits this scenario for gold.
Let's keep the long-term USD Index outlook in mind - the U.S. currency is not likely to stop just a little above the previous 2019 high. Our previous comments on the below chart remain mostly up-to-date, with an important difference. The difference is that the inverse head-and-shoulders pattern was already completed - it's not something that could potentially happen; it's a fact. This makes the outlook even more bullish.
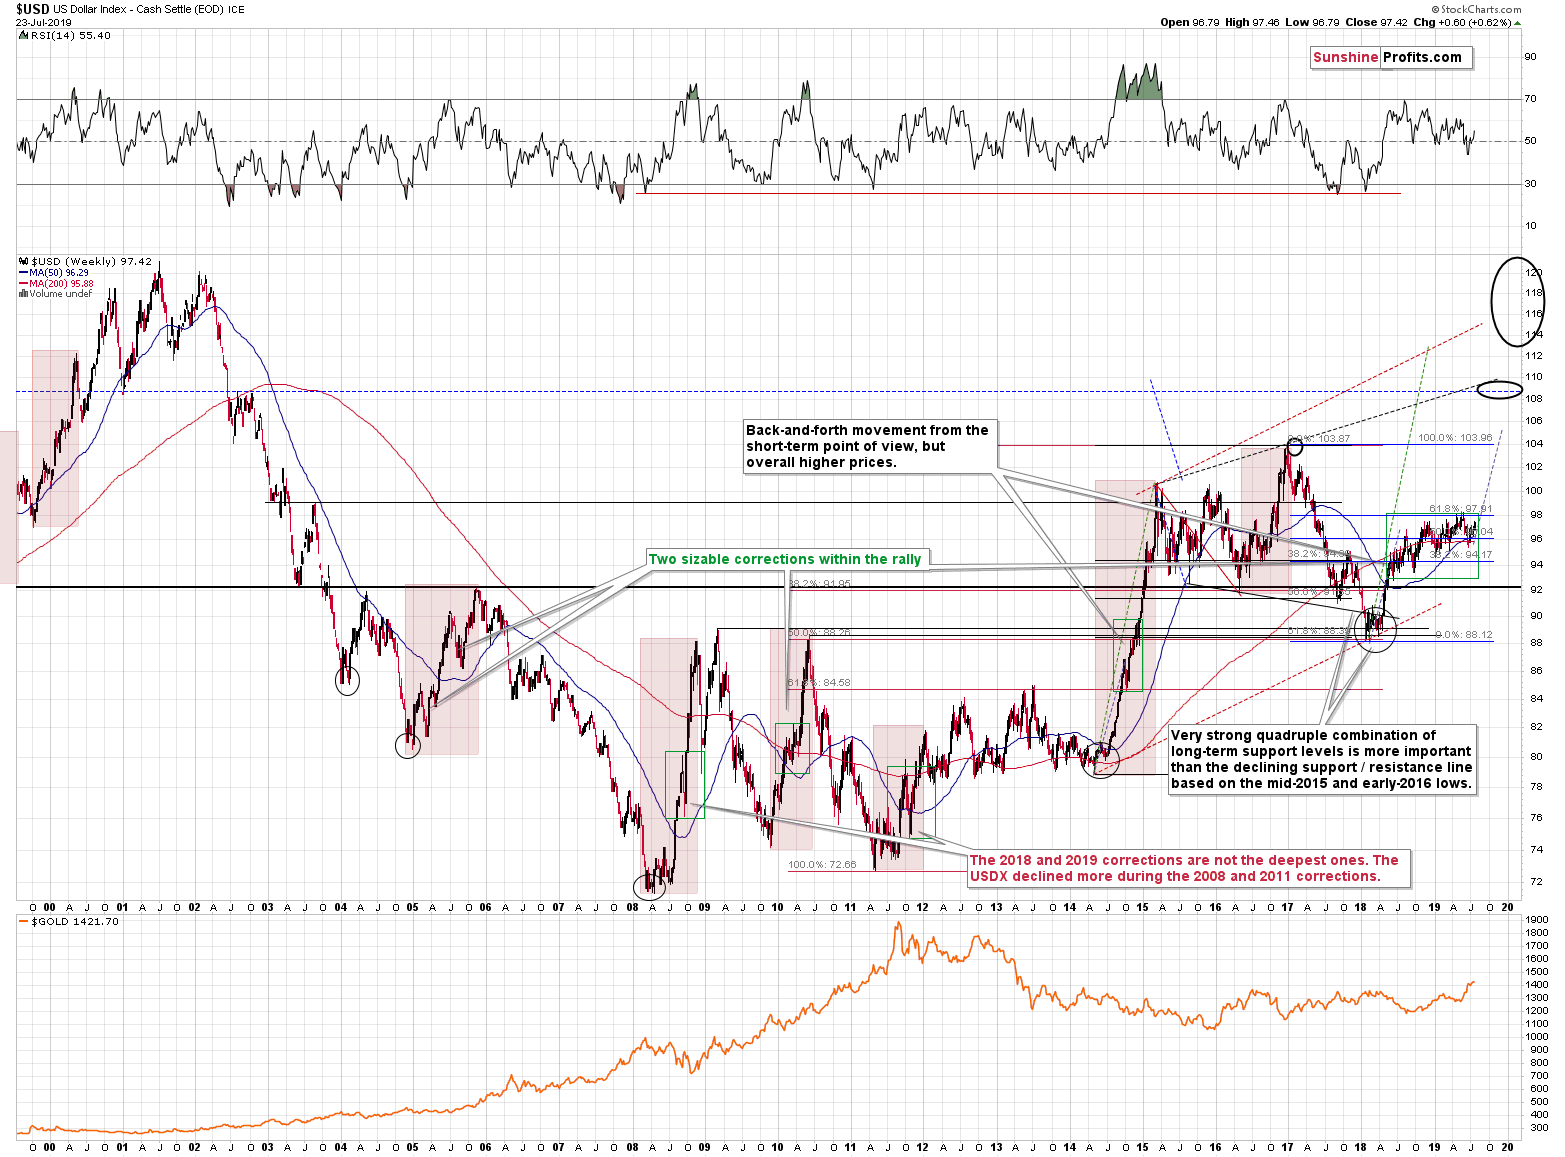
[Substantial rally from the current levels] would also mean a breakout above the running consolidation and this would imply an upside target of about 105, as the moves that follow consolidations tend to be similar to those that preceded them.
This, in turn, would imply a breakout above the 2016 / 2017 high that could - and likely would - result in an even more profound rally. The next big resistance is at about 108 level. Such a big USD rally is very likely to translate into new lows in gold.
The price of gold and the value of the USD Index don't move in perfect inverse tune at all times, but they move in the opposite directions in general, and big moves in the USDX are very unlikely to be ignored by the yellow metal. And this all might have started with yesterday's [breakout].
As far as the precious metals' and miners' performance is concerned, we actually have little to add over what we wrote yesterday as nothing particularly new happened.
More of the Same in PMs
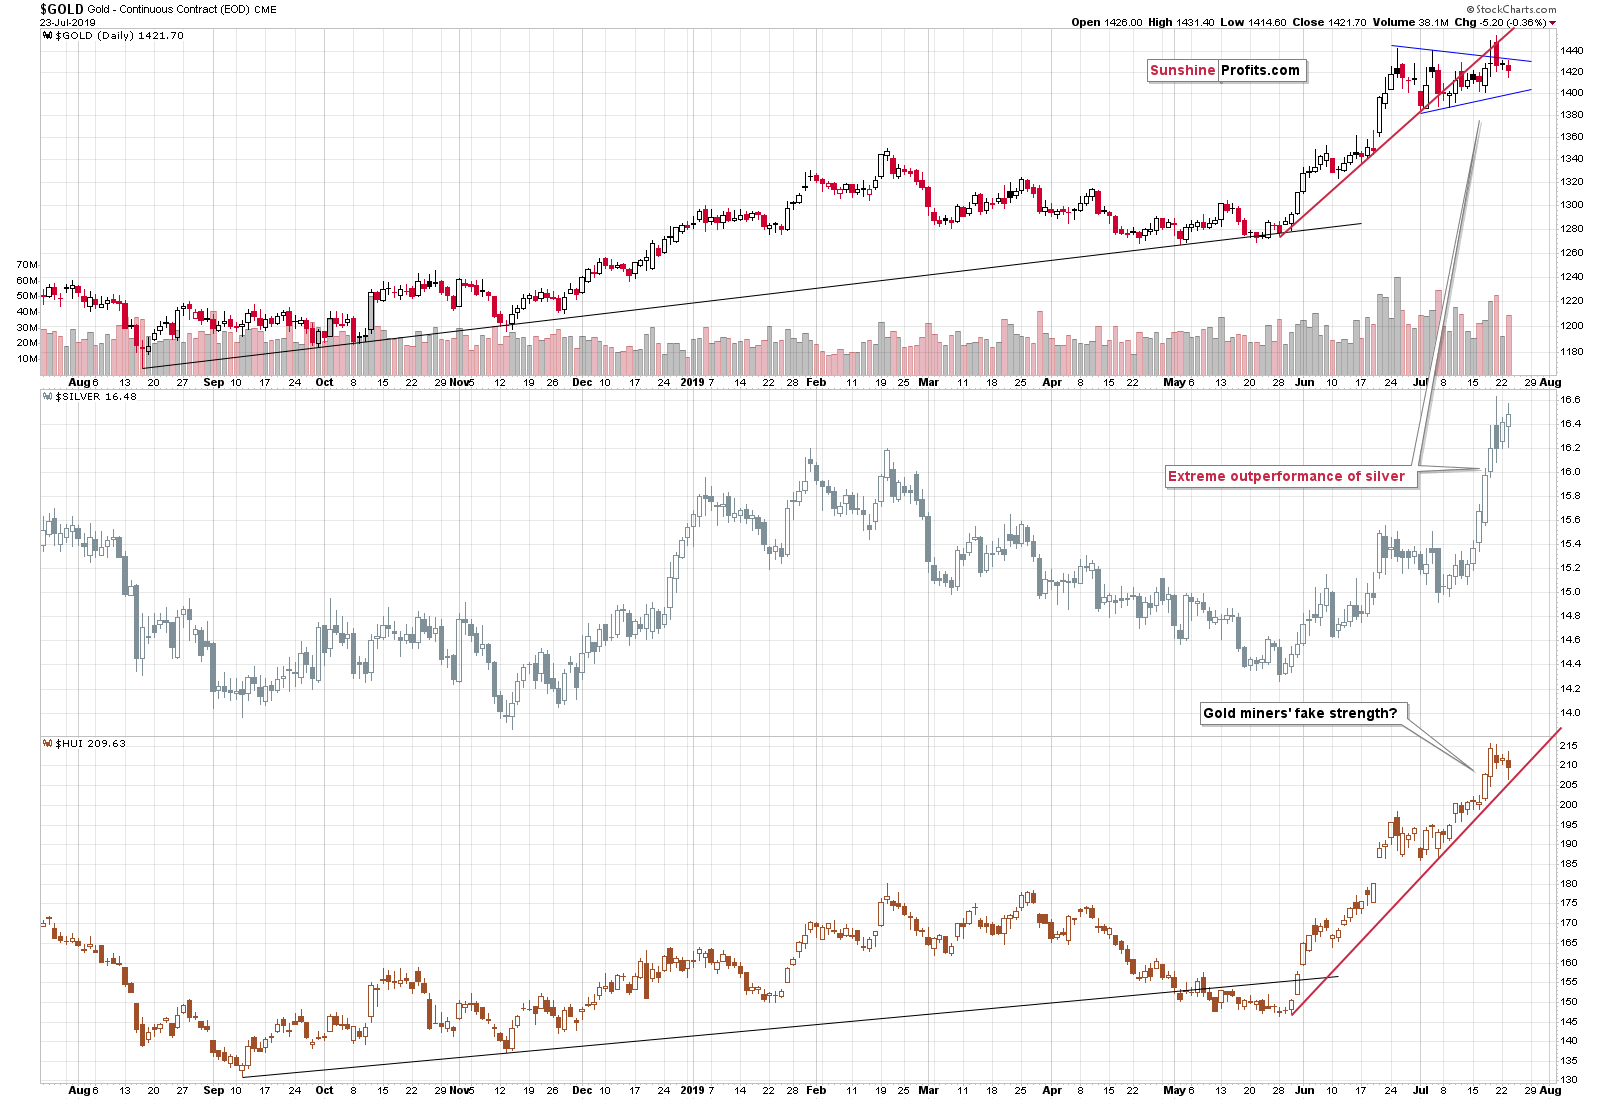
Gold and miners moved lower yesterday, but silver moved higher.
We already had commented on silver's outperformance multiple times and the implication of yesterday's price action is exactly the same as the implication of the previous cases of such outperformance. In short, they are bearish as the white metal has a very long history of outperforming gold right before plunging.
Gold is after its breakdown below the rising red support line, while mining stocks just moved to the analogous line, back up. The breakdown in mining stocks is likely to translate into a much more profound decline than what we saw yesterday.
Actually, it's quite likely the beginning of something that very few investors can imagine right now.
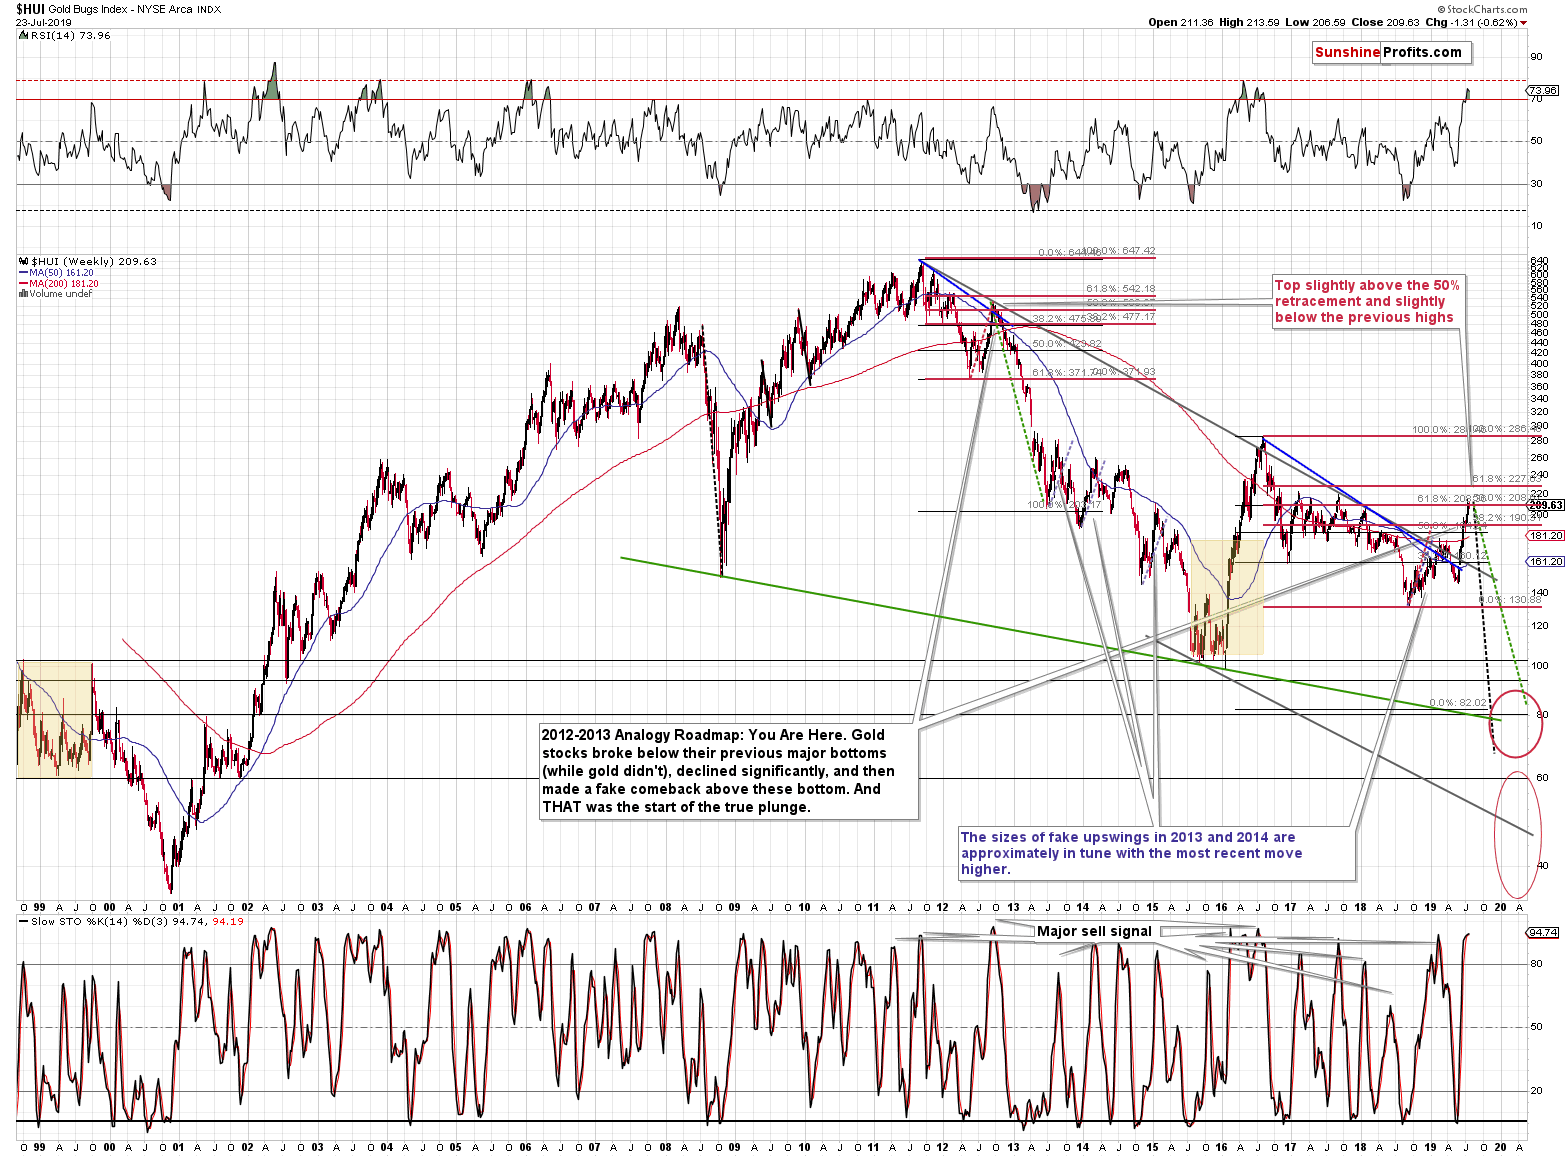
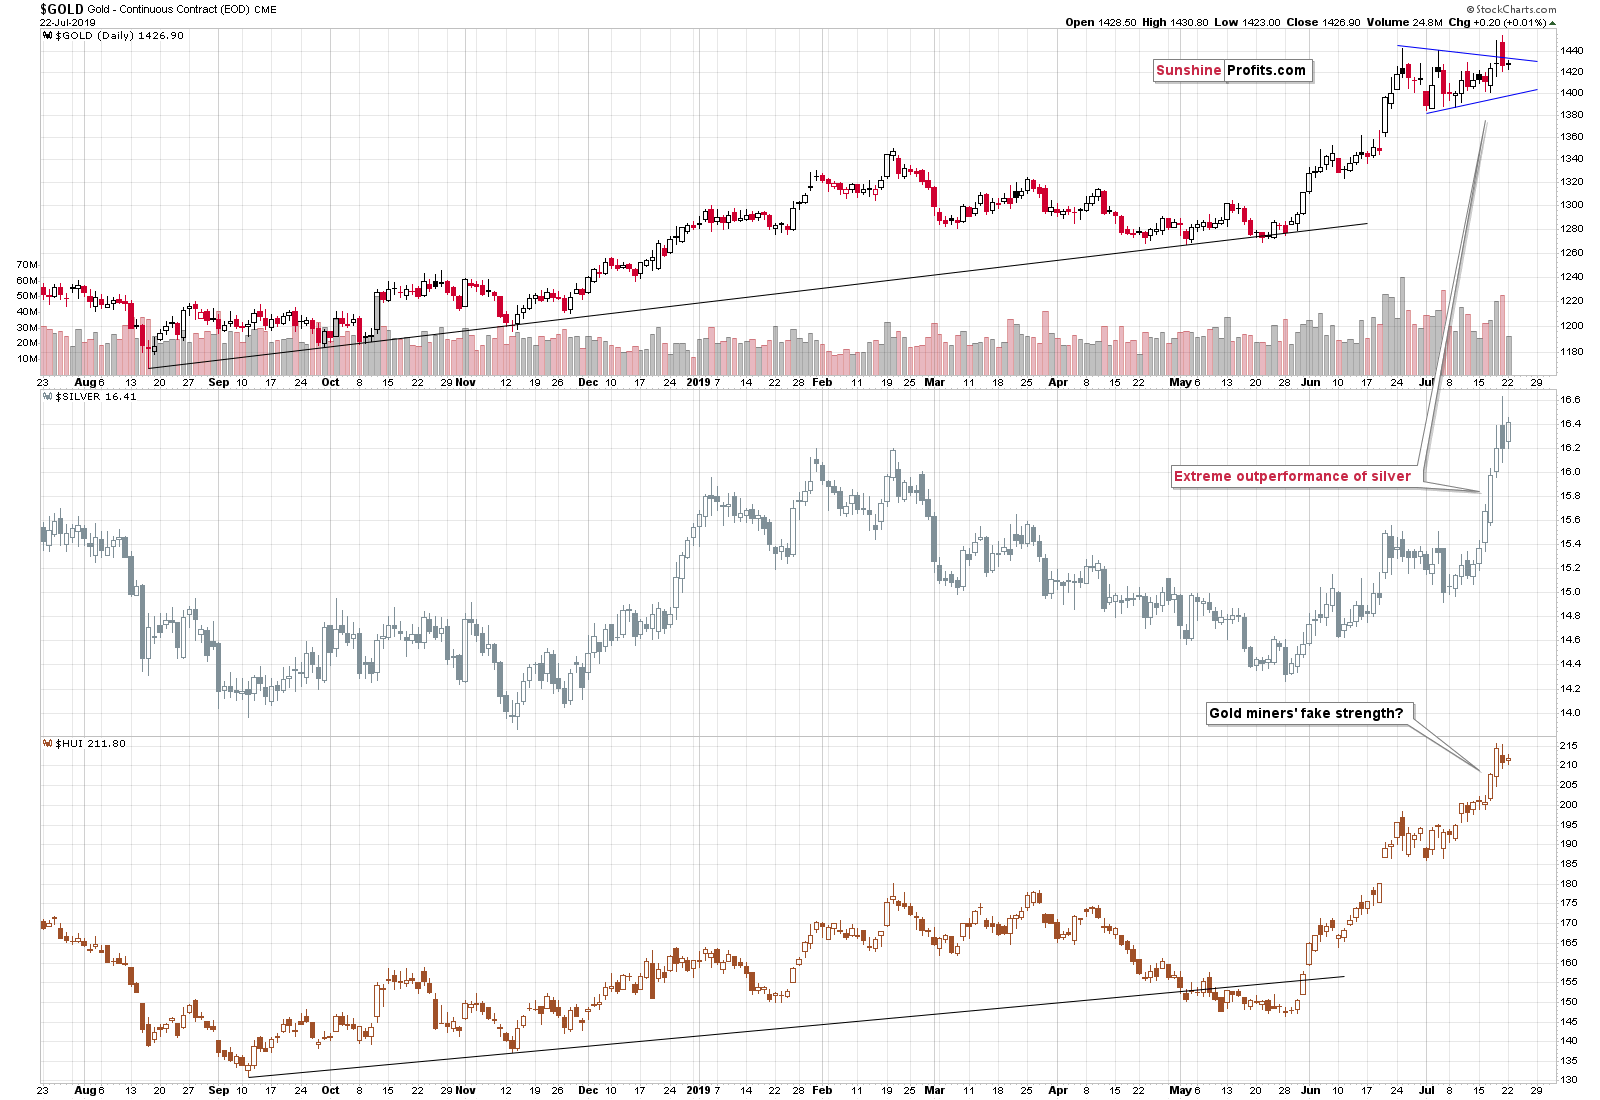
Based on the analogy to what we saw in late 2012, the current - so far small - turnaround can be the very thing that starts a decline that's many times bigger. Our previous comments on the above chart remain up-to-date:
The above gold stock chart continues to highlight how similar the current situation is to what we saw in late 2012. People are very excited by gold miners' gains and the same was the case in 2012. Back then people were practically sure that gold and gold miners are going to move to new highs shortly. We have many investors and analysts thinking the same thing right now. What really followed in the past, was the biggest decline that we saw in the past several decades.
(...) Back in late 2012, the HUI Index moved a bit above its 50% retracement of the preceding decline before the top was formed. The analogous retracement is currently at about 208.
(...) Why is the situation likely to repeat itself? Because this is what generally tends to happen in the market. Not every time, but often enough to make it worth one's while to look for the similarities. The more similar the moves are, the more likely it is that the follow-up action will be similar as well. Please note that the shape of the 2018 - now rally is also similar to the one that we saw in 2012. The entire rally consisted of two parts that were separated by a decline that started from the 200-week moving average (marked with red). The second rally was sharper and bigger than the initial one. We see the same thing right now. In yesterday's first Alert, we emphasized the similarity with regard to volume in silver - the late-2012 top was one of the cases that were similar to the current situation.
Of course, just as it was the case in late 2012, we now have multiple analysts and investors that are convinced that the entire precious metals market is taking off to new highs. But will this really be the case? We doubt it.
(...) please consider the current breakout above 200 and how similar it is to the early 2016 breakdown below the 100 level. Both numbers are very round, and in both cases, gold miners moved to new extremes even though gold didn't. In 2016 the fake breakdown meant the start of the biggest rally in years. With the current strength, are we about to see the biggest decline in years? This appears very likely, also based on silver's outperformance and SLV's epic volume that we discussed [previously].
The rally is now practically just as big as it was in the late 2012 - naturally in relative terms. The HUI Index is slightly above the 50% Fibonacci retracement, not yet at the 61.8% retracement, and a bit below the previous highs. In this case, these are the 2017 highs, and in the past, these were the early 2012 highs.
Before summarizing, we would like to add a few words on the highly anticipated interest rate cut. We just posted a bigger analysis of this issue and you can read it over here. There are two key take-aways. The first is that the investors are likely expecting too much (almost 25% of investors expect a 50-basis points cut), so just a 25-bp cut might be something more hawkish than the market expects and thus gold could decline. The second is that a lot will depend on what comments are made along with the interest rate cut, but unless they are particularly dovish, gold could decline. Why? Because - quoting the above-linked article:
Gold struggled in anticipation of the hike at the FOMC meeting, but rallied after the actual hike. The argument a contrario would be that the gold prices rallied in anticipation of the interest rate cut at the FOMC meeting, but they will fall after the actual cut.
Summary
Summing up, these are not pleasant times for anyone who refuses to jump on the bullish bandwagon just because prices are moving higher, but what's profitable is rarely the thing that feels good initially. The relative strength in the silver market is a factor that's beyond bearish, while the strength in gold stocks appears just as misleading as their weakness was back in early 2016. Gold has just invalidated its breakout above the previous highs, the late-2013 highs, and the upper border of the pennant pattern, which is a very strong bearish sign. The implications of the breakout above the neck level of the inverse head and shoulders pattern in the USD Index are bullish for the latter and serve as a strong bearish indication for the precious metals market that tends to move in the opposite way to the USD Index. It could be the case that the USD Index keeps on rallying or building base for another big upswing while gold declines only modestly, while waiting for the interest rate decision - and that it will plunge only after the waiting-based tension is removed.
As always, we'll keep you - our subscribers - informed.
To summarize:
Trading capital (supplementary part of the portfolio; our opinion): Full short position (250% of the full position) in gold, silver, and mining stocks are justified from the risk/reward perspective with the following stop-loss orders and exit profit-take price levels:
- Gold: profit-take exit price: $1,241; stop-loss: $1,468; initial target price for the DGLD ETN: $51.87; stop-loss for the DGLD ETN $30.27
- Silver: profit-take exit price: $13.81; stop-loss: $16.73; initial target price for the DSLV ETN: $39.08; stop-loss for the DSLV ETN $22.87
- Mining stocks (price levels for the GDX ETF): profit-take exit price: $17.61; stop-loss: $29.27; initial target price for the DUST ETF: $32.28; stop-loss for the DUST ETF $6.88
In case one wants to bet on junior mining stocks' prices (we do not suggest doing so - we think senior mining stocks are more predictable in the case of short-term trades - if one wants to do it anyway, we provide the details), here are the stop-loss details and target prices:
- GDXJ ETF: profit-take exit price: $23.71; stop-loss: $43.47
- JDST ETF: profit-take exit price: $73.32 stop-loss: $13.87
Long-term capital (core part of the portfolio; our opinion): No positions (in other words: cash)
Insurance capital (core part of the portfolio; our opinion): Full position
Whether you already subscribed or not, we encourage you to find out how to make the most of our alerts and read our replies to the most common alert-and-gold-trading-related-questions.
Please note that the in the trading section we describe the situation for the day that the alert is posted. In other words, it we are writing about a speculative position, it means that it is up-to-date on the day it was posted. We are also featuring the initial target prices, so that you can decide whether keeping a position on a given day is something that is in tune with your approach (some moves are too small for medium-term traders and some might appear too big for day-traders).
Plus, you might want to read why our stop-loss orders are usually relatively far from the current price.
Please note that a full position doesn't mean using all of the capital for a given trade. You will find details on our thoughts on gold portfolio structuring in the Key Insights section on our website.
As a reminder - "initial target price" means exactly that - an "initial" one, it's not a price level at which we suggest closing positions. If this becomes the case (like it did in the previous trade) we will refer to these levels as levels of exit orders (exactly as we've done previously). Stop-loss levels, however, are naturally not "initial", but something that, in our opinion, might be entered as an order.
Since it is impossible to synchronize target prices and stop-loss levels for all the ETFs and ETNs with the main markets that we provide these levels for (gold, silver and mining stocks - the GDX ETF), the stop-loss levels and target prices for other ETNs and ETF (among other: UGLD, DGLD, USLV, DSLV, NUGT, DUST, JNUG, JDST) are provided as supplementary, and not as "final". This means that if a stop-loss or a target level is reached for any of the "additional instruments" (DGLD for instance), but not for the "main instrument" (gold in this case), we will view positions in both gold and DGLD as still open and the stop-loss for DGLD would have to be moved lower. On the other hand, if gold moves to a stop-loss level but DGLD doesn't, then we will view both positions (in gold and DGLD) as closed. In other words, since it's not possible to be 100% certain that each related instrument moves to a given level when the underlying instrument does, we can't provide levels that would be binding. The levels that we do provide are our best estimate of the levels that will correspond to the levels in the underlying assets, but it will be the underlying assets that one will need to focus on regarding the signs pointing to closing a given position or keeping it open. We might adjust the levels in the "additional instruments" without adjusting the levels in the "main instruments", which will simply mean that we have improved our estimation of these levels, not that we changed our outlook on the markets. We are already working on a tool that would update these levels on a daily basis for the most popular ETFs, ETNs and individual mining stocks.
Our preferred ways to invest in and to trade gold along with the reasoning can be found in the how to buy gold section. Additionally, our preferred ETFs and ETNs can be found in our Gold & Silver ETF Ranking.
As a reminder, Gold & Silver Trading Alerts are posted before or on each trading day (we usually post them before the opening bell, but we don't promise doing that each day). If there's anything urgent, we will send you an additional small alert before posting the main one.
=====
Latest Free Trading Alerts:
Yesterday we wrote about Draghi, so today Powell is our hero. Only one week separates us from the pivotal FOMC meeting. What should gold investors expect?
Will Powell Cut Interest Rates, Triggering Gold Rally?
=====
Thank you.
Sincerely,
Przemyslaw Radomski, CFA
Editor-in-chief, Gold & Silver Fund Manager

