

Briefly: in our opinion, full (200% of the regular size of the position) speculative short positions in gold, silver and mining stocks are justified from the risk/reward perspective at the moment of publishing this alert.
At first sight, yesterday’s session was quite boring – gold ended the session practically unchanged while silver and mining stocks were only a little higher. The USD Index was practically unchanged. But just because nothing happened in the market in terms of the daily closing prices, it doesn’t mean that we don’t have anything interesting to discuss. We do. There is a boomerang topic that just came back once again – the Commitment of Traders report for gold seems to be favoring higher gold prices as the current readings were seen at previous local bottoms. Are we going to see a CoT-driven rally shortly?
We wouldn’t count on that. Before discussing this further, we would like to briefly touch on yesterday’s price changes. It’s true that not much changed, but it’s not true that there are no implications of yesterday’s session. Several interesting things actually happened – silver’s very short-term strength relative to gold and the level that the HUI Index reached both have bearish implications. Let’s start with the relative valuations (chart courtesy of http://stockcharts.com).
Gold’s Intraday Reversal and Silver’s Strength
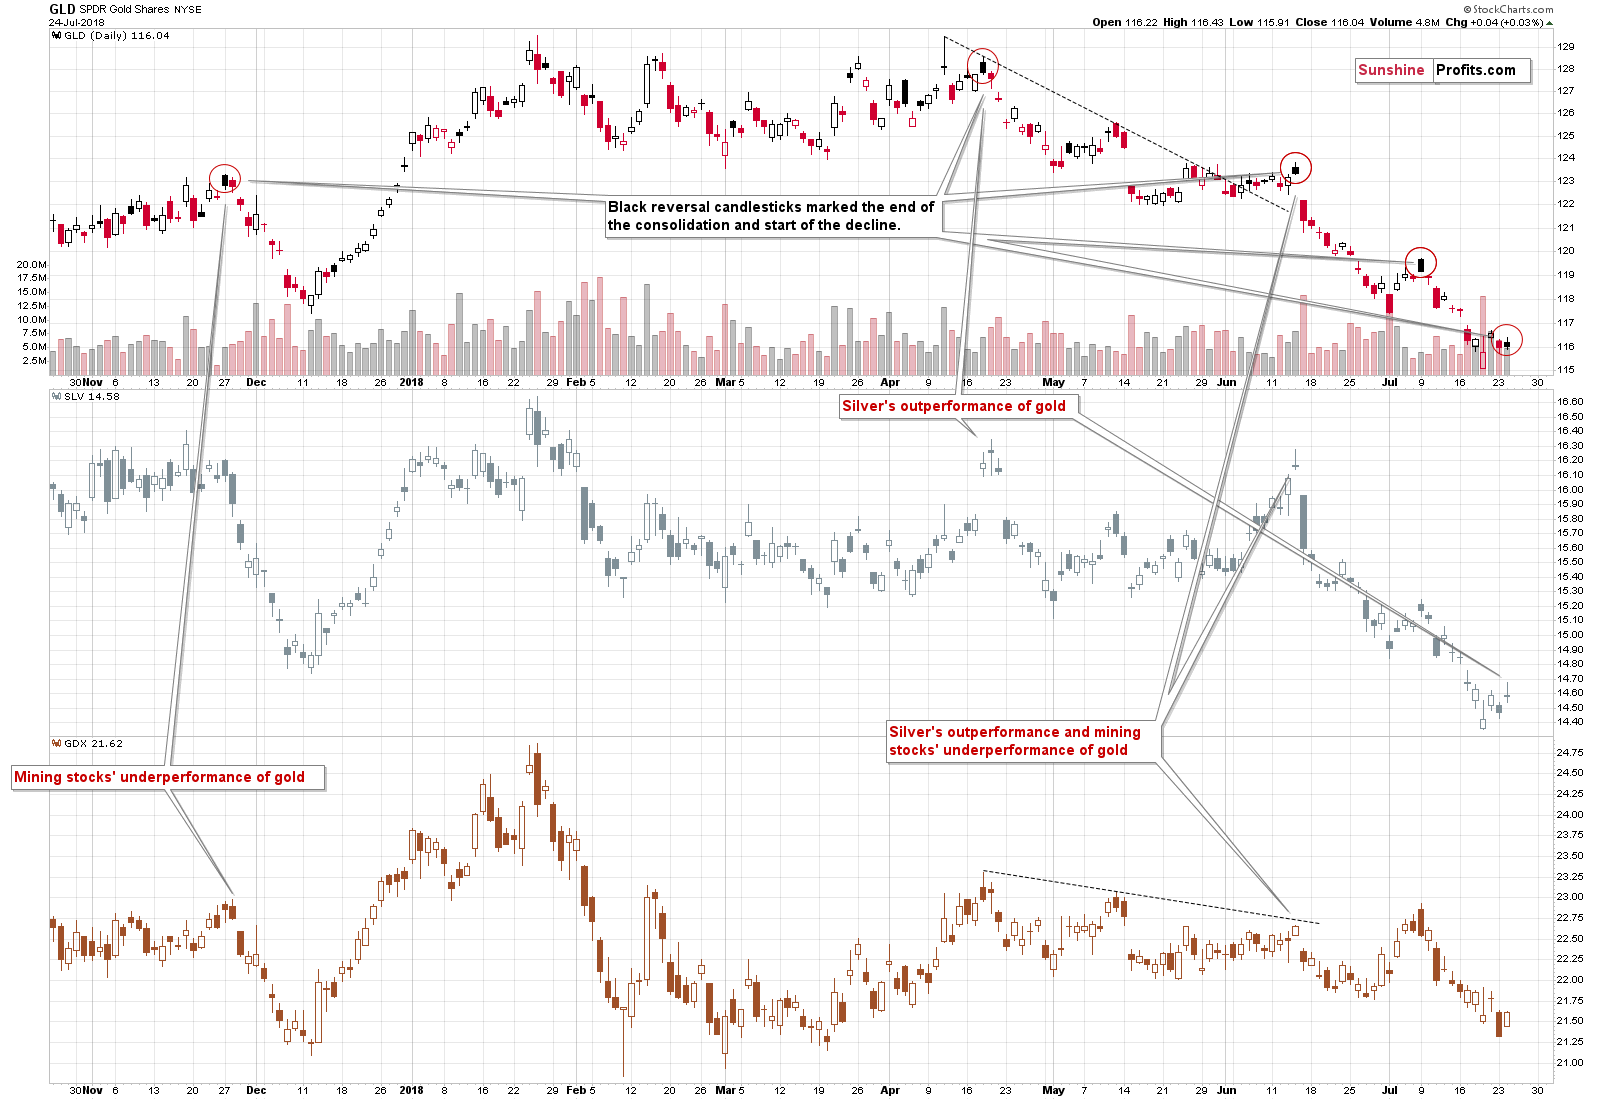
Silver (SLV) outperformed gold (GLD) once again by moving to a new very short-term high, while gold didn’t. There was no new intraday high in the GDX ETF so, silver’s outperformance is quite clear even though it happened on an intraday basis. This is something that indicated local tops several times in the past and it seems quite likely that this is the case right now as well.
The intraday reversal that’s marked with black candlestick in the case of the GLD ETF definitely confirms this scenario. These candlesticks were seen right before the short-term downswings in the recent and more distant past. The implications are definitely bearish.
On a side note, if you were wondering why they are black, not red – it’s how Stockcharts marks the days that are declines in intraday terms (i.e. the closing price is below the opening price), but at the same time are rallies in terms of closing prices (i.e. the daily closing price is above the previous day’s closing price). In other words, it’s a specific kind of a reversal.
The second thing that we would like to discuss regarding yesterday’s session is the price level at which the HUI Index closed it.
Gold Stocks’ Breakdown
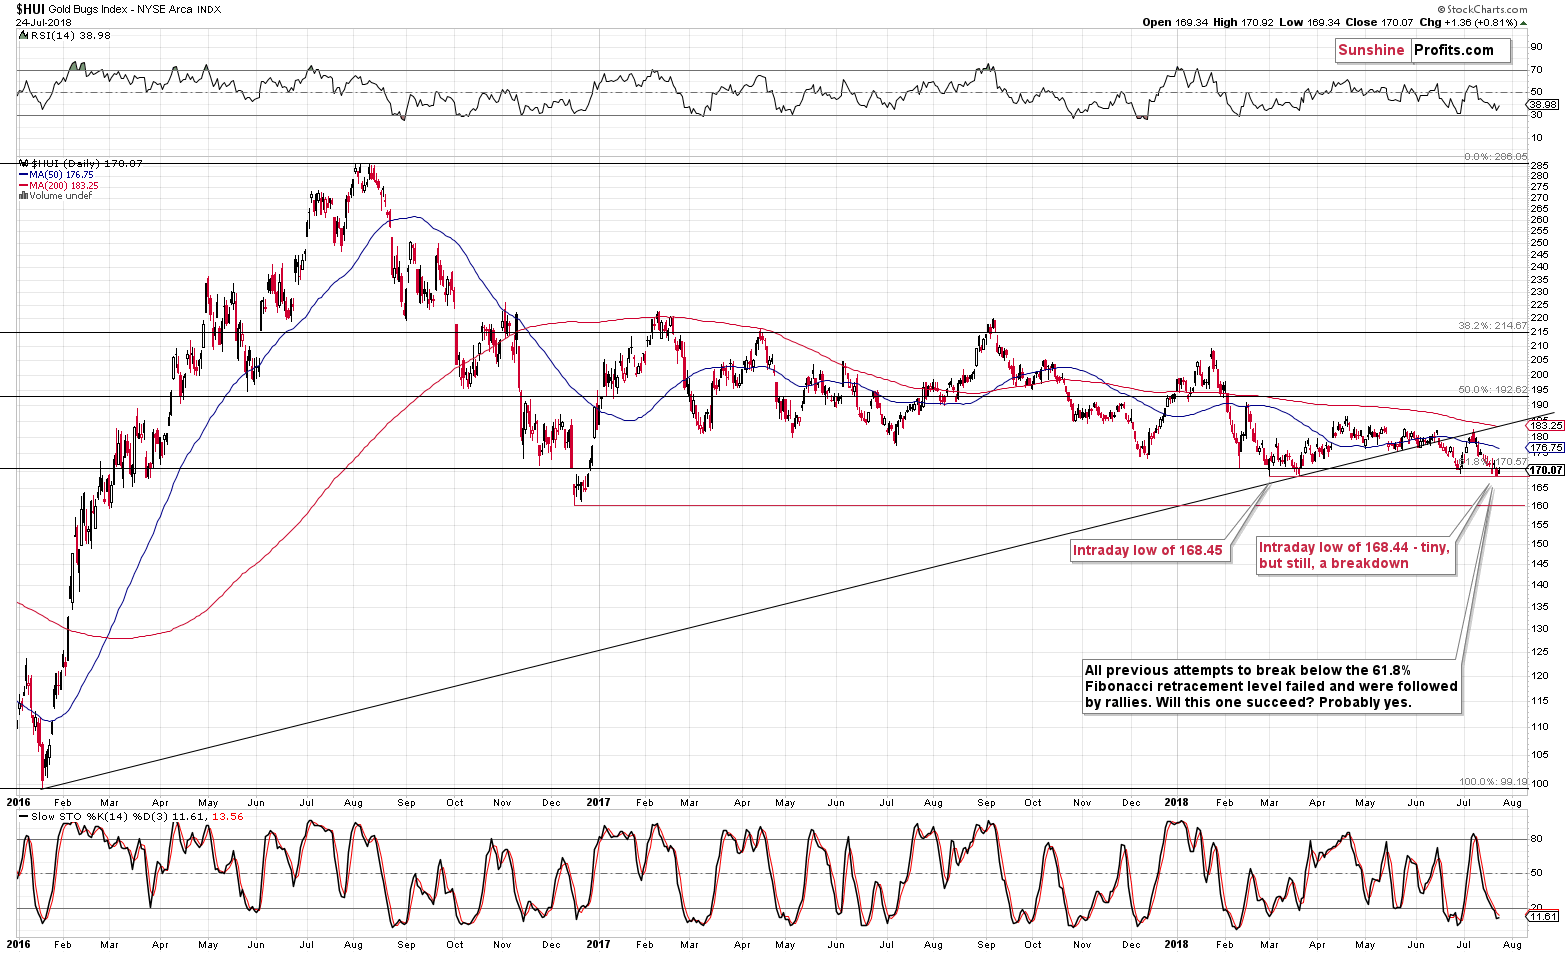
The key thing about yesterday’s upswing is that it didn’t take gold stocks back above the 61.8% Fibonacci retracement level. This means that the breakdown below this important support level was not invalidated. Conversely, it’s being confirmed.
Therefore, the technical situation didn’t improve despite the daily rally and gold stocks are still likely to move lower. The next target is the December 2016 low of 160, but once this level is broken, the real fireworks are likely to start. Just as the HUI soared sharply in early 2016 without a bigger correction, it could dive without bigger corrections in the following months. But, for now, let’s focus on the nearest target – the 160 level.
Having said that, let’s move to the boomerang issue that we would like to discuss more thoroughly – the current supposedly bullish setup in the gold Commitment of Traders report.
CoT Report - Another “Imminent” Bottom
A few months ago – in late March – we discussed the silver CoT as the situation in it was critical (the “large speculator’s” position moved below 0) and was likely to trigger an explosive rally. At least that’s what gold promoters would have you believe. On March 26th, 2018, we wrote that the implications of the signal were unclear and thus that it was not a big deal. Silver’s daily closing price was $16.58. The silver chart that we included in that had a target of about $15.40. We admit, it took longer for this level to be reached than we had originally thought (we made profits on the sideways trading in the meantime, so it was not that bad), but after all, this price level was reached and there was no explosion in the price of silver, or gold.
Since the issue of the CoT reports comes back every now and then it seems useful to quote the entire section that we dedicated to this issue:
Silver CoT – Really Important?
Before moving to mining stocks, we would like to reply to a few questions that we just received. Every now and then we are requested to comment on the CoT reports as they continue to be viewed as a very important tool in determining precious metals prices. Just as often, we explain that in our opinion, the usefulness of these reports is overestimated as there are many other indicators for PM prices that appear more useful in determining the precious metals’ direction, for instance the RSI.
A good indicator should have a trading range that’s rather stable and signals that are followed by similar action. The former is mostly missing, and the latter is not coherent.
Let’s take the silver CoT as an example and let’s use Large Speculators as a proxy for the entire report’s data.
Let’s start with the big picture, so that we can determine the buy and sell zones.
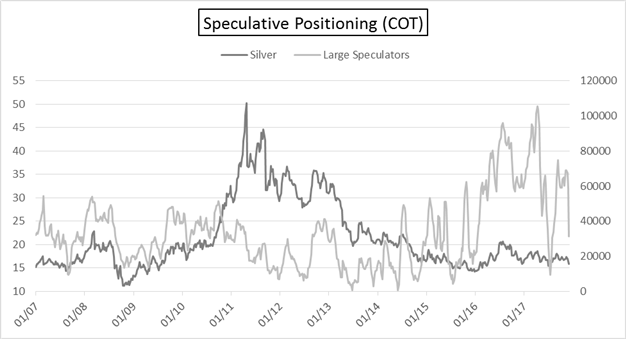
What was the buy zone? Based on the 2007 – 2012 data, one might think that it’s the level of 20,000 contracts as that was when silver’s price reversed. But no – this level didn’t’ stop silver in 2012 and in the following years. So maybe the interesting level was about 5,000 contracts as the 2012 bottoms suggested. Nope – the amount decreased below it in mid-2013 and so did the price of silver. The number finally reached about 0 in 2013. “That must have been the true bottom” – the CoT followers stated. Oops – 5 years later and silver is still well below the level that it reached in mid-2013. It was about $20, so the white metal is currently more than $2 below it.
Before continuing the above discussion of support levels for the number of large speculators’ positions… You know what else is interesting? The large speculators’ position in light of silver’s powerful rally in 2010 and 2011.
In general, if silver’s price goes up, the large speculators’ position goes up. If silver’s price goes down, the large speculators’ position goes down. When the large speculators’ position gets to/above a certain level it, becomes overbought and indicates a downswing and if it gets to/below a certain level, it becomes oversold and indicates an upswing.
Nice and simple, right? The problem is that there is no “certain level” during both up- and downswings. You already read about the difficulty regarding the overbought/support levels in the previous paragraph. The same goes for the overbought/resistance level. The 2016 and 2017 levels were well above the previous maximums and using the previous readings would have generated incorrect signals.
But that’s now that main point. The main point is that the entire link broke down during the biggest upswing of the past decade. The large speculators’ position rallied according to the general “rule” and… More or less in the middle of the upswing, it started to decline. The large speculators’ position became totally useless in predicting the final top for the rally. If that was the case during the key rally of the past decade, then should you really trust this tool when it comes to timing the details of the key decline of the decade? It seems that we are in the early stage of this kind of movement, so should one really bother with looking at the CoT numbers, which could be useful… to a point after which they could provide the opposite of useful signals? The way situation developed in 2010 and 2011 should make you really doubt the CoT numbers’ usefulness in the following months.
Naturally, the entire previous paragraph assumes that the current price regime is different from the previous months’ back-and-forth trading. If only we had seen something suggesting that this situation is different than everything else that we saw in the past 10 years.
Oh wait, we did.
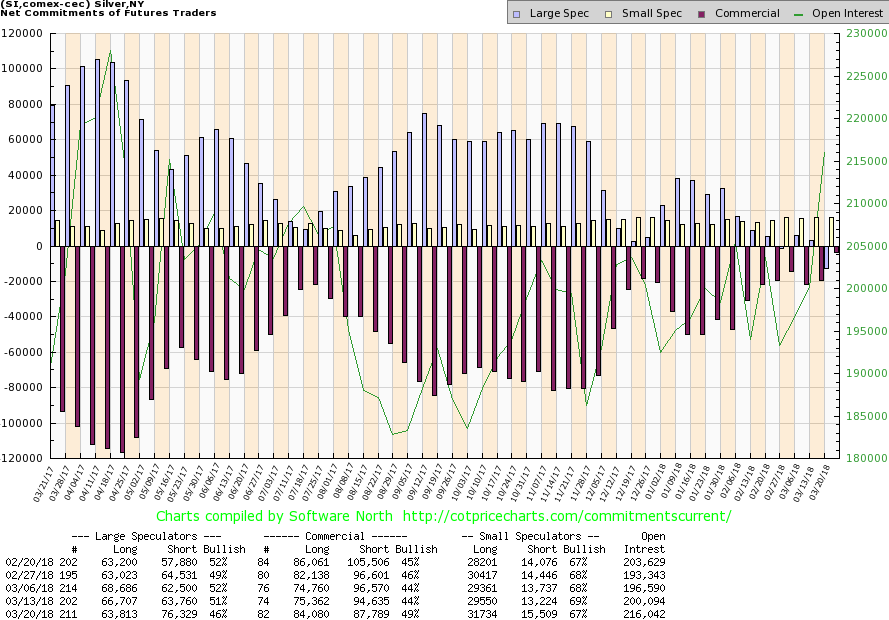
The large speculator’s position just moved below 0, which indicates a new data regime. In other words, we saw a breakdown in the number of positions of large speculators, which suggests that… Well, they will move to a new low – but nobody knows what this low would be. That’s the smaller problem, though.
The bigger problem is that if silver is starting its major – final – decline, then we might not be able to trust the CoT data at all, just like one shouldn’t have trusted it in 2010 and 2011.
Taking both factors into account makes any bullish implications of the above charts rather insignificant at this time.
By the way, did you notice how the analyses that discuss the CoT data are almost always focused on short or (in the best case) medium term? If you feature the big picture, you see how incoherent the implications are and why this tool should be used at best as something that confirms other types of analysis and not on a stand-alone basis.
To be honest, the above paragraph is not entirely correct – the CoT analyses are usually not focused on any charts at all. Long-term CoT charts (like the one that we featured for silver) would put the comments into perspective and it would be clear that they are not that meaningful.
The comments are about a given position in any part of the report that was reached, the differences between them (net position), or about the dynamics (commercials added crazy XYZ to their already huge position!) and they are often accompanied by comments on how big, small, or whatever the position is, or how remarkably fast or slow a given move in the levels of a given position is taking place. Whichever of the above is the case, it is said to be bullish. On one hand, the above may seem strange to those who are new to the precious metals market, and on the other hand, not blindly agreeing that CoT’s are bullish for gold and silver may appear outrageous to those who think that gold will move much higher in the next few years.
This way of thinking is indeed very specific, but is it still analysis? No. It’s an example of confirmation bias a.k.a. wishful thinking.
We actually do think that gold and silver will soar in the coming years, but that doesn’t mean that we’ll say that everything about these markets is bullish. Whenever something is bearish, neutral, or unclear, we’ll call it exactly that. There are tons of factors that currently support lower precious metals prices in the next few months, and we will not just ignore them – we will take advantage of the upcoming slide, make money while precious metals decline (sometimes profiting on the corrective upswings like we did in early July) and then get back in the precious metals market at much lower prices and with much bigger capital.
Why are we discussing all this? Because the positions shown in the gold CoT report are similar to what we saw in July 2017 and December 2017.
Gold’s CoT Signal
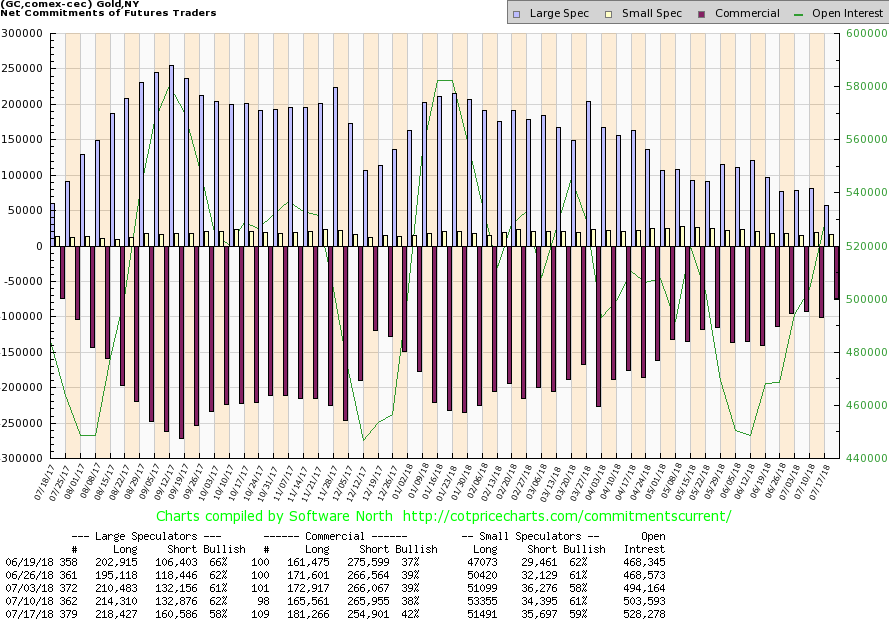
Gold bottomed and rallied in July and December 2017, so the above chart seems bullish for the next few weeks. Naturally, a rally could follow, but it’s not likely to. Both mentioned cases are taken from the time when gold was trading sideways and the odds are that this stage is over. Consequently, the CoT values are not a tool that should be currently applied.
When we wrote about the RSI several days ago we emphasized its usefulness during big rallies and during sideways trading and its uselessness in the case of medium-term declines. If you read that analysis, you probably already know what we’re going to say. If you didn’t read it – we encourage you to do so.
We compared expecting the RSI to be useful during big declines to chopping a tree using a fork. Using CoT reports during big declines may be compared to chopping a tree using a spoon. It’s not the same as the RSI, but it’s in the same ballpark and it’s just as pointless to be using it when trying to take advantage of the big downswings. This goes for both taking advantage of the downswings by betting on lower PM prices and for simply waiting for great buying opportunities.
Both mentioned cases – July 2017 and December 2017 were buying opportunities that were indicated by the RSI indicator. Last week we discussed it in detail how these signals work during upswings and during sideways trading and how they don’t work during declines. It’s the same with the CoT readings. We already quoted a sizable part of our previous analysis above, so we don’t want to put another big quote below, but combining the analysis that we did quote (about silver CoT) and our last week’s discussion of the RSI’s implications during big downswings makes it clear that the current “signal” from gold’s CoT is of very little meaning.
CoTs are very similar to the RSI in terms of usefulness (the RSI being more useful in our view) – especially during sideways trading patterns, but they will likely not be of much help during big declines. And we have one right now.
You can hate it, you can scream “gold manipulation!”, and you can ignore it. But all this won’t change that the CoT report is most likely not going to help you during big moves. It may even give you false signals leading to substantial losses and/or missed opportunities.
Finally, since the above discussion may trigger emotional responses, we think a few things should be emphasized.
Sir Isaac Newton said: Plato is my friend, Aristotle is my friend, but my greatest friend is truth. Paraphrasing the above, we can say: gold is our friend, silver is our friend, but our greatest friend is truth.
We think that both metals will move much higher in the coming years. In particular, we are not perma-bears - we were bullish (in terms of long-term investments) on precious metals for years – until April 2013.
We work for investors, not for gold/silver producers, or gold/silver sellers and our loyalty stays with the former. Therefore, we will not promote gold ownership (except as insurance) when we think that it’s going to move substantially lower and we are doing this for gold and silver investors (so that they can invest at better prices or profit from the decline), not against them. We are the precious metals investors’ true friend – the one that will tell you the harsh truth when things are bad if it’s likely to benefit you, instead of telling you sweet lies that may be pleasant to hear.
Summary
Summing up, the outlook for the precious metals is extremely bearish for the following weeks and months, and it’s not bullish enough for the short term to justify adjusting the current short positions. There are some signs that the corrective upswing is already over, but even if it isn’t then gold’s upside target is still at about $1,240, which means that the potential upside is not worth risking missing out on the following big slide.
The extra-large short positions in gold, silver, and mining stocks are definitely justified from the risk to reward point of view. It’s likely that the profits on the short position that we opened only several days ago will increase much more before this trade is over, even if they correct temporarily first.
As always, we will keep you – our subscribers – informed.
To summarize:
Trading capital (supplementary part of the portfolio; our opinion): Full short positions (200% of the full position) in gold, silver and mining stocks are justified from the risk/reward perspective with the following stop-loss orders and initial target price levels:
- Gold: initial target price: $1,142; stop-loss: $1,272; initial target price for the DGLD ETN: $63.96; stop-loss for the DGLD ETN $46.38
- Silver: initial target price: $14.42; stop-loss: $16.46; initial target price for the DSLV ETN: $32.97; stop-loss for the DSLV ETN $24.07
- Mining stocks (price levels for the GDX ETF): initial target price: $19.12; stop-loss: $23.64; initial target price for the DUST ETF: $37.97; stop-loss for the DUST ETF $20.87
In case one wants to bet on junior mining stocks’ prices (we do not suggest doing so – we think senior mining stocks are more predictable in the case of short-term trades – if one wants to do it anyway, we provide the details), here are the stop-loss details and initial target prices:
- GDXJ ETF: initial target price: $28.10; stop-loss: $34.82
- JDST ETF: initial target price: $74.83 stop-loss: $42.78
Long-term capital (core part of the portfolio; our opinion): No positions (in other words: cash)
Insurance capital (core part of the portfolio; our opinion): Full position
Important Details for New Subscribers
Whether you already subscribed or not, we encourage you to find out how to make the most of our alerts and read our replies to the most common alert-and-gold-trading-related-questions.
Please note that the in the trading section we describe the situation for the day that the alert is posted. In other words, it we are writing about a speculative position, it means that it is up-to-date on the day it was posted. We are also featuring the initial target prices, so that you can decide whether keeping a position on a given day is something that is in tune with your approach (some moves are too small for medium-term traders and some might appear too big for day-traders).
Plus, you might want to read why our stop-loss orders are usually relatively far from the current price.
Please note that a full position doesn’t mean using all of the capital for a given trade. You will find details on our thoughts on gold portfolio structuring in the Key Insights section on our website.
As a reminder – “initial target price” means exactly that – an “initial” one, it’s not a price level at which we suggest closing positions. If this becomes the case (like it did in the previous trade) we will refer to these levels as levels of exit orders (exactly as we’ve done previously). Stop-loss levels, however, are naturally not “initial”, but something that, in our opinion, might be entered as an order.
Since it is impossible to synchronize target prices and stop-loss levels for all the ETFs and ETNs with the main markets that we provide these levels for (gold, silver and mining stocks – the GDX ETF), the stop-loss levels and target prices for other ETNs and ETF (among other: UGLD, DGLD, USLV, DSLV, NUGT, DUST, JNUG, JDST) are provided as supplementary, and not as “final”. This means that if a stop-loss or a target level is reached for any of the “additional instruments” (DGLD for instance), but not for the “main instrument” (gold in this case), we will view positions in both gold and DGLD as still open and the stop-loss for DGLD would have to be moved lower. On the other hand, if gold moves to a stop-loss level but DGLD doesn’t, then we will view both positions (in gold and DGLD) as closed. In other words, since it’s not possible to be 100% certain that each related instrument moves to a given level when the underlying instrument does, we can’t provide levels that would be binding. The levels that we do provide are our best estimate of the levels that will correspond to the levels in the underlying assets, but it will be the underlying assets that one will need to focus on regarding the signs pointing to closing a given position or keeping it open. We might adjust the levels in the “additional instruments” without adjusting the levels in the “main instruments”, which will simply mean that we have improved our estimation of these levels, not that we changed our outlook on the markets. We are already working on a tool that would update these levels on a daily basis for the most popular ETFs, ETNs and individual mining stocks.
Our preferred ways to invest in and to trade gold along with the reasoning can be found in the how to buy gold section. Additionally, our preferred ETFs and ETNs can be found in our Gold & Silver ETF Ranking.
As a reminder, Gold & Silver Trading Alerts are posted before or on each trading day (we usually post them before the opening bell, but we don't promise doing that each day). If there's anything urgent, we will send you an additional small alert before posting the main one.
=====
Hand-picked precious-metals-related links:
PRECIOUS-Gold steadies near 1-year low as dollar slips
China's Plan to Seize a Near-Earth Asteroid Sounds Surprisingly Feasible
Nevada Bill Proposed To Create Yield-Bearing Gold Bond
=====
In other news:
Trump Says U.S., EU Must Cut All Tariffs Ahead of Key Talks
IMF says dollar over-valued, Chinese yuan in line with fundamentals
EU prepares retaliatory tariffs on $20 billion of U.S. goods
Brexit economy: rate rise looms amid signs of slowdown
Oil prices rise after U.S. crude inventories fall
=====
Thank you.
Sincerely,
Przemyslaw Radomski, CFA
Founder, Editor-in-chief, Gold & Silver Fund Manager
Gold & Silver Trading Alerts
Forex Trading Alerts
Oil Investment Updates
Oil Trading Alerts

