

Briefly: In our opinion, full (150% of the regular full position) speculative short positions in gold, silver and mining stocks are justified from the risk/reward perspective at the moment of publishing this alert.
The USD Index started the week with yet another decline, however, this time, precious metals refused to really react to this bullish signal. Gold and miners were unaffected, but silver moved somewhat higher – what can we infer from these moves?
In short, the lack of reaction from gold and miners is a bearish sign and silver’s very short-term outperformance is something that we see at the tops quite often, so this also supports the bearish outlook. Silver had been the only part of the precious metals market (taking gold, silver and miners into account here) that hadn’t reached its important resistance level, and since it did reach it yesterday, the top could be indeed in.
Since the charts for gold and mining stocks didn’t change (the implications are just as we described them yesterday), in today’s alert we focus on silver and the USD Index. We also briefly discuss a similarity to what happened last year in mining stocks.
Let’s start with the USD Index chart (chart courtesy of http://stockcharts.com).
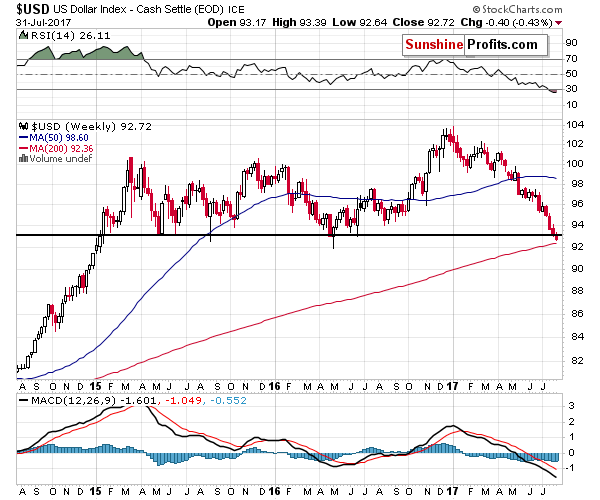
In yesterday’s alert, we wrote the following:
The USD Index closed the week in tune with the 2015 and 2016 bottoms. Both previous bottoms took place close to the middle of the year, so the timing for the current move lower also supports that reversal theory.
The USD Index reached the previous weekly bottoms and it suggests that the bottom is in – in weekly terms. In other words, this week’s closing price is very likely to be higher than 93.11. What the above does not say is how the USD Index will perform before the end of the week – even if we saw a temporary downswing to about 92 and then a big comeback (just like the one we saw in 2016 after the weekly bottom), it would still not invalidate the bullish implications or the analogy in general.
Yesterday’s decline is quite in tune with the above – it doesn’t invalidate the bullish implications of last week’s close more or less at the long-term support. The USD Index is therefore still likely to reverse before the end of the week.
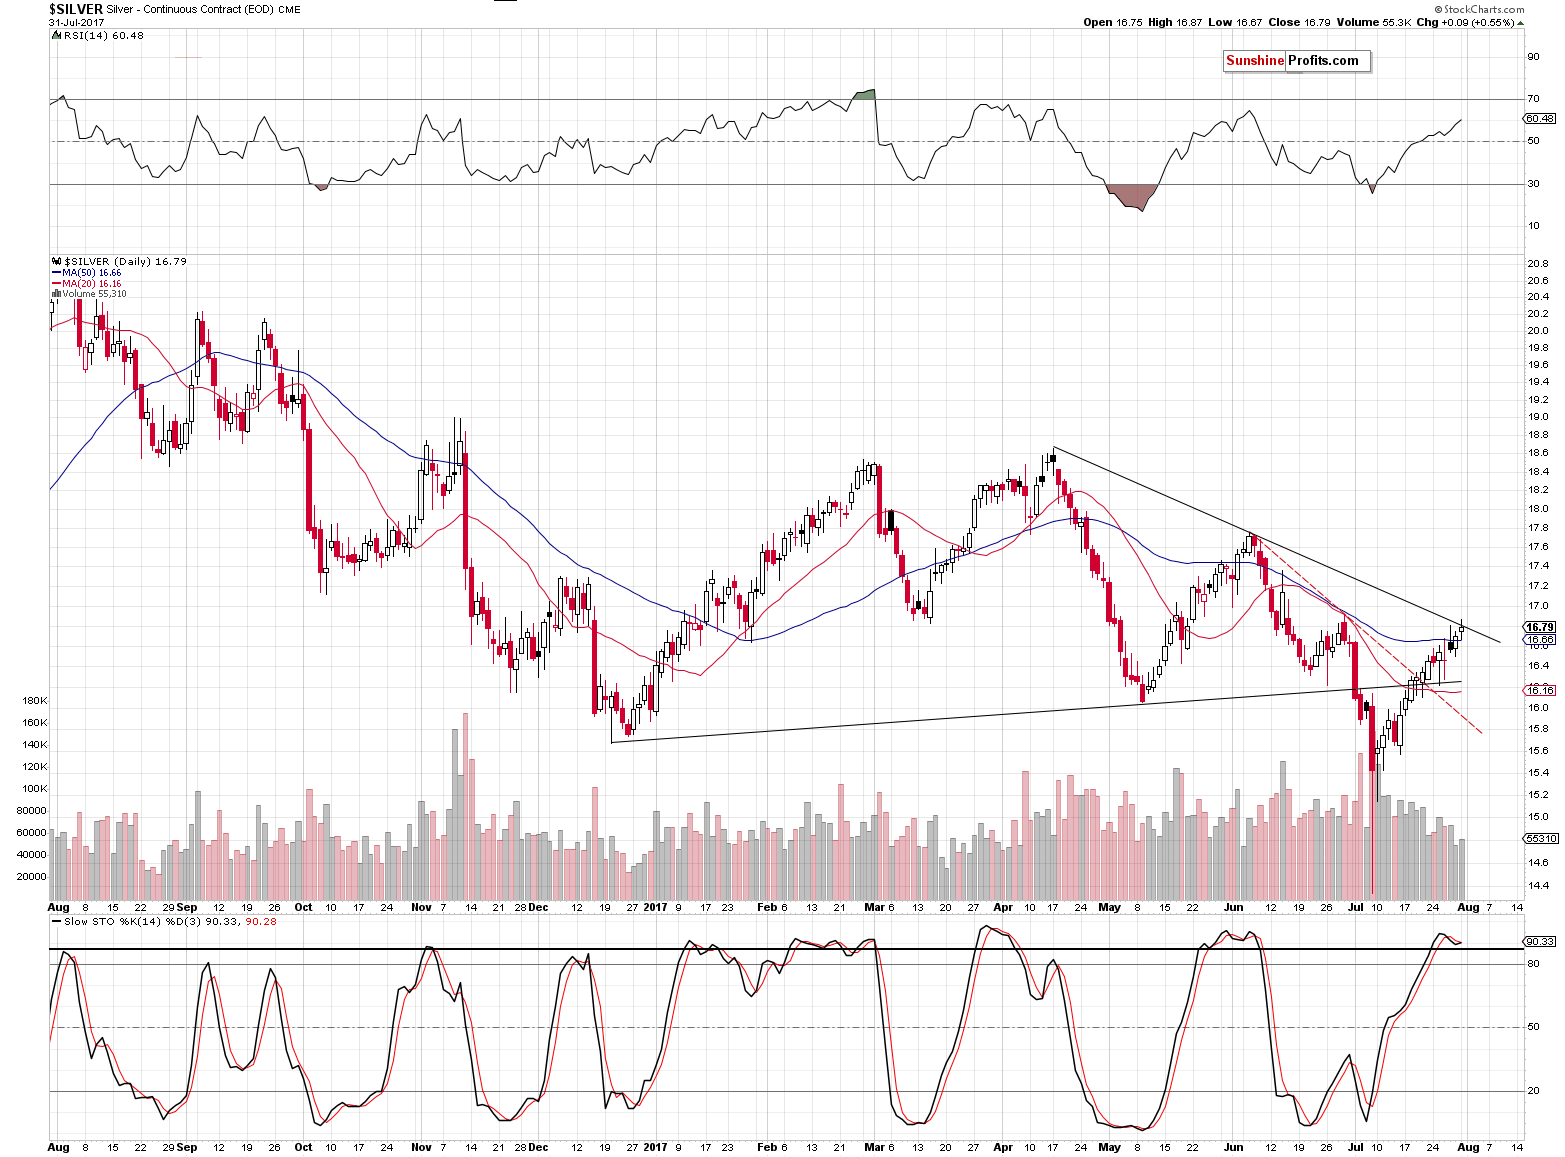
As far as silver is concerned, we wrote the following:
Silver also has some room tom move higher – to about $16.80 or so. The volume was very low during Friday’s upswing and please note that we saw the same thing in early June – that was one day before the top.
We certainly could be one or two days away from the top, especially that the bearish implications of the looming turning point remain in place.
Again, what happened yesterday is quite in tune with the above comments. Silver closed the session at $16.79 – practically right at the declining resistance line. There was no breakout, so there were no technical changes.
The comments on silver’s turning point remain up-to-date as well and so do its implications:
Namely, silver’s turning point is just around the corner and in all three previous cases, the major top (followed by a sharp decline) was seen right before the turning point. Consequently, seeing a top shortly appears very likely.
There’s also an interesting analogy in the case of the recent mining stocks performance.
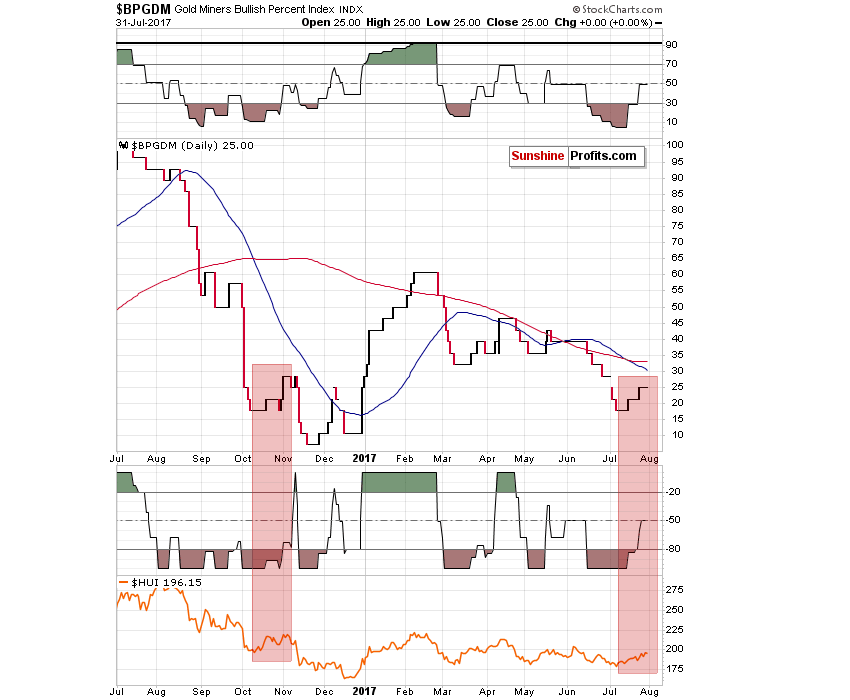
The Gold Miners’ Bullish Percent Index moved higher after a decline slightly below 20 and its been about 2 weeks since the small upswing began. Something very similar in October 2016 meant that the corrective rally was already over. It took two additional months for the final bottom for the 2016 decline to materialize.
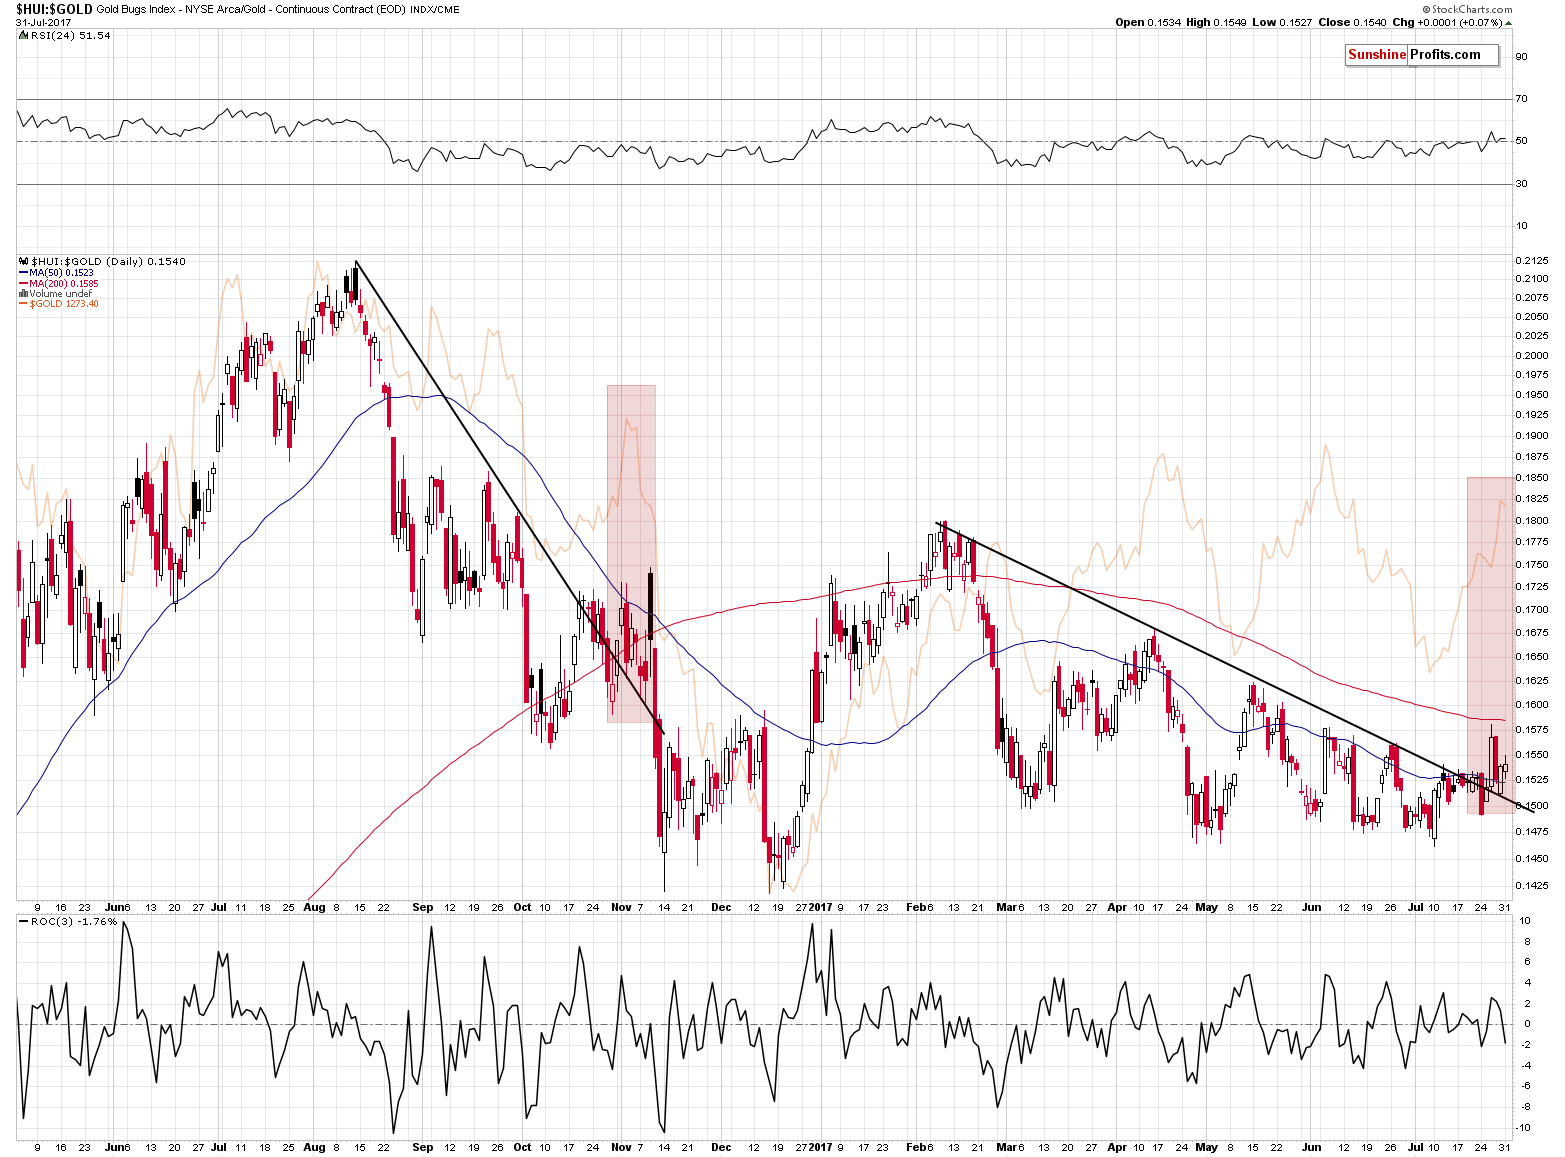
Interestingly, the analogy to the same period is also present in the case of the gold stocks to gold ratio. We’ve seen a small breakout above the declining resistance line. At the end of October / beginning of November 2016, such an upswing was what happened when gold topped and started a $150+ decline.
The above analogy is not a strong factor at this time, as it’s just one similar situation that we are discussing here, but it serves as a confirmation of other signals such as gold’s and miners’ unwillingness to rally yesterday despite a daily slide in the USD Index.
Summing up, one of the most important downside targets for the USD Index was reached on a weekly basis and the upside targets for gold and silver were reached (silver’s target was reached yesterday) and this, combined with the confirmed (not invalidated) breakdowns in gold in terms of currencies other than the U.S. dollar, silver’s turning point and the resistance levels reached in mining stocks, paints a bearish picture for the precious metals sector for the following weeks. The medium-term outlook remains bearish and any strength here – if we see it at all – is likely to be only temporary.
As always, we will keep you – our subscribers – informed.
To summarize:
Trading capital (supplementary part of the portfolio; our opinion): Short positions (150% of the full position) in gold, silver and mining stocks are justified from the risk/reward perspective with the following stop-loss orders and initial target price levels / profit-take orders:
- Gold: initial target price level: $1,063; stop-loss: $1,317; initial target price for the DGLD ETN: $81.88; stop-loss for the DGLD ETN $44.57
- Silver: initial target price: $13.12; stop-loss: $19.22; initial target price for the DSLV ETN: $46.18; stop-loss for the DSLV ETN $17.93
- Mining stocks (price levels for the GDX ETF): initial target price: $9.34; stop-loss: $26.34; initial target price for the DUST ETF: $143.56; stop-loss for the DUST ETF $21.37
In case one wants to bet on junior mining stocks' prices (we do not suggest doing so – we think senior mining stocks are more predictable in the case of short-term trades – if one wants to do it anyway, we provide the details), here are the stop-loss details and initial target prices:
- GDXJ ETF: initial target price: $14.13; stop-loss: $45.31
- JDST ETF: initial target price: $417.04; stop-loss: $43.12
Long-term capital (core part of the portfolio; our opinion): No positions (in other words: cash)
Insurance capital (core part of the portfolio; our opinion): Full position
Important Details for New Subscribers
Whether you already subscribed or not, we encourage you to find out how to make the most of our alerts and read our replies to the most common alert-and-gold-trading-related-questions.
Please note that the in the trading section we describe the situation for the day that the alert is posted. In other words, it we are writing about a speculative position, it means that it is up-to-date on the day it was posted. We are also featuring the initial target prices, so that you can decide whether keeping a position on a given day is something that is in tune with your approach (some moves are too small for medium-term traders and some might appear too big for day-traders).
Plus, you might want to read why our stop-loss orders are usually relatively far from the current price.
Please note that a full position doesn’t mean using all of the capital for a given trade. You will find details on our thoughts on gold portfolio structuring in the Key Insights section on our website.
As a reminder – “initial target price” means exactly that – an “initial” one, it’s not a price level at which we suggest closing positions. If this becomes the case (like it did in the previous trade) we will refer to these levels as levels of exit orders (exactly as we’ve done previously). Stop-loss levels, however, are naturally not “initial”, but something that, in our opinion, might be entered as an order.
Since it is impossible to synchronize target prices and stop-loss levels for all the ETFs and ETNs with the main markets that we provide these levels for (gold, silver and mining stocks – the GDX ETF), the stop-loss levels and target prices for other ETNs and ETF (among other: UGLD, DGLD, USLV, DSLV, NUGT, DUST, JNUG, JDST) are provided as supplementary, and not as “final”. This means that if a stop-loss or a target level is reached for any of the “additional instruments” (DGLD for instance), but not for the “main instrument” (gold in this case), we will view positions in both gold and DGLD as still open and the stop-loss for DGLD would have to be moved lower. On the other hand, if gold moves to a stop-loss level but DGLD doesn’t, then we will view both positions (in gold and DGLD) as closed. In other words, since it’s not possible to be 100% certain that each related instrument moves to a given level when the underlying instrument does, we can’t provide levels that would be binding. The levels that we do provide are our best estimate of the levels that will correspond to the levels in the underlying assets, but it will be the underlying assets that one will need to focus on regarding the signs pointing to closing a given position or keeping it open. We might adjust the levels in the “additional instruments” without adjusting the levels in the “main instruments”, which will simply mean that we have improved our estimation of these levels, not that we changed our outlook on the markets. We are already working on a tool that would update these levels on a daily basis for the most popular ETFs, ETNs and individual mining stocks.
Our preferred ways to invest in and to trade gold along with the reasoning can be found in the how to buy gold section. Additionally, our preferred ETFs and ETNs can be found in our Gold & Silver ETF Ranking.
As a reminder, Gold & Silver Trading Alerts are posted before or on each trading day (we usually post them before the opening bell, but we don't promise doing that each day). If there's anything urgent, we will send you an additional small alert before posting the main one.
=====
Latest Free Trading Alerts:
The political turmoil in the Trump administration continues. What does it mean for the gold market?
Trump, Scaramucci, Kelly and Gold
On Friday, crude oil moved higher and hit a July peak supported by a weakening U.S. dollar and bullish Wednesday’s EIA weekly report. As a result, the black gold climbed above the 200-day moving average, but is it enough to trigger a rally above $50?
=====
Hand-picked precious-metals-related links:
PRECIOUS-Gold dips on profit taking after touching 7-week high
Gold gains in Asia as China Caixin manufacturing PMI gains
UPDATE 1-LBMA shines a light on the gold in London's vaults
Barrick Gold, Tanzania begin talks to resolve Acacia Mining dispute
=====
In other news:
North Korea can hit most of United States: U.S. officials
Euro-Area Economy Steams Ahead as ECB Waits for Inflation
No Bubble in Stocks But Look Out When Bonds Pop, Greenspan Says
Slow economic growth is not the new normal, it's the old norm
Australia's central bank keeps policy rate, says local currency's strength to weigh on growth
Bitcoin Cash Begins Trading Tuesday; It's a Crucial Moment: Market Recon
A new digital currency is about to be created as the bitcoin blockchain is forced to split in two
Your Money, But Not Your Money: Eu Wants To Freeze Accounts
Former Greek statistics chief found guilty of breach of duty
=====
Thank you.
Sincerely,
Przemyslaw Radomski, CFA
Founder, Editor-in-chief, Gold & Silver Fund Manager
Gold & Silver Trading Alerts
Forex Trading Alerts
Oil Investment Updates
Oil Trading Alerts

