

Briefly: In our opinion, full (150% of the regular full position) speculative short positions in gold, silver and mining stocks are justified from the risk/reward perspective at the moment of publishing this alert.
Gold, silver and mining stocks soared yesterday as the USD Index moved to new 2017 lows. In today’s pre-market trading the USD Index even moved below the 2016 low. What does the breakdown in USD mean and what does strongly rallying gold indicate? Is this the final part of the move or just a start of a bigger price swing?
Let’s start today’s alert with a quote from yesterday’s second alert:
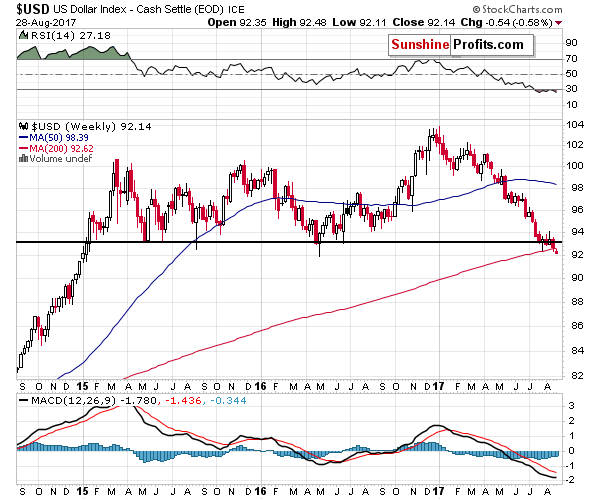
What about the USD Index? It’s below its major support level that’s based on the weekly closing prices. Consequently, even though the USD Index moved lower, it’s still likely to move back above it before the end of the week, thus forming a major reversal. As far as the intraday support is concerned, the lowest intraday price of the recent years was seen on May 3rd, 2016 at 91.88. Today’s intraday low for the USD Index is 92.251 - still above the above-mentioned low. The USD Index has NOT broken below the intraday low in intraday terms and below the weekly low in terms of weekly closing prices. There was no major breakdown and thus a reversal and a rally are likely to be seen this week.
Let’s take a look at the USD Index charts (chart courtesy of http://stockcharts.com).
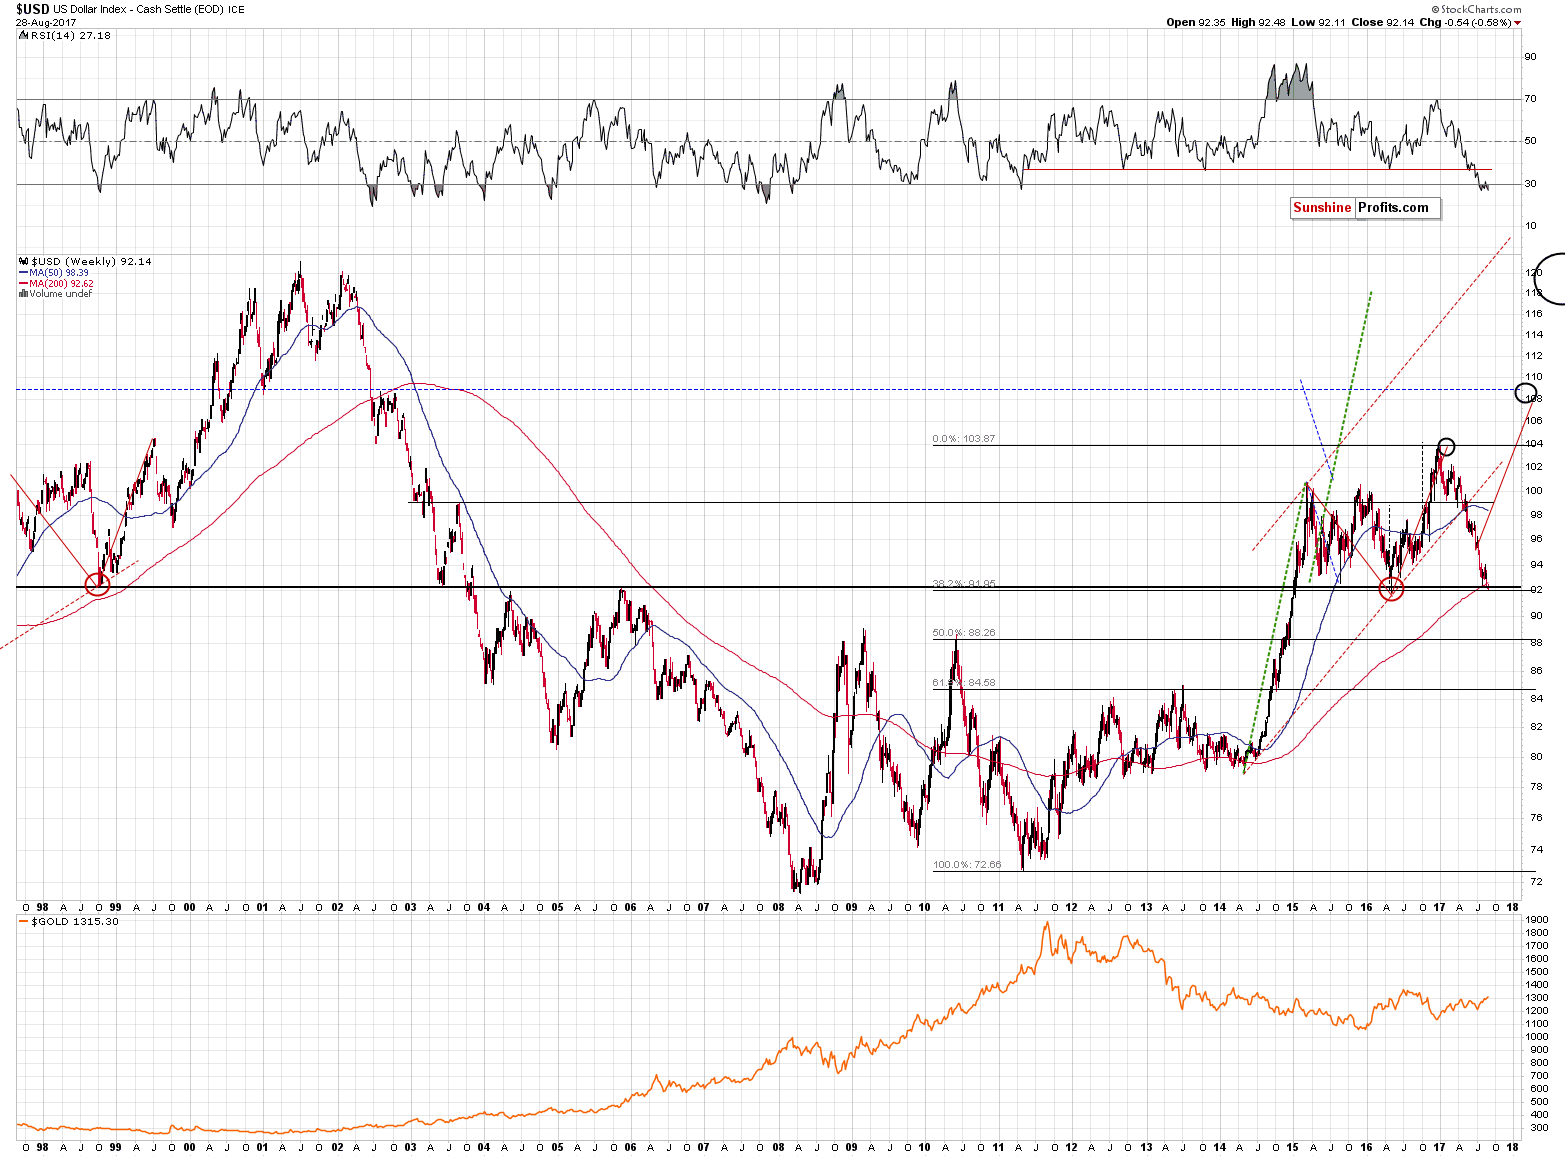
What we wrote yesterday, remains up-to-date and the thing that we can add now – based on today’s pre-market prices is that the 2016 low has just been reached. Earlier today, the USD Index moved to 91.621 and moved a bit higher shortly thereafter. Consequently, the key bottom of the recent years – the intraday 2016 bottom – was just reached (even breached, but it seems to be temporary phenomenon). At the same time the USD Index moved to the 38.2% Fibonacci retracement level based on the entire 2011 – 2017 rally. If there’s an important combination of support levels that’s likely to stop the decline – that’s it.
Profound reversal in the USD Index is likely to translate into a powerful reversal in gold and the rest of the precious metals market.
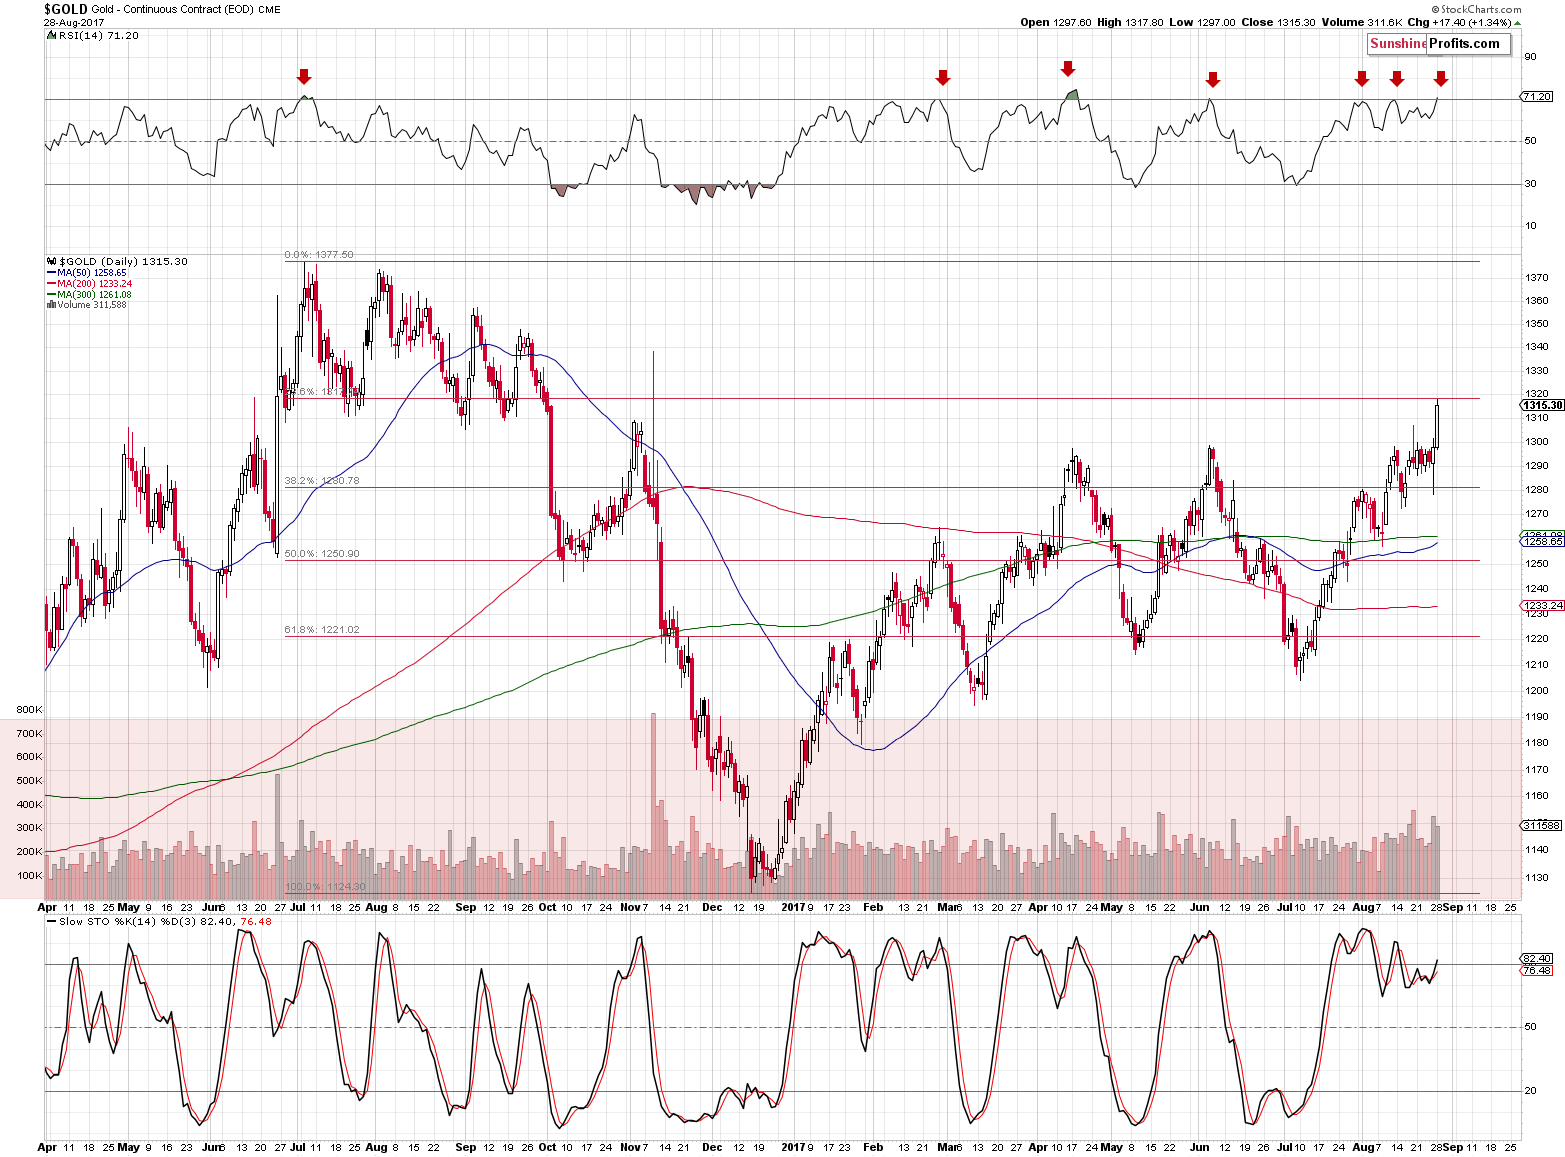
Gold finally responded to USD’s weakness (it’s trading close to $1,320 at the moment of writing these words) and moved to its 76.4% Fibonacci retracement – a little less important than the classic ones, but still something worth keeping in mind. What’s more important, is the fact that the RSI indicator moved above the 70 level, which is a classic sell signal. We marked the previous cases with red arrows on the above chart and the efficiency of this signal was particularly high.
In case of the GLD ETF, we saw a price gap (the ETF opened above the previous session’s closing price), but since that was the case multiple times in the past and was followed by: rallies, declines and consolidations, it doesn’t seem that it implies anything going forward.
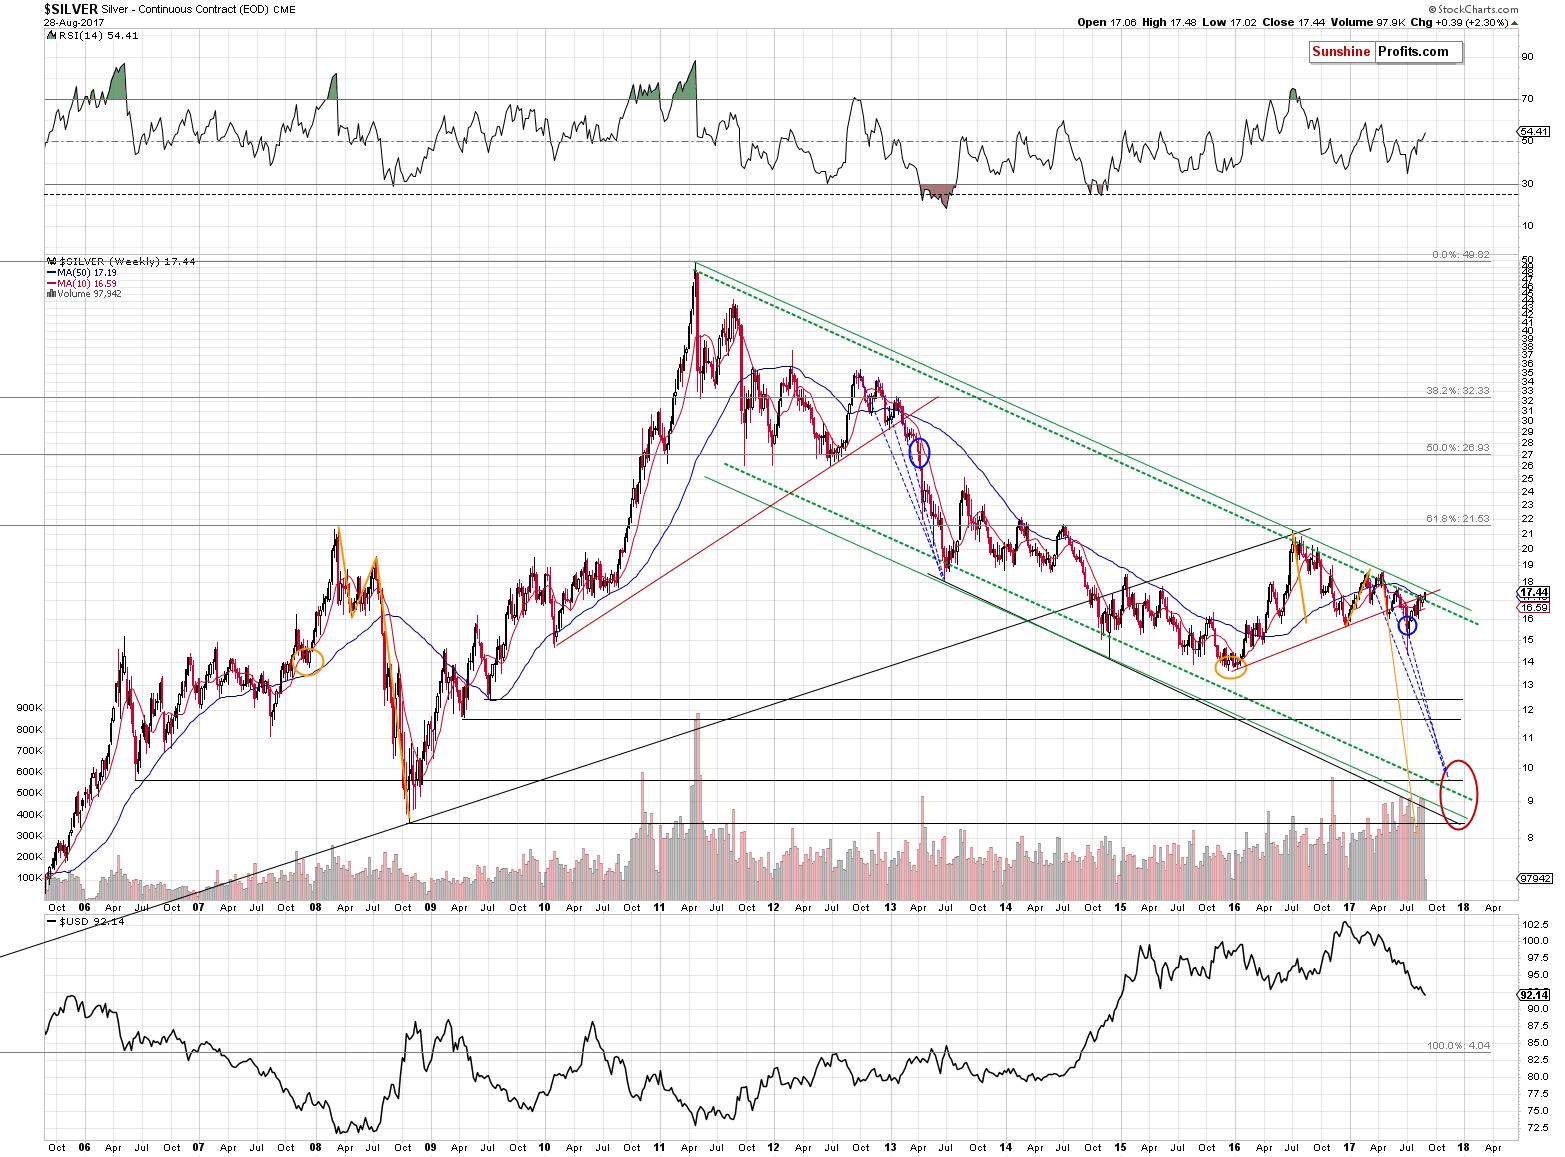
Silver moved above the dashed, green line and close to the solid green line, without breaking it. The dashed line is based on the weekly closing prices, while the solid line is based on the intraday highs. The line based on the intraday highs is still likely to trigger a reversal even though silver moved above the dashed one. The week has just begun and silver has several days to move back and invalidate the so-far-inconsequential breakout – just like what we see in the USD Index.
In yesterday’s second alert, we wrote the following:
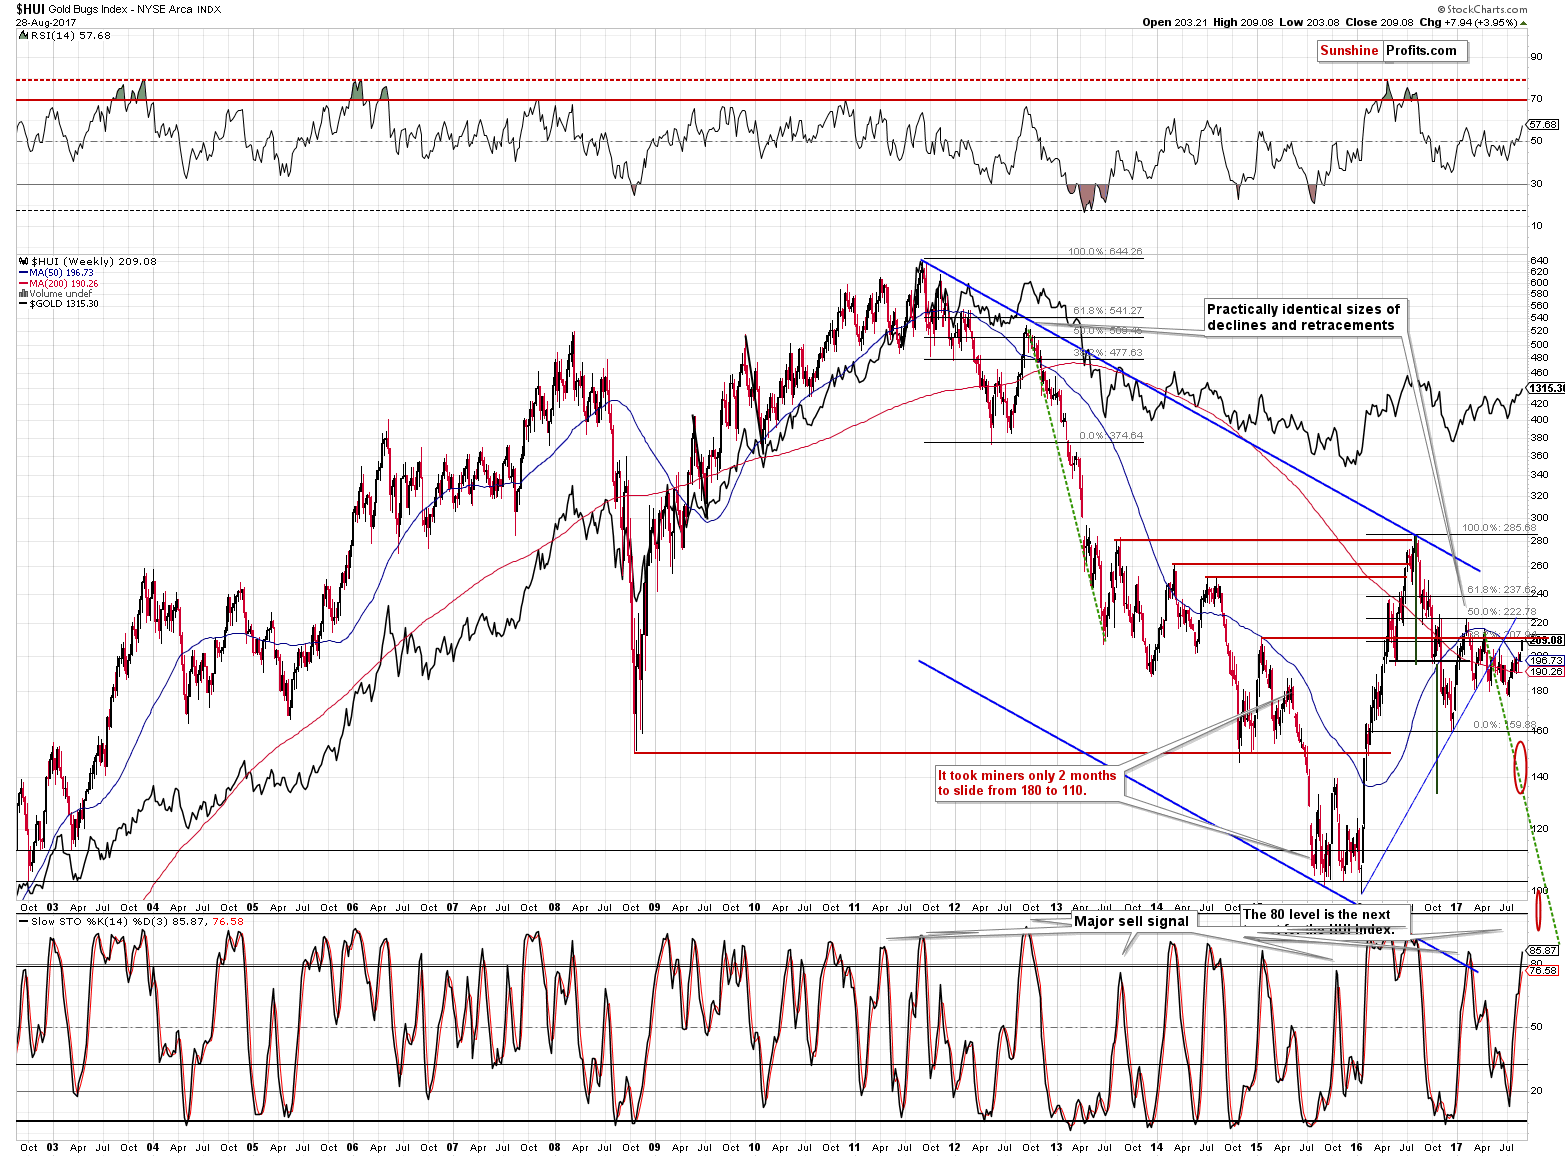
Still, the gold stocks are moving visibly higher today and even though gold’s and silver’s response to USD’s decline is limited, the move in miners is significant - is this a sign of strength? Relative to gold - it is, but if we compare it to the move in the USD, we can say that the reaction is simply normal - which is not bullish nor bearish (unless we would be expecting the USD to slide that is). The first classic Fibonacci retracement level based on the major 2016 top and the late 2016 bottom in the HUI Index is at about 208, which is exactly the level that the gold stocks reached today. Will this be enough to stop the rally? We’ll have more to say once we get today’s closing prices and volume levels, but it could be the case - or the top is at hand - given the situation in the USD Index.
The volume levels for the GDX ETF were significant (more on that in a minute), but the price levels that gold stocks reached were still quite in tune with what we wrote above – the HUI closed at 209 – very close to the above-mentioned Fibonacci retracement level and the 2015 high. Will gold stocks rally shortly? They could rally a bit, but they have a very good reasons to decline in the form of its resistance level, gold’s RSI at 70 and the USD Index at the most important support level of the past few years.
Moving back to the volume analysis, please note that it was exceptionally high in the final parts of the rally and the latter used to end in a way that’s similar to yesterday’s session – a big daily upswing on big volume that should theoretically be a strong bullish sign.
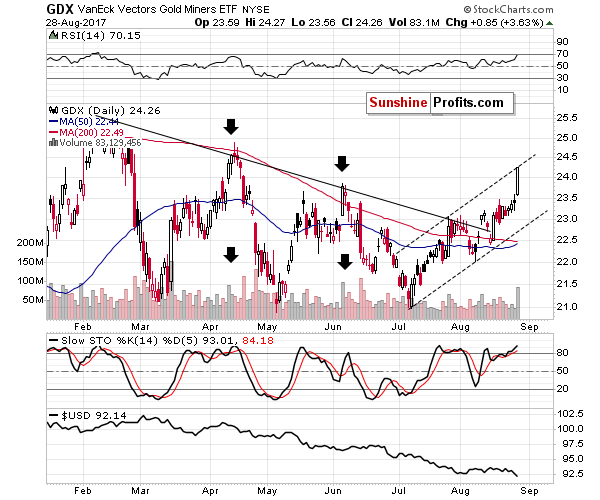
Interestingly, both previous cases (marked with black arrows) were preceded by a price gap, just like yesterday’s session.
Moreover, compared to other stocks, miners have become very overbought.
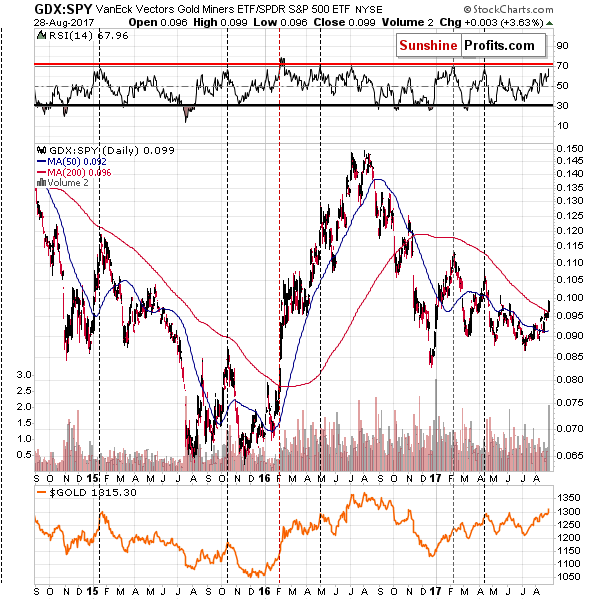
The RSI based on the GDX to SPY ratio illustrates the relative performance of mining stocks and its sharpness. The latter reached extreme as the RSI moved close to the 70 level. We marked similar situations with vertical, dashed lines and in almost all recent cases (note the gold price performance in the lower part of the chart) much lower prices followed.
Summing up, things got hot and – based on the price swings, size of the volume, and the level that was broken in case of the USD Index – very emotional this week, and it’s particularly important to keep calm in such times. The implications thereof that are of greatest important for us are for the precious metals market, but the key action is taking place in the USD Index. If it confirms the breakdown below its long-term support, the big slide in the precious metals market could be delayed once again. For now, this doesn’t appear to be the likely outcome – the reversal is. For now, the outlook remains bearish.
We are moving the stop-loss for gold higher, but not much higher (in case of the positions that were closed automatically overnight, it seems that re-entering them would be justified).
As always, we will keep you – our subscribers – informed.
To summarize:
Trading capital (supplementary part of the portfolio; our opinion): Short positions (150% of the full position) in gold, silver and mining stocks are justified from the risk/reward perspective with the following stop-loss orders and initial target price levels / profit-take orders:
- Gold: initial target price level: $1,063; stop-loss: $1,346; initial target price for the DGLD ETN: $81.88; stop-loss for the DGLD ETN $39.94
- Silver: initial target price: $13.12; stop-loss: $19.22; initial target price for the DSLV ETN: $46.18; stop-loss for the DSLV ETN $17.93
- Mining stocks (price levels for the GDX ETF): initial target price: $9.34; stop-loss: $26.34; initial target price for the DUST ETF: $143.56; stop-loss for the DUST ETF $21.37
In case one wants to bet on junior mining stocks' prices (we do not suggest doing so – we think senior mining stocks are more predictable in the case of short-term trades – if one wants to do it anyway, we provide the details), here are the stop-loss details and initial target prices:
- GDXJ ETF: initial target price: $14.13; stop-loss: $45.31
- JDST ETF: initial target price: $417.04; stop-loss: $43.12
Long-term capital (core part of the portfolio; our opinion): No positions (in other words: cash)
Insurance capital (core part of the portfolio; our opinion): Full position
Important Details for New Subscribers
Whether you already subscribed or not, we encourage you to find out how to make the most of our alerts and read our replies to the most common alert-and-gold-trading-related-questions.
Please note that the in the trading section we describe the situation for the day that the alert is posted. In other words, it we are writing about a speculative position, it means that it is up-to-date on the day it was posted. We are also featuring the initial target prices, so that you can decide whether keeping a position on a given day is something that is in tune with your approach (some moves are too small for medium-term traders and some might appear too big for day-traders).
Plus, you might want to read why our stop-loss orders are usually relatively far from the current price.
Please note that a full position doesn’t mean using all of the capital for a given trade. You will find details on our thoughts on gold portfolio structuring in the Key Insights section on our website.
As a reminder – “initial target price” means exactly that – an “initial” one, it’s not a price level at which we suggest closing positions. If this becomes the case (like it did in the previous trade) we will refer to these levels as levels of exit orders (exactly as we’ve done previously). Stop-loss levels, however, are naturally not “initial”, but something that, in our opinion, might be entered as an order.
Since it is impossible to synchronize target prices and stop-loss levels for all the ETFs and ETNs with the main markets that we provide these levels for (gold, silver and mining stocks – the GDX ETF), the stop-loss levels and target prices for other ETNs and ETF (among other: UGLD, DGLD, USLV, DSLV, NUGT, DUST, JNUG, JDST) are provided as supplementary, and not as “final”. This means that if a stop-loss or a target level is reached for any of the “additional instruments” (DGLD for instance), but not for the “main instrument” (gold in this case), we will view positions in both gold and DGLD as still open and the stop-loss for DGLD would have to be moved lower. On the other hand, if gold moves to a stop-loss level but DGLD doesn’t, then we will view both positions (in gold and DGLD) as closed. In other words, since it’s not possible to be 100% certain that each related instrument moves to a given level when the underlying instrument does, we can’t provide levels that would be binding. The levels that we do provide are our best estimate of the levels that will correspond to the levels in the underlying assets, but it will be the underlying assets that one will need to focus on regarding the signs pointing to closing a given position or keeping it open. We might adjust the levels in the “additional instruments” without adjusting the levels in the “main instruments”, which will simply mean that we have improved our estimation of these levels, not that we changed our outlook on the markets. We are already working on a tool that would update these levels on a daily basis for the most popular ETFs, ETNs and individual mining stocks.
Our preferred ways to invest in and to trade gold along with the reasoning can be found in the how to buy gold section. Additionally, our preferred ETFs and ETNs can be found in our Gold & Silver ETF Ranking.
As a reminder, Gold & Silver Trading Alerts are posted before or on each trading day (we usually post them before the opening bell, but we don't promise doing that each day). If there's anything urgent, we will send you an additional small alert before posting the main one.
=====
Latest Free Trading Alerts:
In August, the New York Fed released a new update on household debt today showing record levels. What does it imply for the gold market?
New Peak in Household Debt and Gold
On Friday, the euro moved sharply higher against the greenback, which resulted in a climb to a new 2017 high. Earlier today, EUR/USD hit a fresh peak, but will we see further improvement in the coming week?
Will EUR/USD Climb Any Further?
=====
Hand-picked precious-metals-related links:
Gold Climbs as North Korea Missile Test Sees Price at 2017 High
ICE to take over London silver benchmark on Sept. 25
The Hot Stock: Newmont Mining Climbs 3.5%
=====
In other news:
European Stocks Slump on Double Whammy of North Korea, Euro Gain
Investors see scant chance of ECB rate hike over next year
Key flood insurance underwriter sinks further into debt as Harvey slams Texas
Debt ceiling showdown, conservatives at odds on conditions for deal
India launches world's first diamond futures exchange
Oil prices dip as market grapples with hurricane damage
=====
Thank you.
Sincerely,
Przemyslaw Radomski, CFA
Founder, Editor-in-chief, Gold & Silver Fund Manager
Gold & Silver Trading Alerts
Forex Trading Alerts
Oil Investment Updates
Oil Trading Alerts

