

On Friday, the euro moved sharply higher against the greenback, which resulted in a climb to a new 2017 high. Earlier today, EUR/USD hit a fresh peak, but will we see further improvement in the coming week?
EUR/USD
On Thursday, we wrote the following:
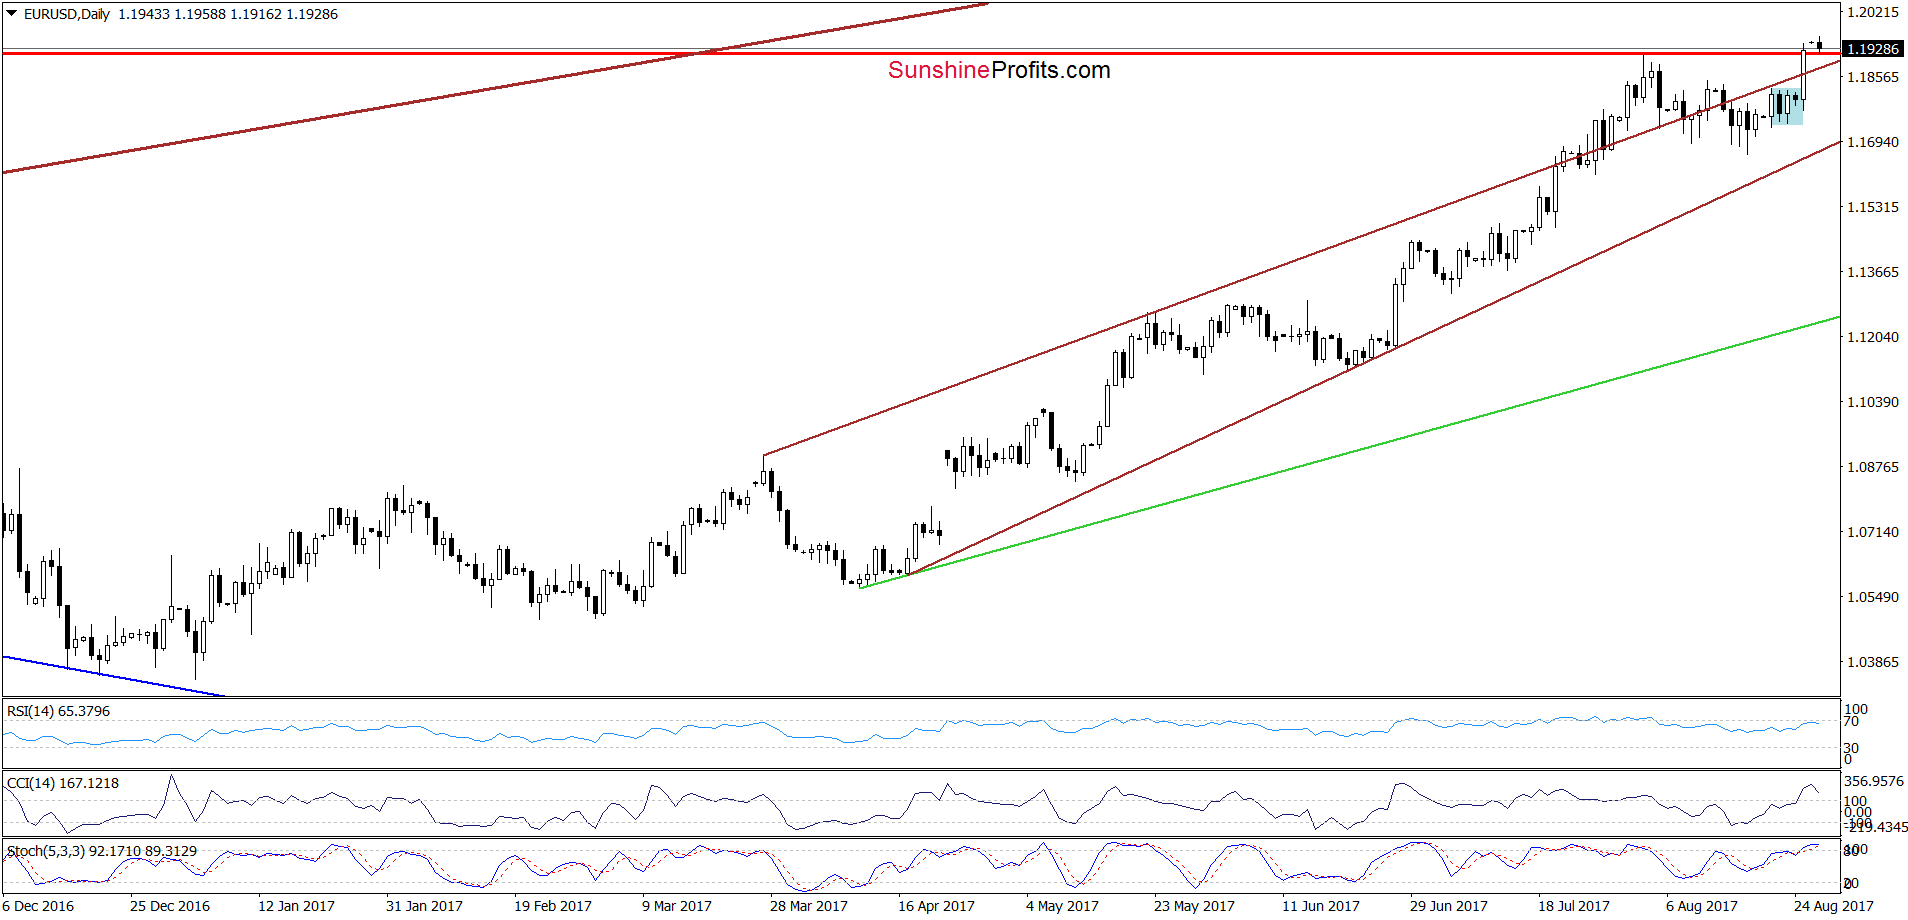
(…) EUR/USD is still trading in the blue consolidation under the upper border of the brown rising trend channel, which makes the very short-term situation unclear. Nevertheless, the pair climbed above the 38.2% Fibonacci retracement and the 112.8% Fibonacci extension (marked on the weekly chart), which suggests an invalidation of the earlier tiny breakdowns under these lines and another attempt to move higher.
From today’s point of view, we see that the situation developed in tune with the above scenario as EUR/USD broke above the upper border of the blue consolidation, triggering a climb above the upper line of the brown rising trend channel and the early August high. As a result, the pair hit a fresh 2017 peak. Earlier today, the exchange rate extended gains, but then reversed and declined.
Will we see another upswing in the coming days? Let’s examine the medium-term chart and find out.
In our Forex Trading Alert posted on August 7, we wrote the following:
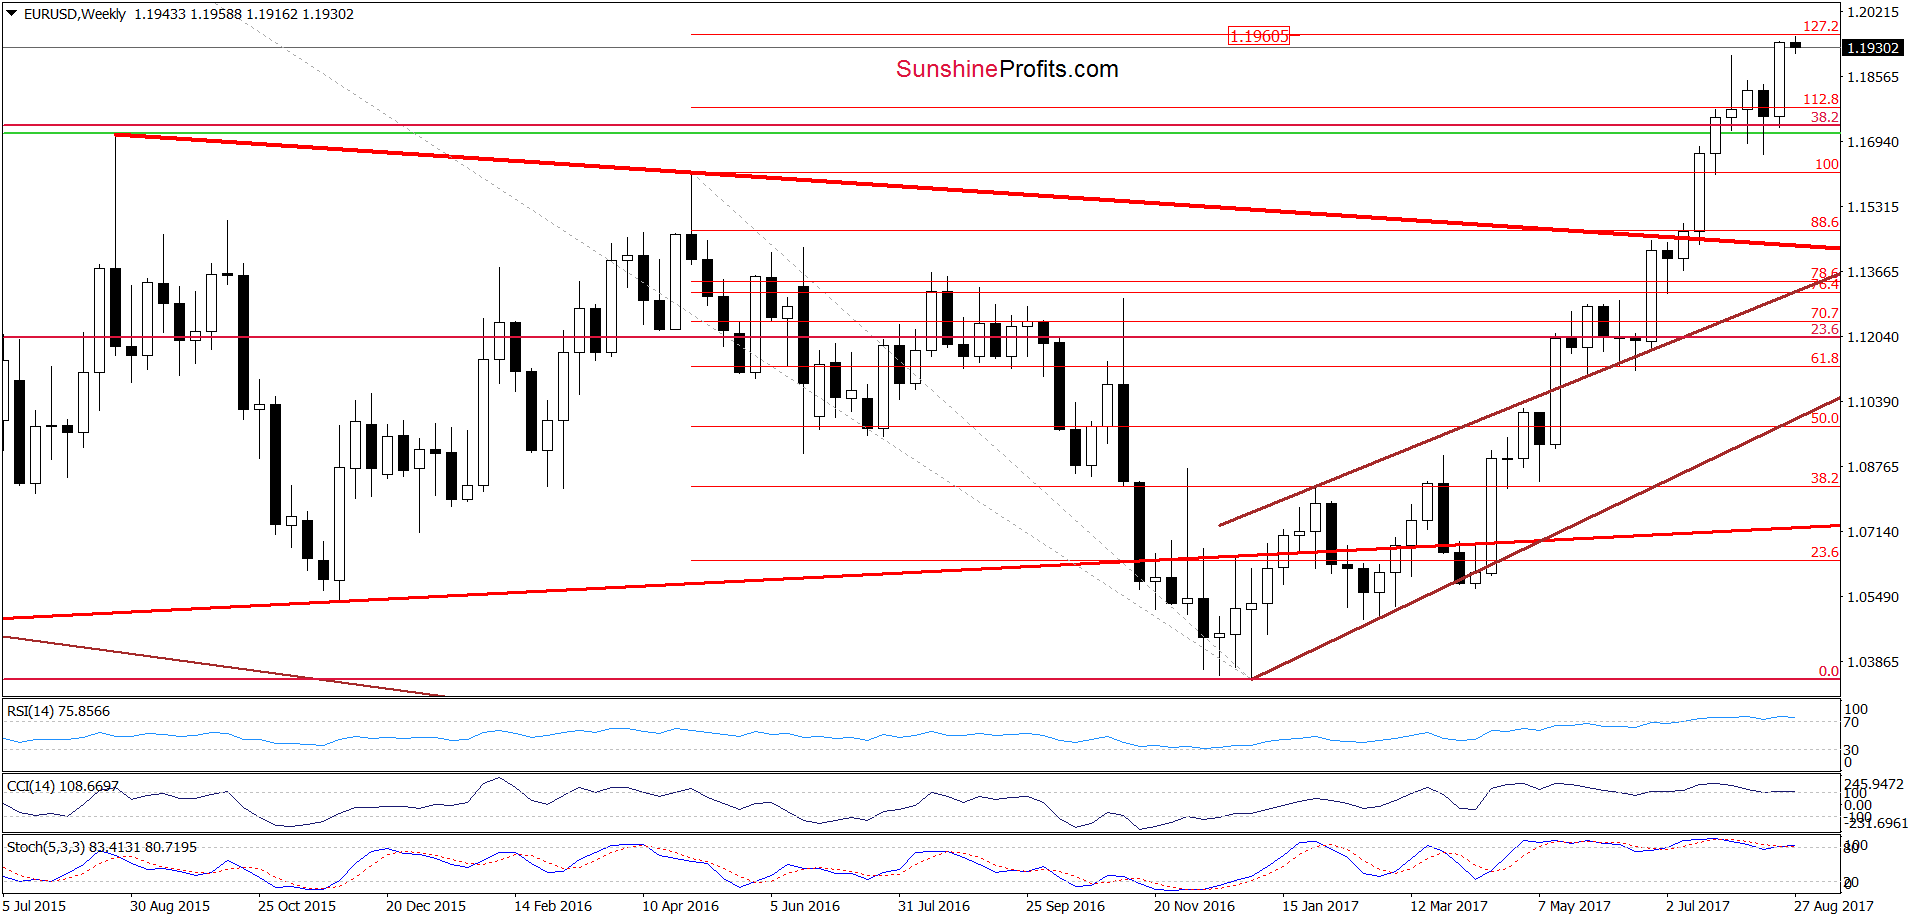
(…) currency bulls pushed EUR/USD higher in the previous week, which resulted in a breakout above the 38.2% Fibonacci retracement based on the entire May 2014-January 2017 downward move (the retracement is more visible on the long-term chart) and the 112.8% Fibonacci extension (based on the May 2016- January 2017 downward move).
(…) such price action suggests that (…) if the pair moves higher from current levels, the initial upside target will be around 1.1960, where the 127.2% Fibonacci extension is.
Looking at the weekly chart, we see that currency bulls pushed EUR/USD to 1.1958, which resulted in an increase to (almost) the 127.2% Fibonacci extension. Taking this fact into account and combining it with the current position of the weekly and daily indicators, it seems to us that we may finally see a reversal and a bigger move to the downside in the coming week. Nevertheless, this scenario will be more likely and reliable if EUR/USD invalidates the breakout above the early August peak and if the indicators generate sell signals in the following days. If we see such price action, we’ll consider opening short positions. As always, we’ll keep you - our subscribers - informed should anything change.
Very short-term outlook: mixed with bearish bias
Short-term outlook: mixed
MT outlook: mixed
LT outlook: mixed
GBP/USD
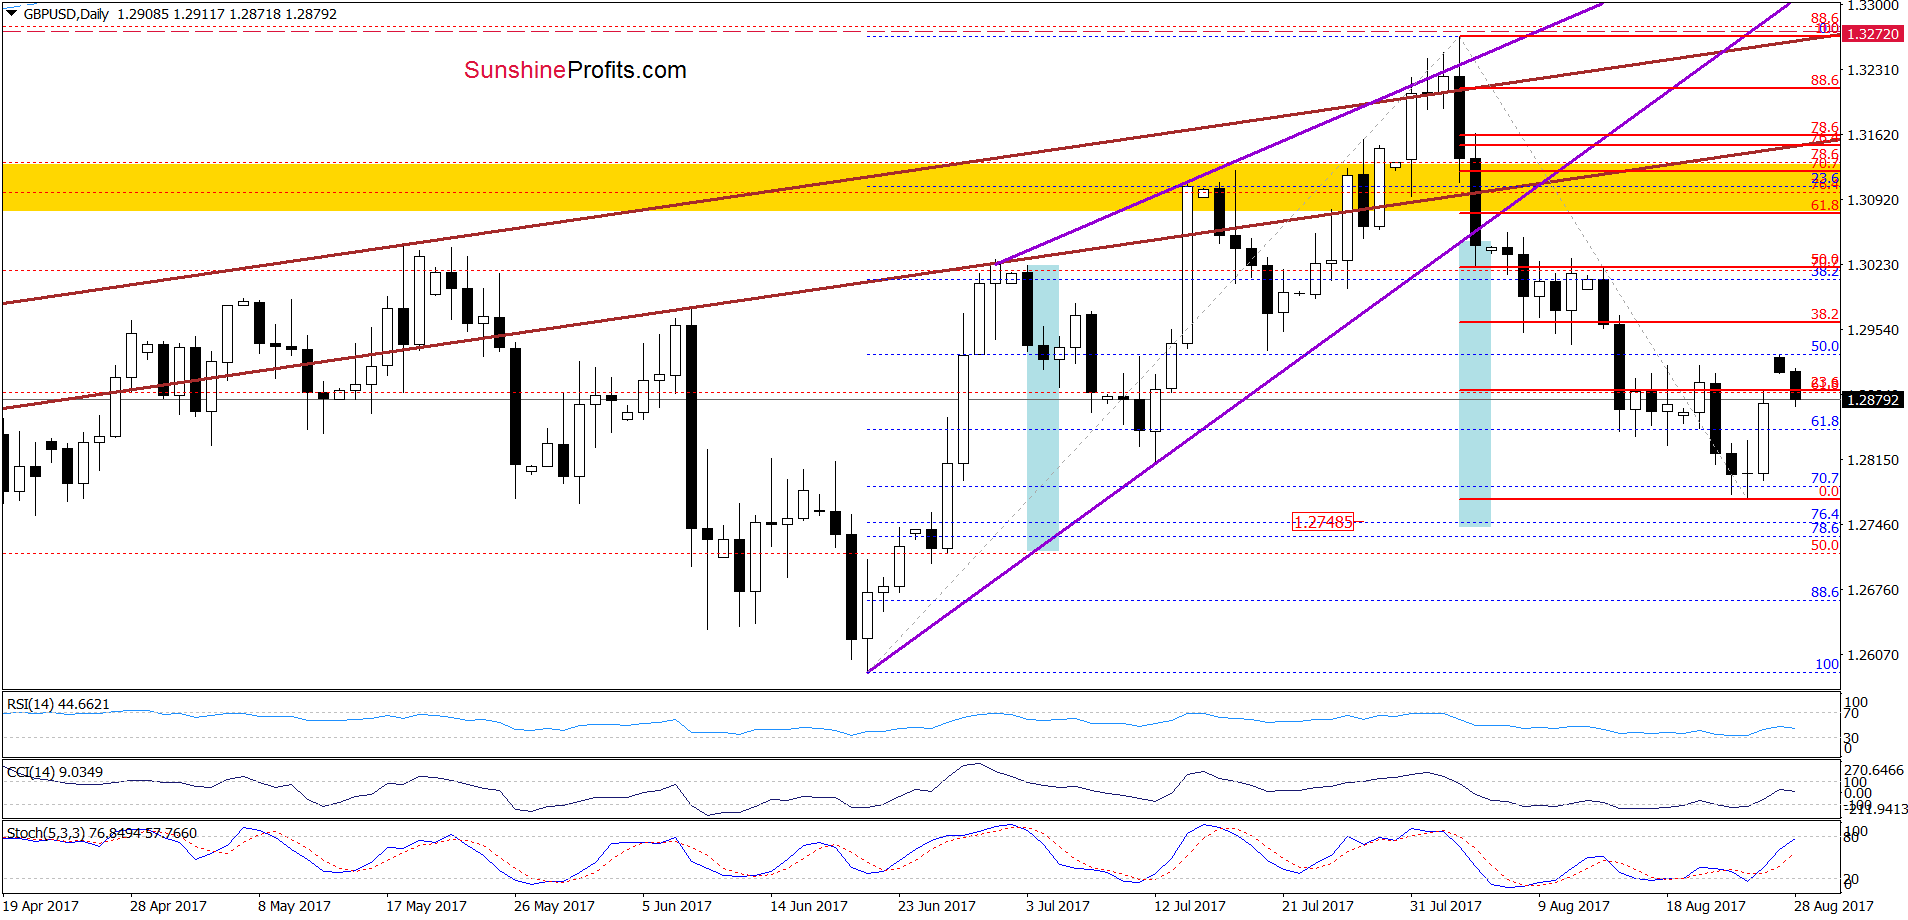
On the daily chart, we see that GBP/USD rebounded on Friday, but did this increase change anything in the overall situation? In our opinion, it didn’t. As you see on the above chart, although currency bulls pushed the exchange rate above the last week’s highs, the pair didn’t even reach the 38.2% Fibonacci retracement, which suggests that currency bulls are not as strong as it seems at the first sight.
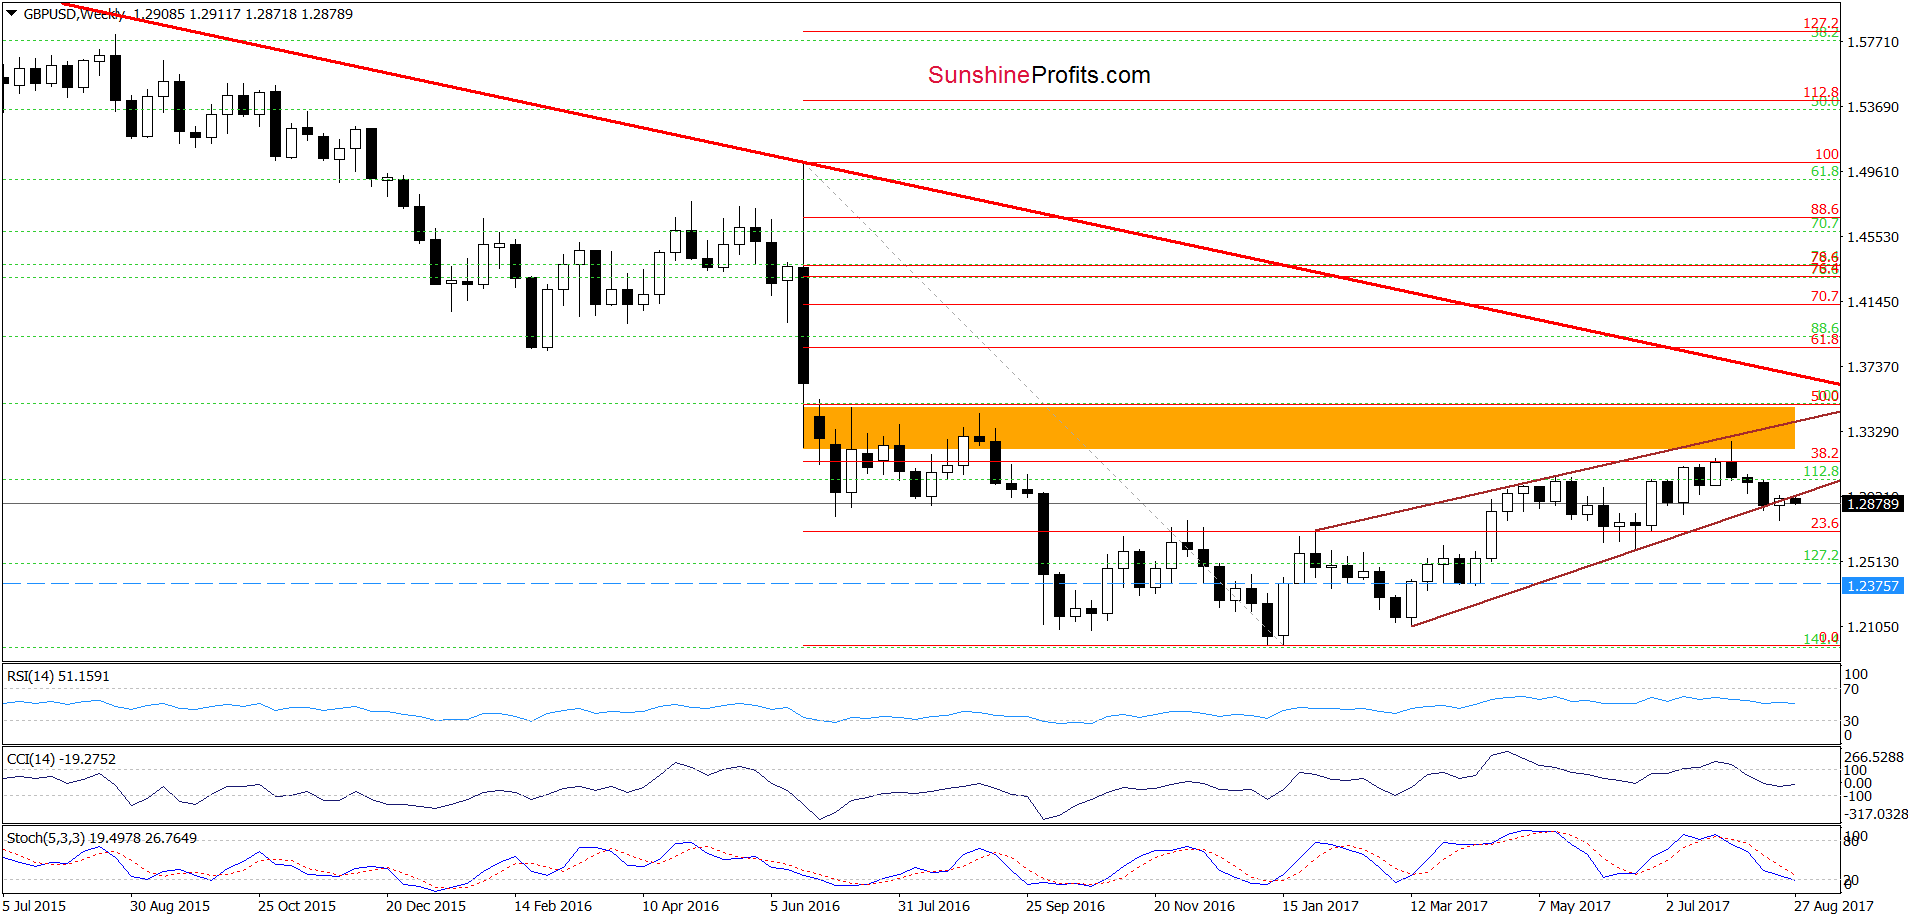
Additionally, the pair remains under the lower border of the brown rising wedge marked on the weekly chart, which suggests that another move to the downside and realization of the bearish scenario from our Forex Trading Alert posted on Thursday is very likely:
(…) another downside target for currency bears will be around 1.2748, where the size of the downward move will correspond to the height of the rising wedge and where the 76.4% and 78.6% Fibonacci retracements are.
Very short-term outlook: bearish
Short-term outlook: bearish
MT outlook: mixed with bearish bias
LT outlook: mixed
USD/CAD
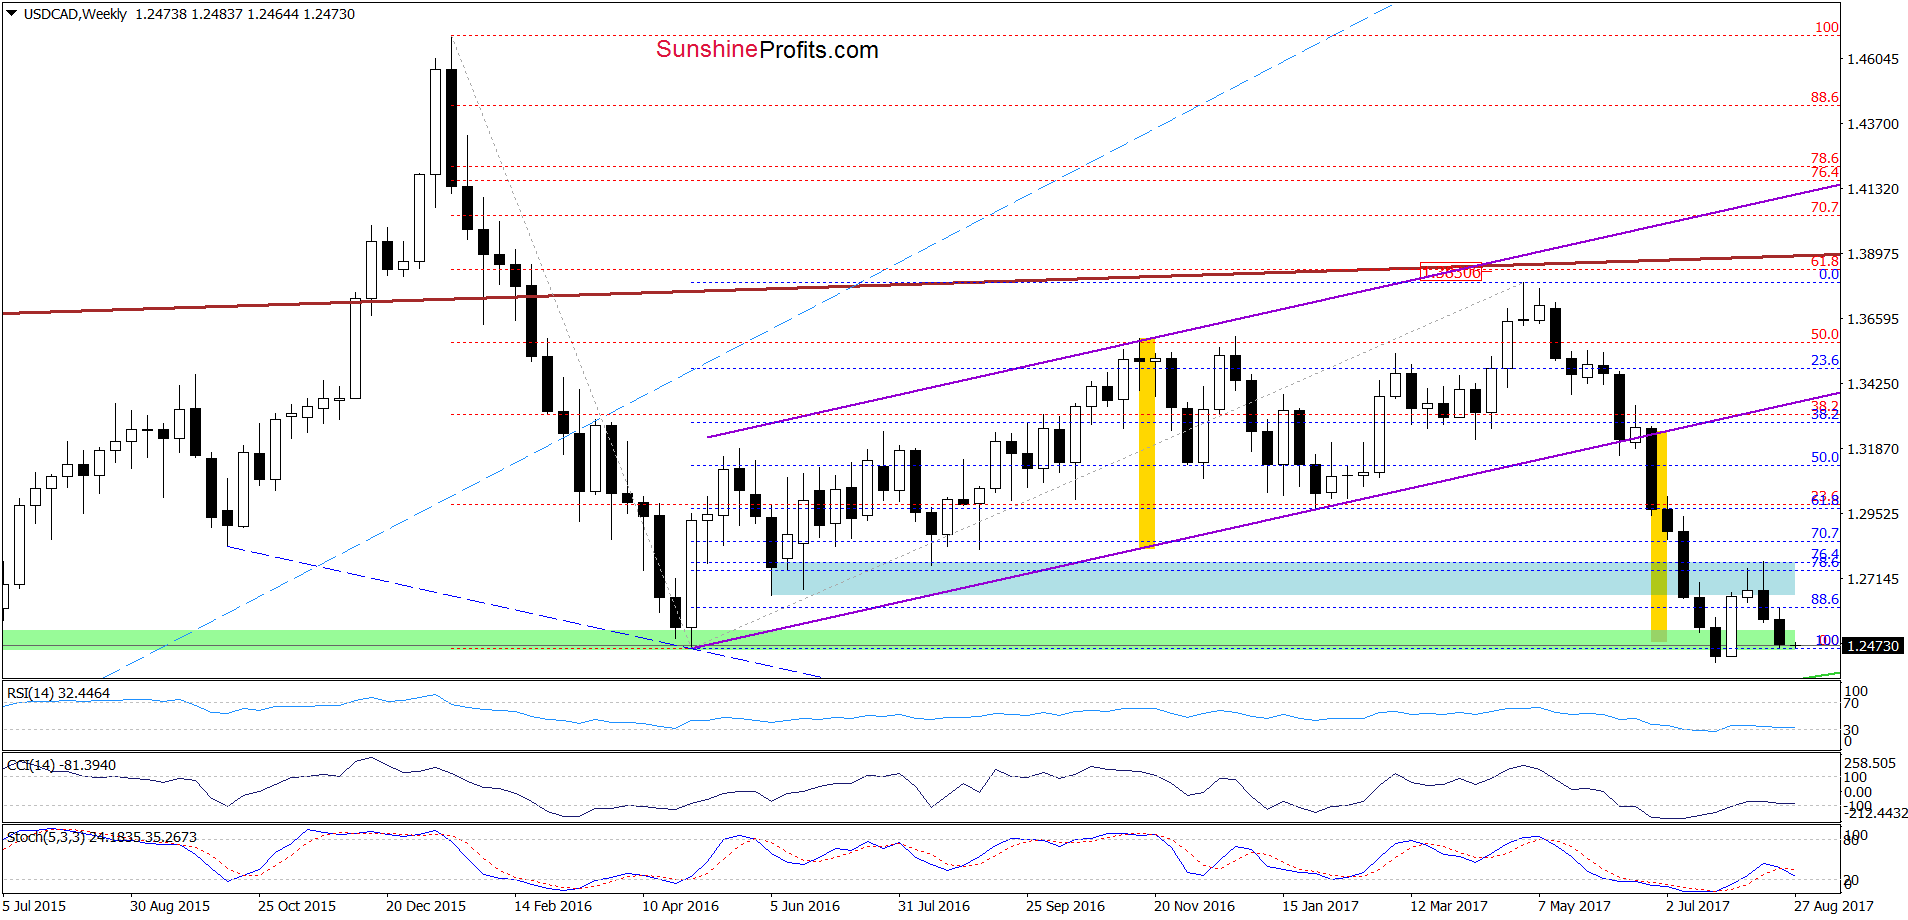
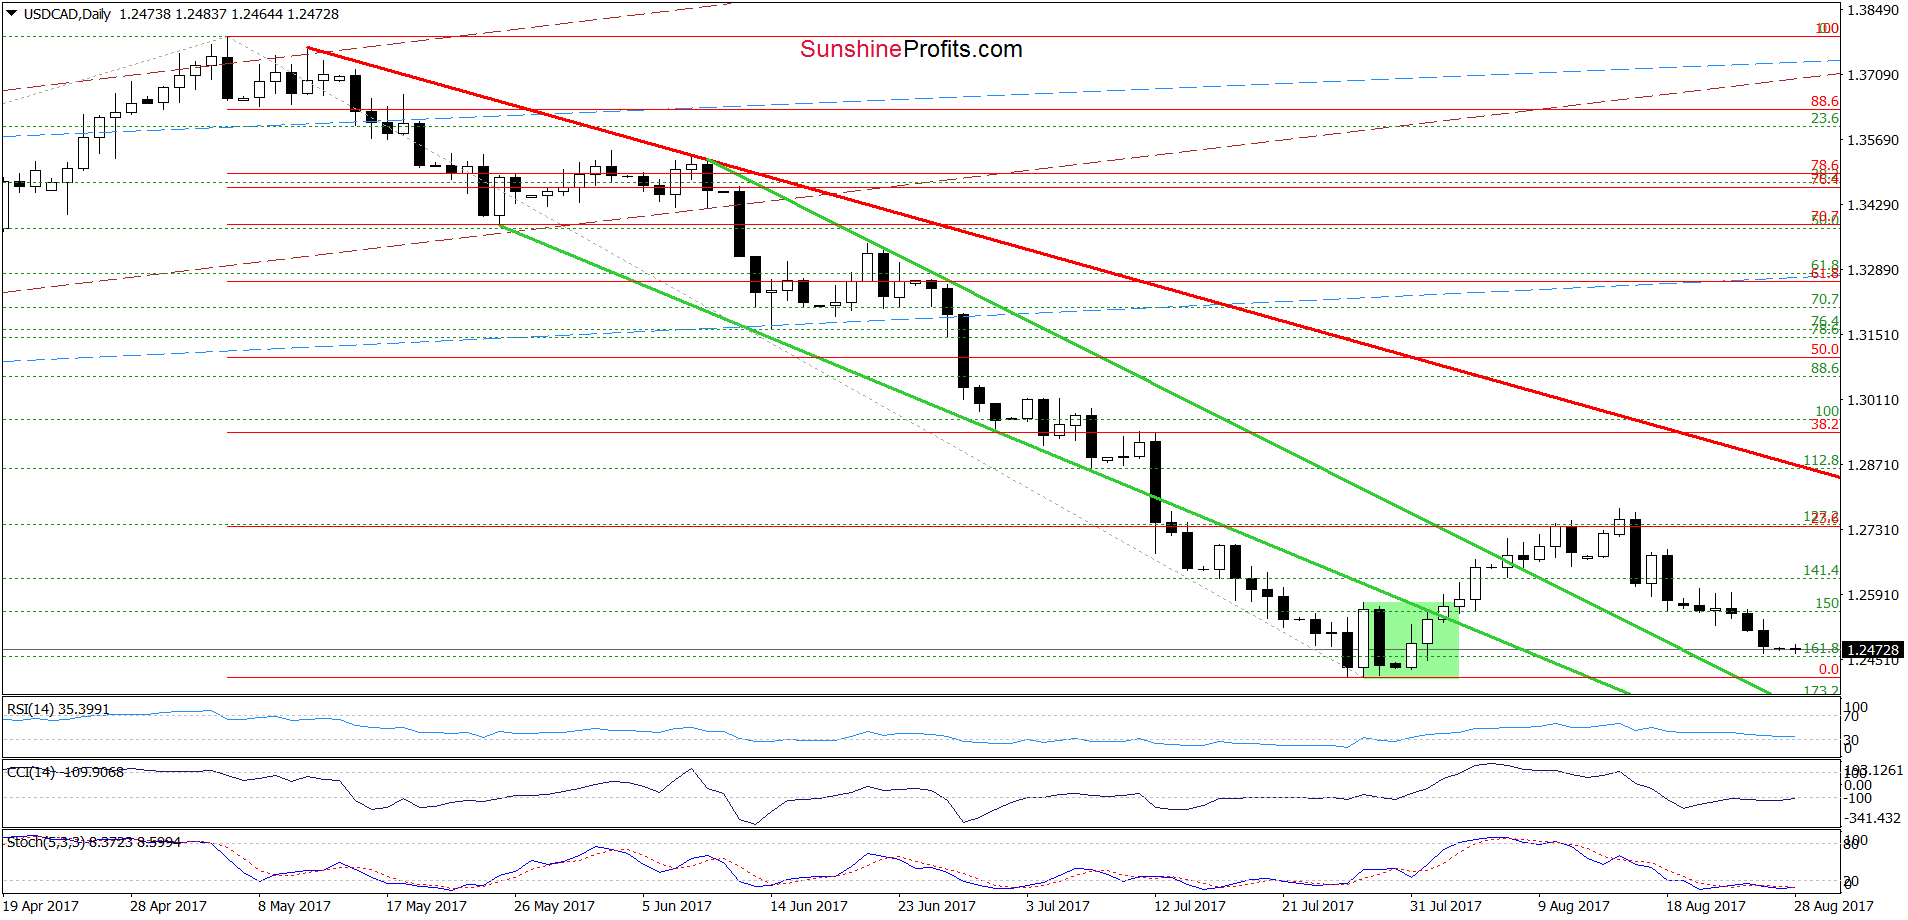
On Friday, USD/CAD moved visibly lower once again, which resulted in a drop to the lowest level since the beginning of the month. Additionally, the sell signal generated by the weekly Stochastic Oscillator continues to support currency bears, which suggests that we’ll see a test of the late July lows in the coming days.
Very short-term outlook: mixed with bearish bias
Short-term outlook: mixed
MT outlook: mixed
LT outlook: mixed
Naturally, the above could change in the coming days and we’ll keep our subscribers informed, but that’s what appears likely based on the data that we have right now. If you enjoyed reading our analysis, we encourage you to subscribe to our daily Forex Trading Alerts.
Thank you.
Nadia Simmons
Forex & Oil Trading Strategist
Przemyslaw Radomski, CFA
Founder, Editor-in-chief, Gold & Silver Fund Manager
Gold & Silver Trading Alerts
Forex Trading Alerts
Oil Investment Updates
Oil Trading Alerts
