

Briefly: In our opinion, full (200% of the regular size of the position) speculative short positions in gold, silver and mining stocks are justified from the risk/reward perspective at the moment of publishing this alert.
The general stock market stole the spotlight yesterday as it declined most profoundly in years. Some investors have likely expected the precious metals market to soar in such a scenario, but you knew that this was not the likely course of action. Indeed, gold’s reaction was barely visible. Metals moved a bit higher, but mining stocks ended the session lower. However, that’s not the only important development that took place yesterday.
Let’s check the key details, starting with gold’s price compared to the S&P 500 Index (chart courtesy of http://stockcharts.com).
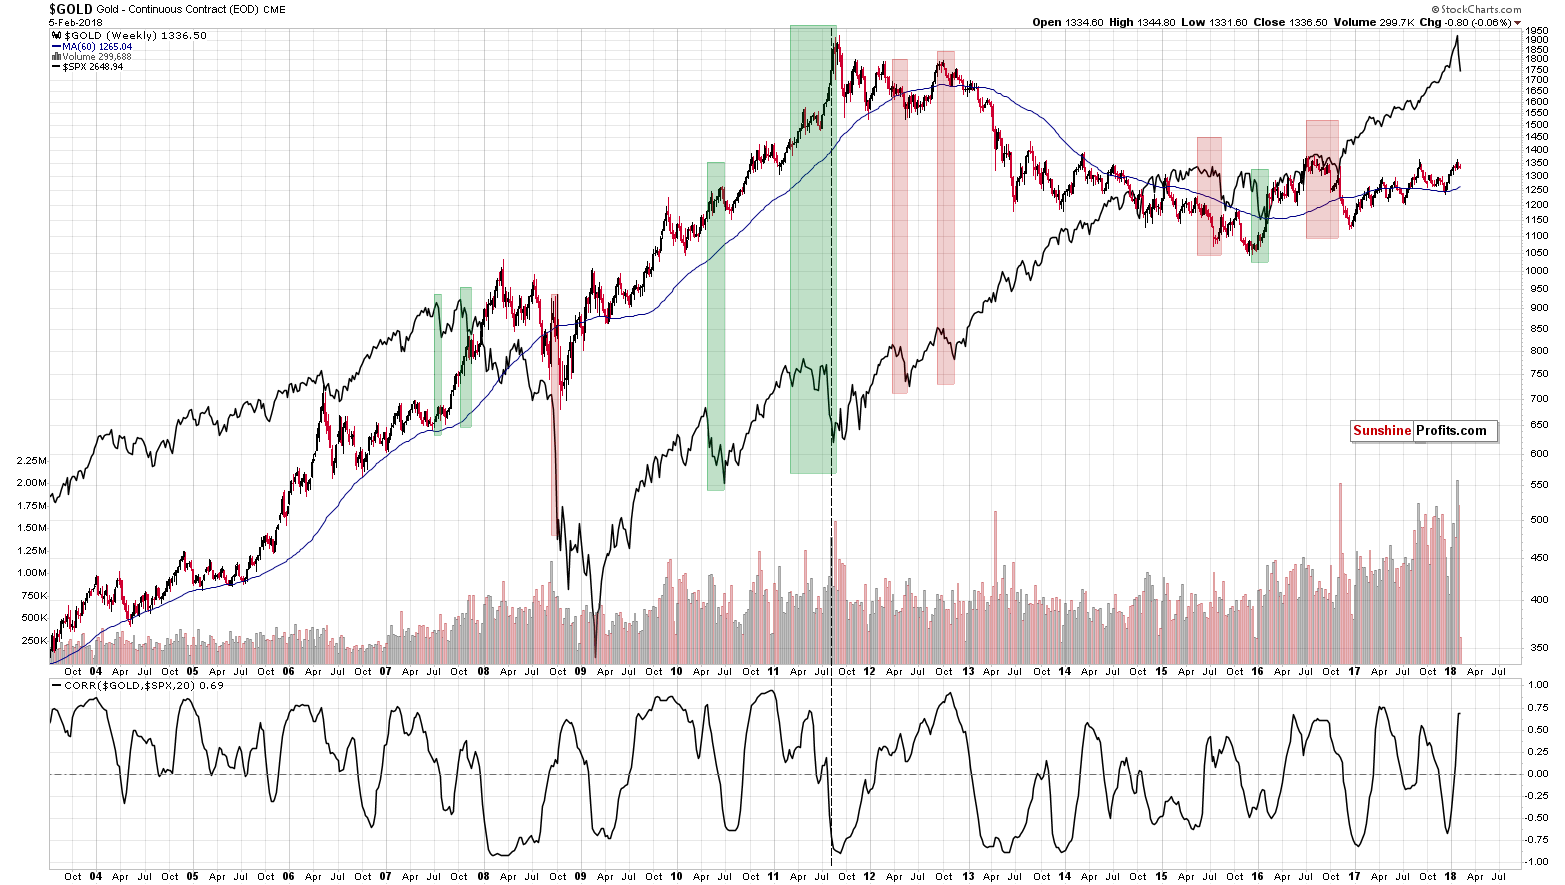
As we explained previously, there’s one thing that – right from the start – differentiates between the two kinds of reaction: stocks declining along with gold and stocks triggering a rally in gold. Autocorrelation. Autocorrelation is a fancy way of saying that what happens first makes the same reaction likely, which makes the follow-up to the follow-up likely to be the same as well – and so on. In other words, the way gold initially reacted to the decline in the S&P 500 was the way in which it kept on reacting in the following weeks and – sometimes – months.
What kind of price action did we see in the previous several days (not only yesterday)? On average, the S&P declined along with gold. So, what’s the likely impact that a declining stock market is going to have on the precious metals market? It’s likely going to be negative in the following weeks and – perhaps – months.
At this point you may correctly ask: “If that’s the case, then why didn’t gold decline yesterday?” There are several reasons as to why this was not the case.
The simplest one is that the relationship described in the previous paragraph is supposed to work on average, but it doesn’t mean that gold and the S&P will move in the same direction on every single day. The metals didn’t react by soaring higher – they moved up rather insignificantly. Plus, miners were lower anyway.
The second thing is that yesterday’s session was particularly volatile – something that investors were not prepared for emotionally. Some of them had probably bought gold and silver in hope of hedging themselves. After the session it turned out that it was not that helpful (the S&P was down 4%, while gold was almost flat, moving higher by less than 0.5%), so the following days of the general stock market’s decline may be characterized be much smaller willingness of the investors to purchase precious metals in hope of hedging their stock portfolios.
Finally, there might have been an entirely different reason for gold and silver to move higher other than the decline in the stock market. Just because something or someone is in the spotlight doesn’t make it or them important or relevant. Was the decline in the stock market as important for gold as Kim Kardashian’s new photo shoot?
It might actually have been the case.
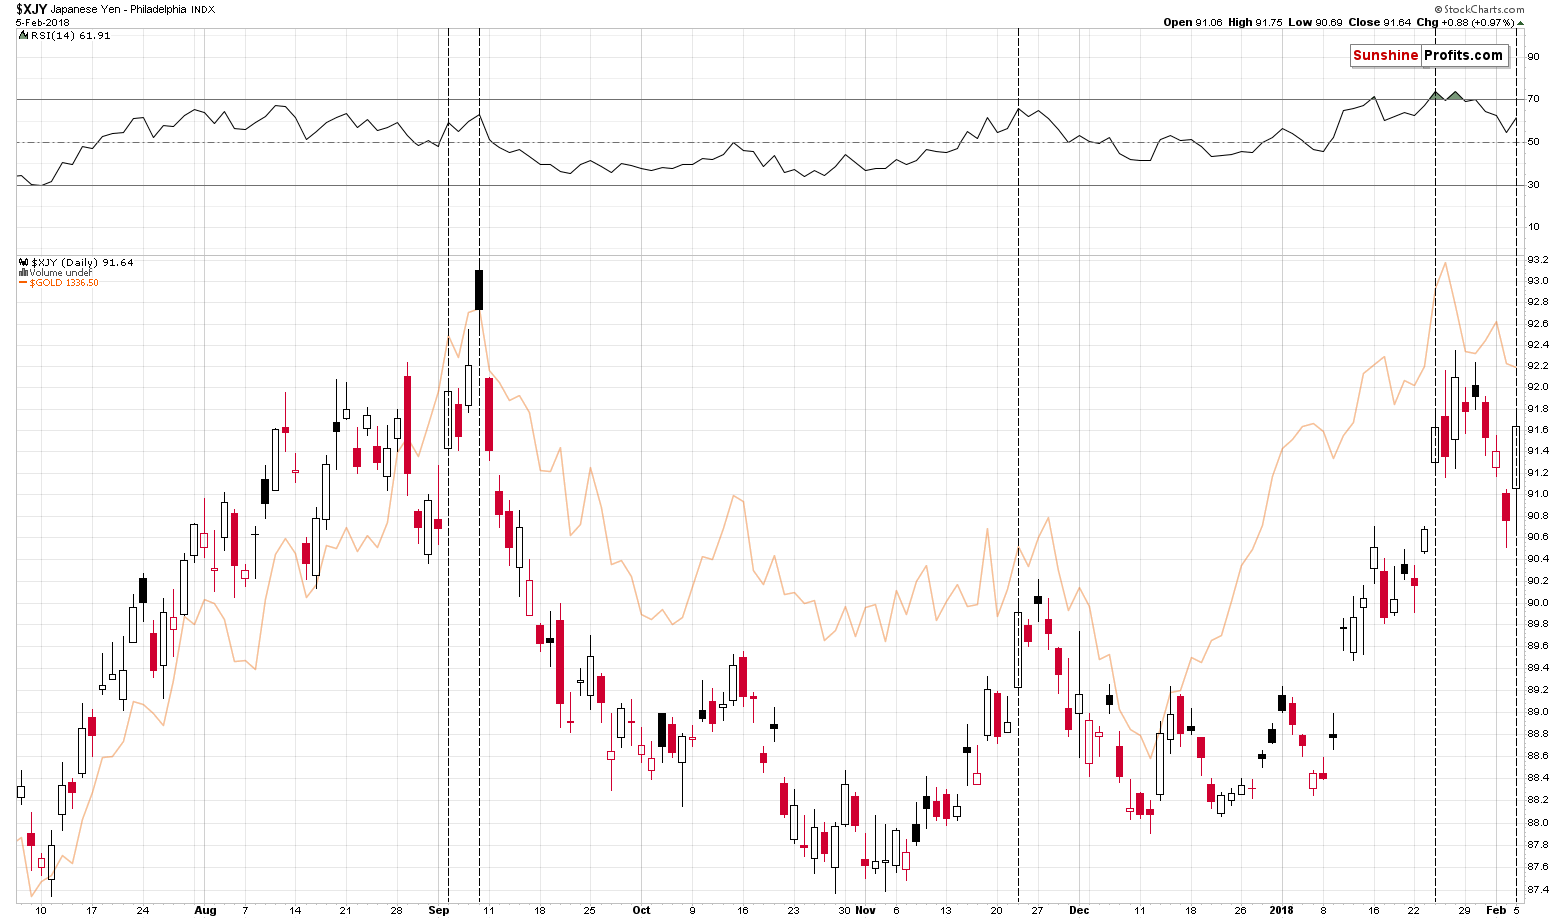
Gold quite often tends to move with the Japanese yen and the latter rallied quite sharply yesterday. We marked similar situations with vertical dashed lines. Gold moved higher in all previous cases and yesterday’s price action was the weakest of all of them. So, did gold perform well? Not really. Given the big rally in the yen and the big decline in the stock market, gold should have soared, but it didn’t.
Interestingly, the USD Index managed to move higher despite an increase in the value of the yen.
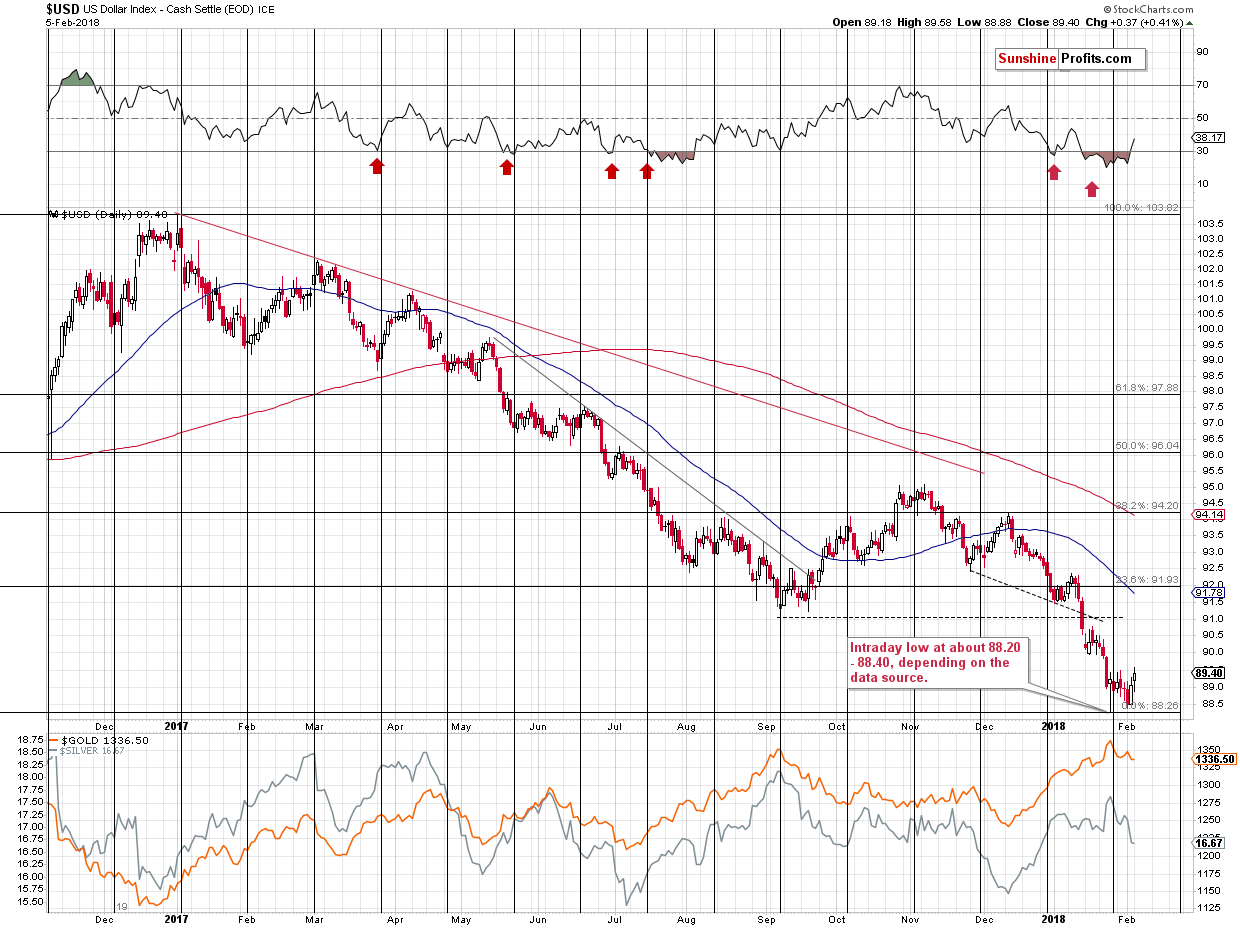
Yesterday’s closing price was the highest since January 23rd and the rally confirmed the usefulness of the cyclical turning points in the USD Index.
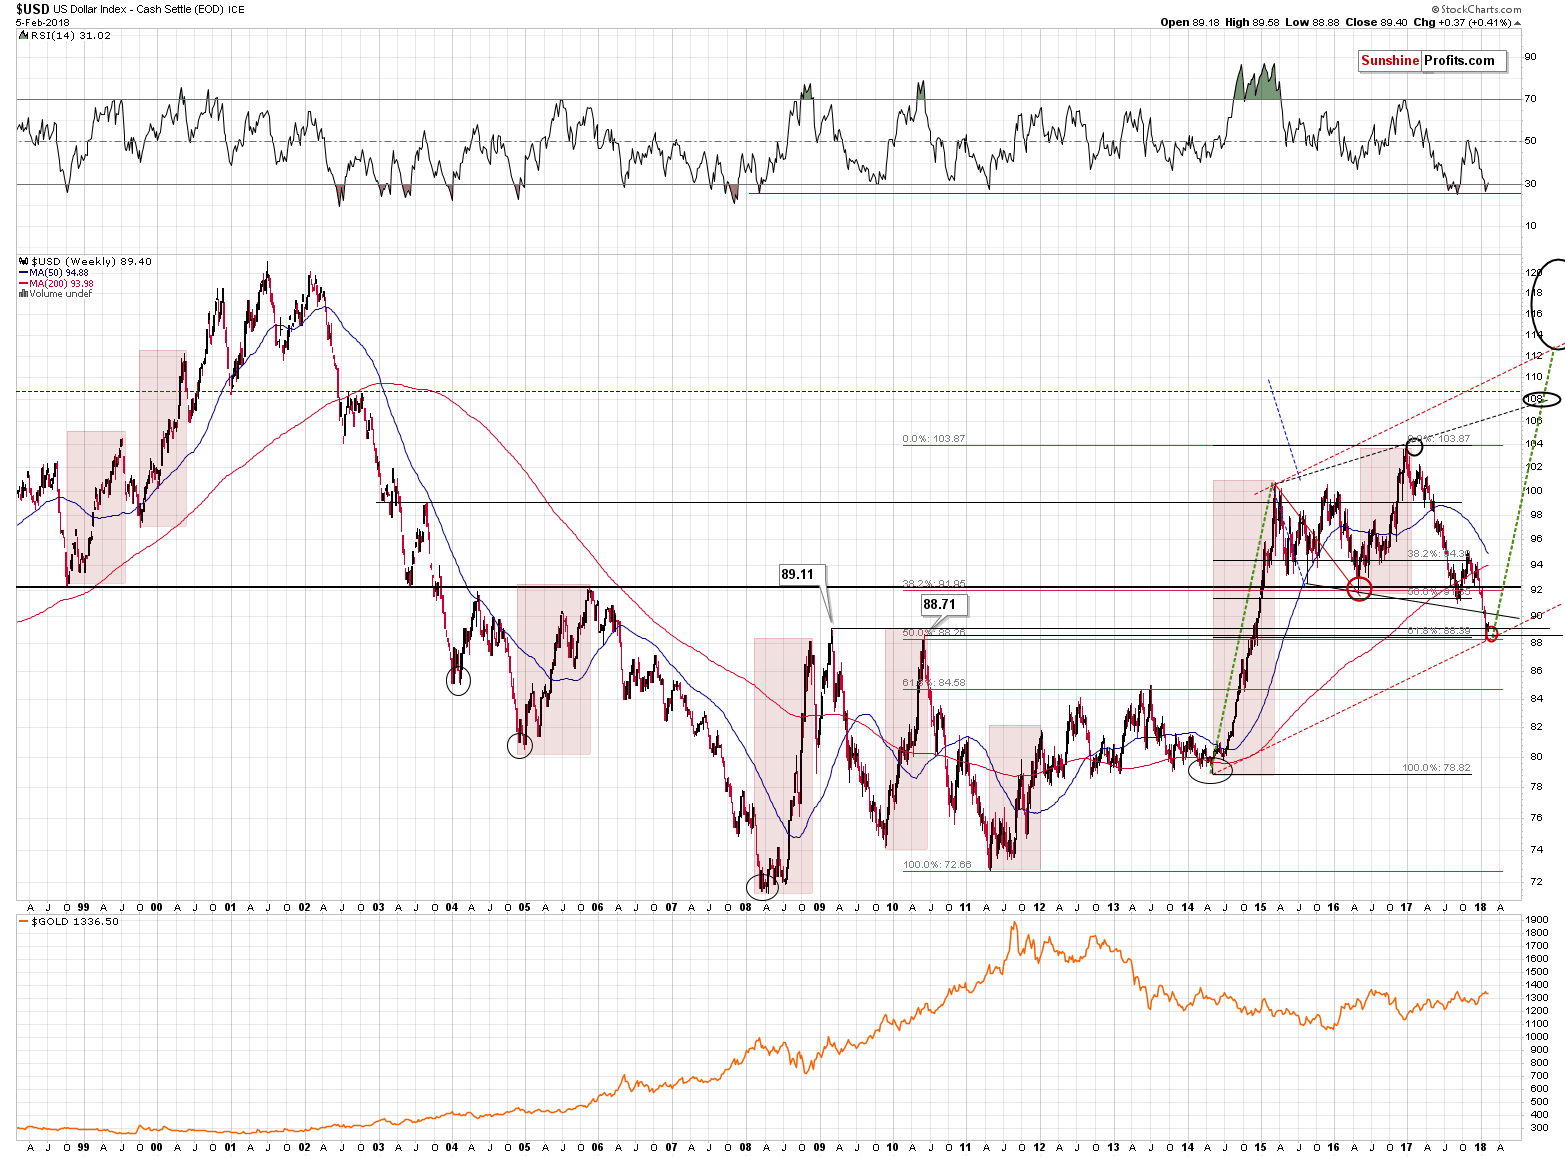
The closing price above the January 23rd close is important not only by itself, but because of what it means in relation to the breakdowns below the previous extremes in the USD Index. The highest of the critical, long-term support levels was 89.11 and since the USD just closed visibly above it, all breakdowns below the mentioned extremes are now clearly invalidated. The implications for the USD Index are very bullish for the upcoming weeks, which makes them bearish for the PMs.
Let’s move back to gold and stocks for a while.
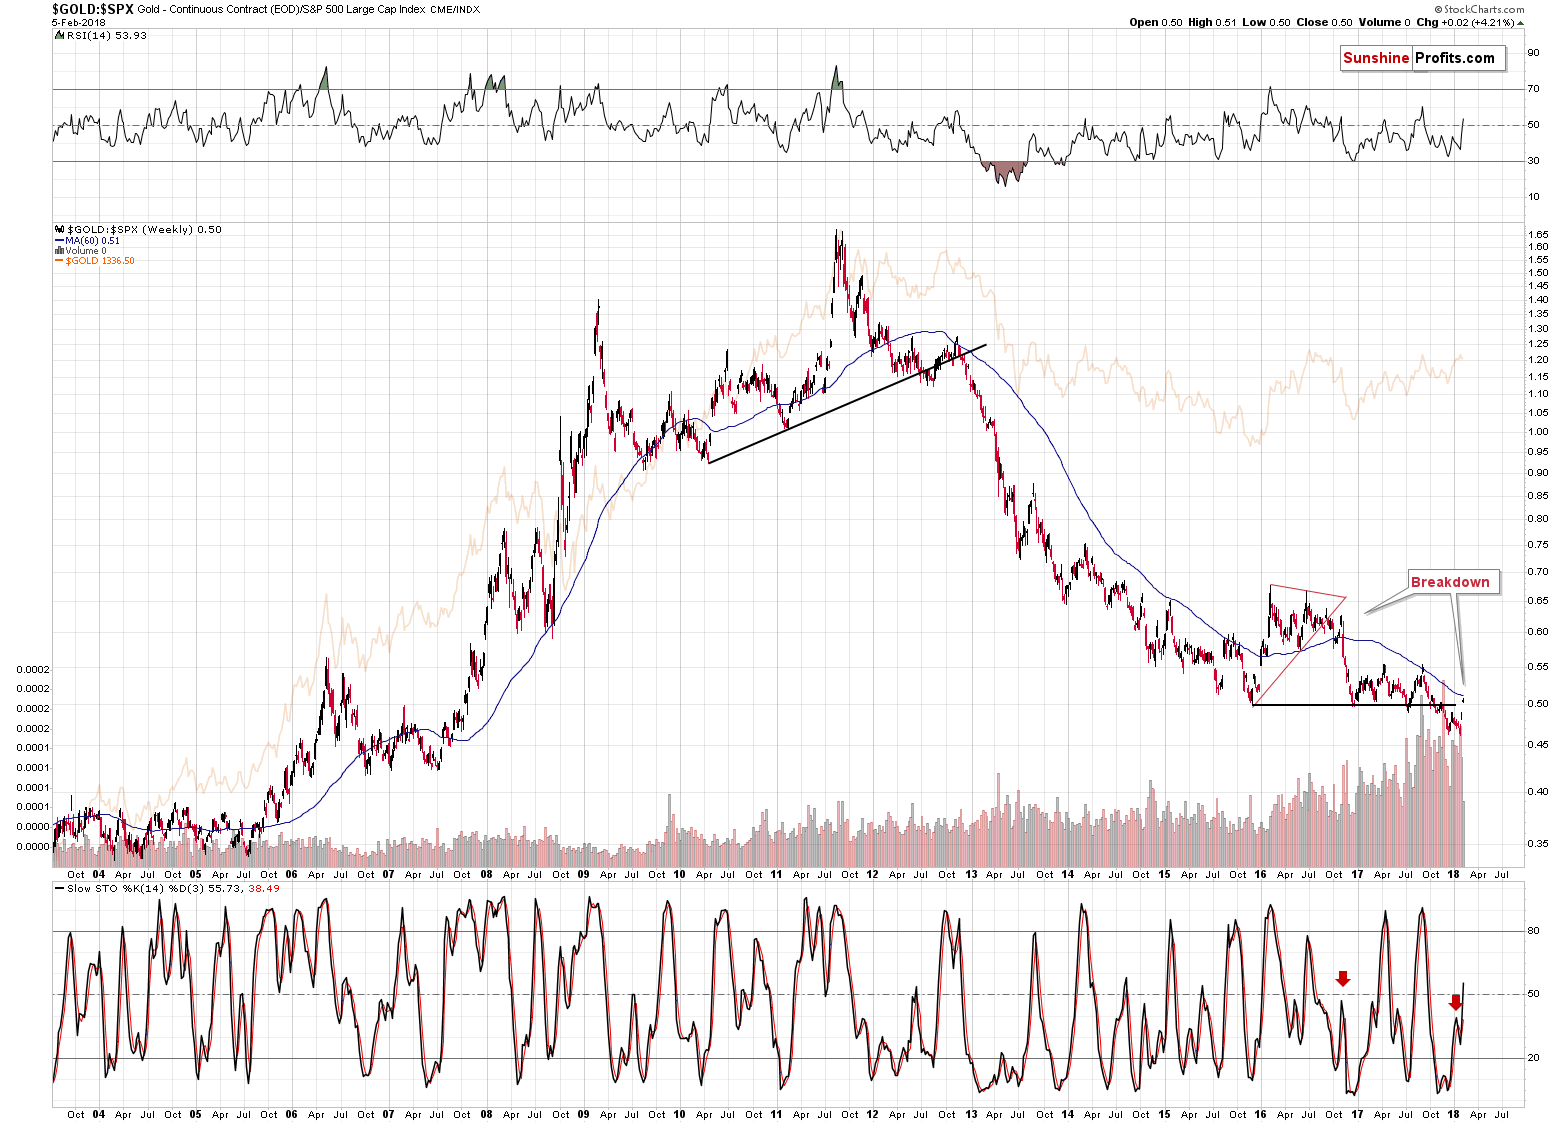
Their ratio moved higher and closed slightly above (almost at) the previous lows. Does the invalidation of the breakout have bullish implications? Most likely not for gold, but as far as the ratio itself is concerned, then it’s not clear as the invalidation itself is not clear. The ratio is based on the closing prices and we’re not 100% certain if Stockcharts’ data for gold can be trusted. It’s almost certainly close to being correct, but if a small difference in the price of gold can imply either a move to the previously broken line or an invalidation of a breakdown, thus making the outlook either bearish or bullish, then it seems that we should wait at least another day to make the distinction.
We wrote that it’s not necessarily bullish for gold as another move higher in the ratio, perhaps to the previous 2017 highs, in the current market environment could mean another big slide in stocks and no significant movement in gold.
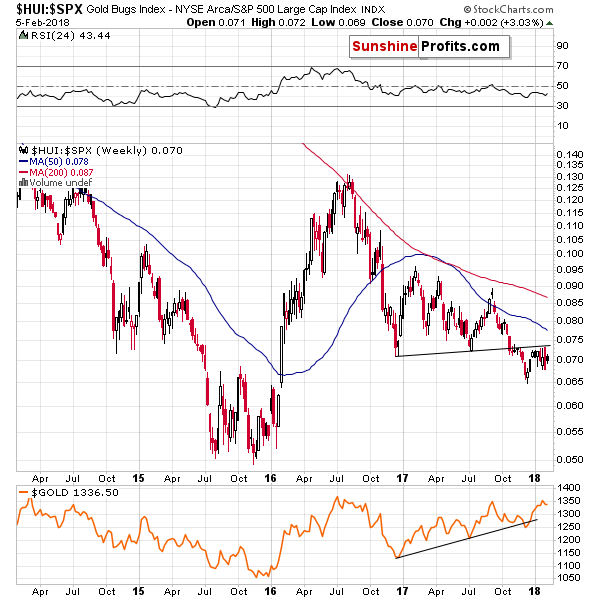
There was no invalidation in the case of the breakdown in the gold stocks to S&P ratio, which suggests that any small invalidation in the case of the gold to stocks ratio was rather accidental.
Comparing the HUI’s performance with the gold price movement also provides us with bearish signs.
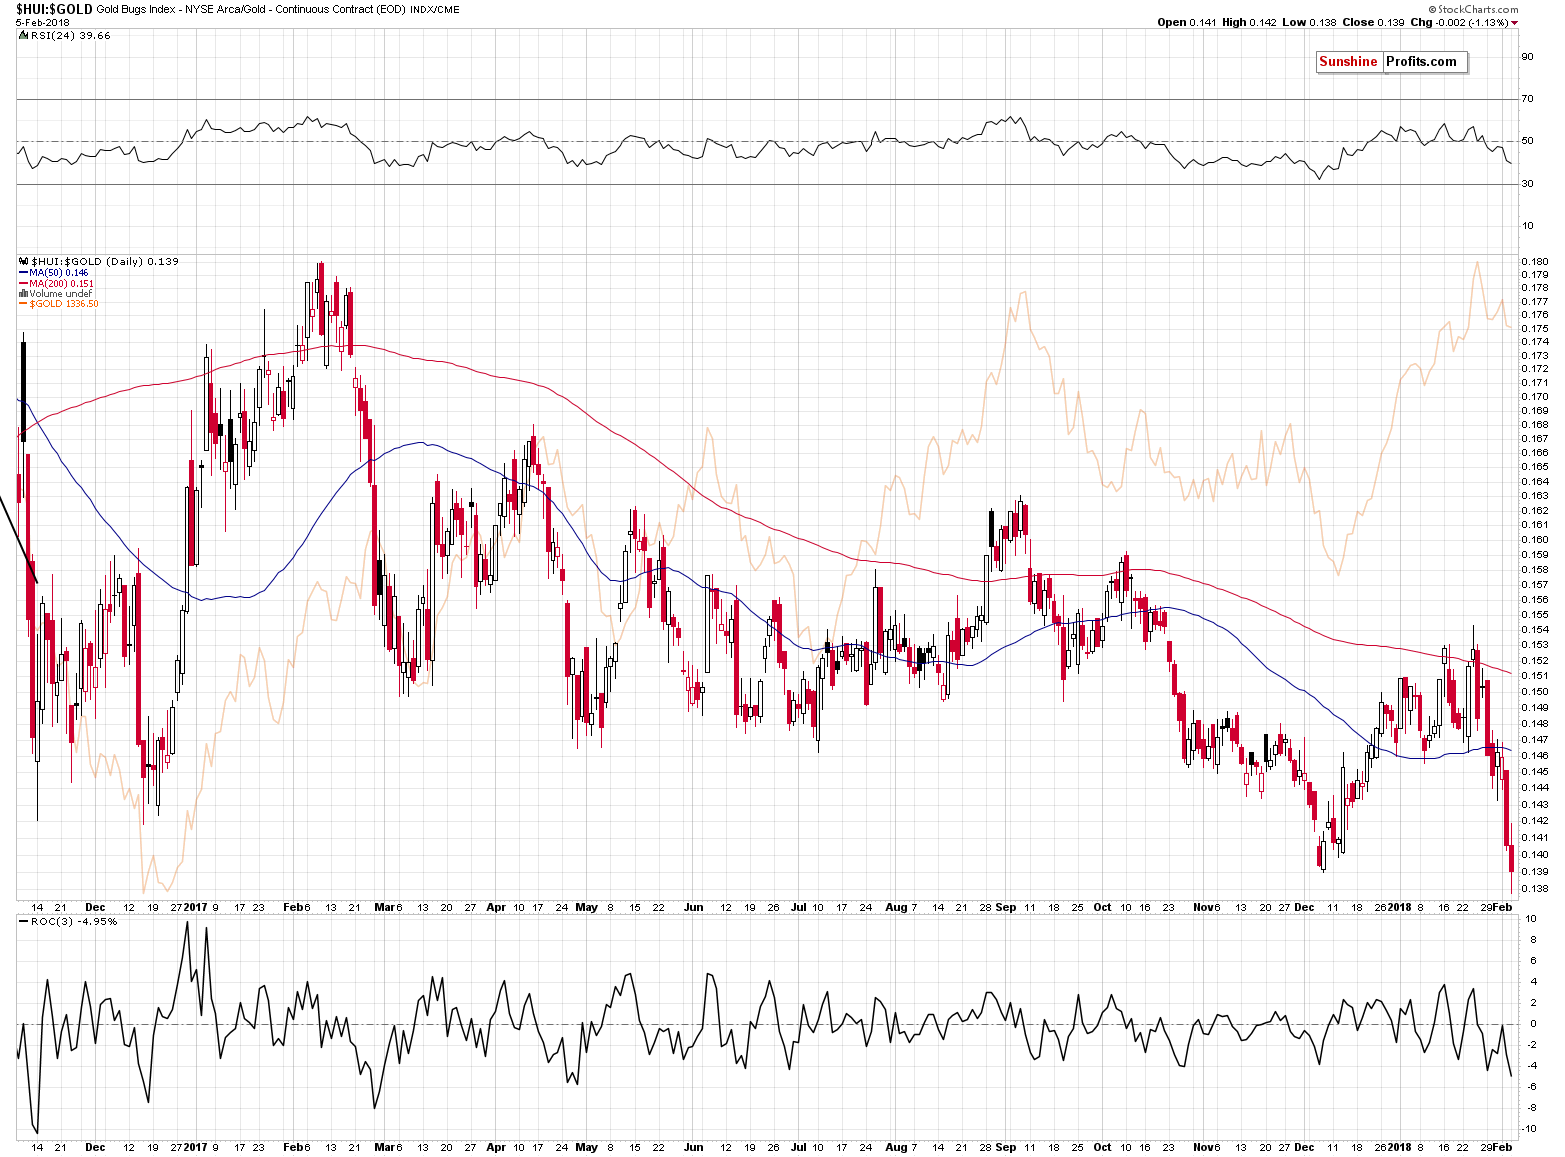
Yesterday, we wrote that the miners had underperformed gold to a great extent and were on the verge of breaking below the 2017 lows. Based on yesterday’s closing prices, we saw the mentioned breakdown. It’s not huge, but it’s visible and with the gold stocks to gold ratio below both 2017 and 2016 lows, the road to much lower valuations is wide open.
But can we infer the same from the analysis of the HUI Index itself?
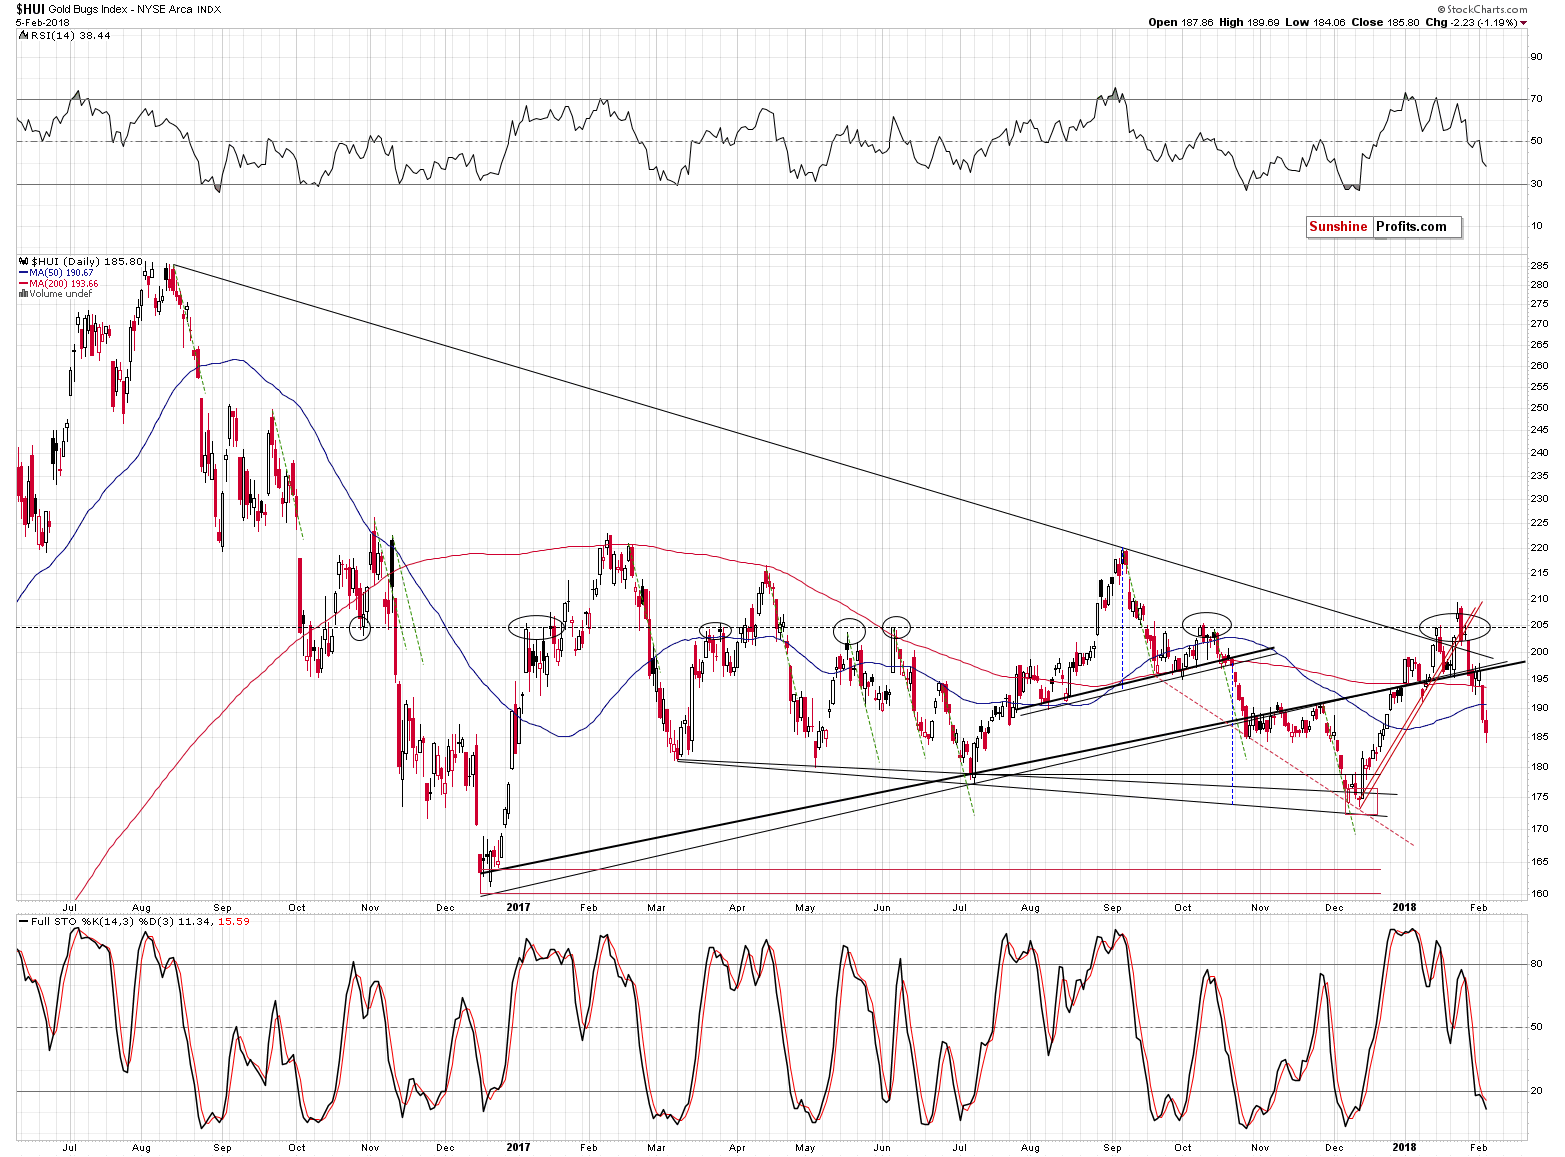
Definitely. The HUI Index is after confirmed breakdowns and seems to be on its way to much lower levels. Still, let’s not forget that markets usually don’t move in straight lines and there might be some corrections along the way. This means that even though the outlook is bearish, we should be looking for bullish signs that could trigger a temporary turnaround. So far, we don’t see any, especially in light of the miners’ continued underperformance of gold and the breakdown in the gold stocks to gold ratio. However, we’re monitoring the market for such signs and we’ll let you know once something’s up.
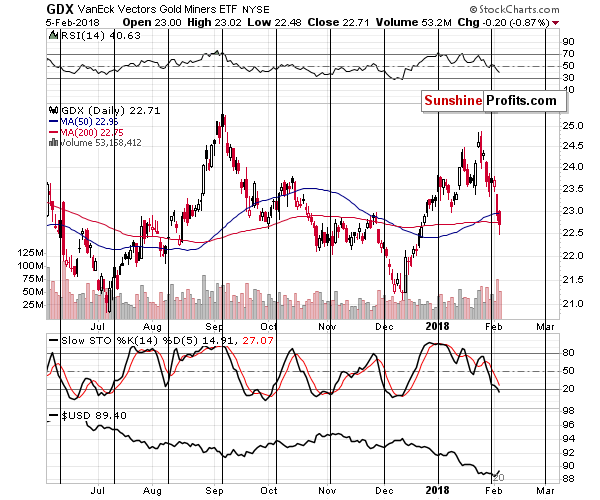
One thing that we added on the above chart to help us determine the turning points for the mining stocks is their cyclical tendency. In short, the turnings point for mining stocks are the turning points for gold, with additional sub-cycles in between.
We’ve been recently asked if it’s true that mining stocks have turning points between the 4th and the 10th day of the month. The reply is that this was the case in the previous year – but it’s moving toward the scenario in which the turning points are seen at or very close the end of the month. Consequently, the next turning point is not this week, but it’s already behind us and the next one is at the end of February and the beginning of March.
In other words, there’s not much more to the 4th to 10th day of the month rule – it’s a cycle that will likely be continued, but the above rule will likely not. You knew about this cycle all along (precisely, about every other cycle as that’s what appeared most useful for the gold market).
The decline in miners has been quite sharp, so some kind of pause is likely, but if it is seen, it will not be based on the turning point.
The additional thing that we can see on the above chart is that the volume that accompanied yesterday’s decline was quite sizable, so the bearish implications of the price-volume link remain in place.
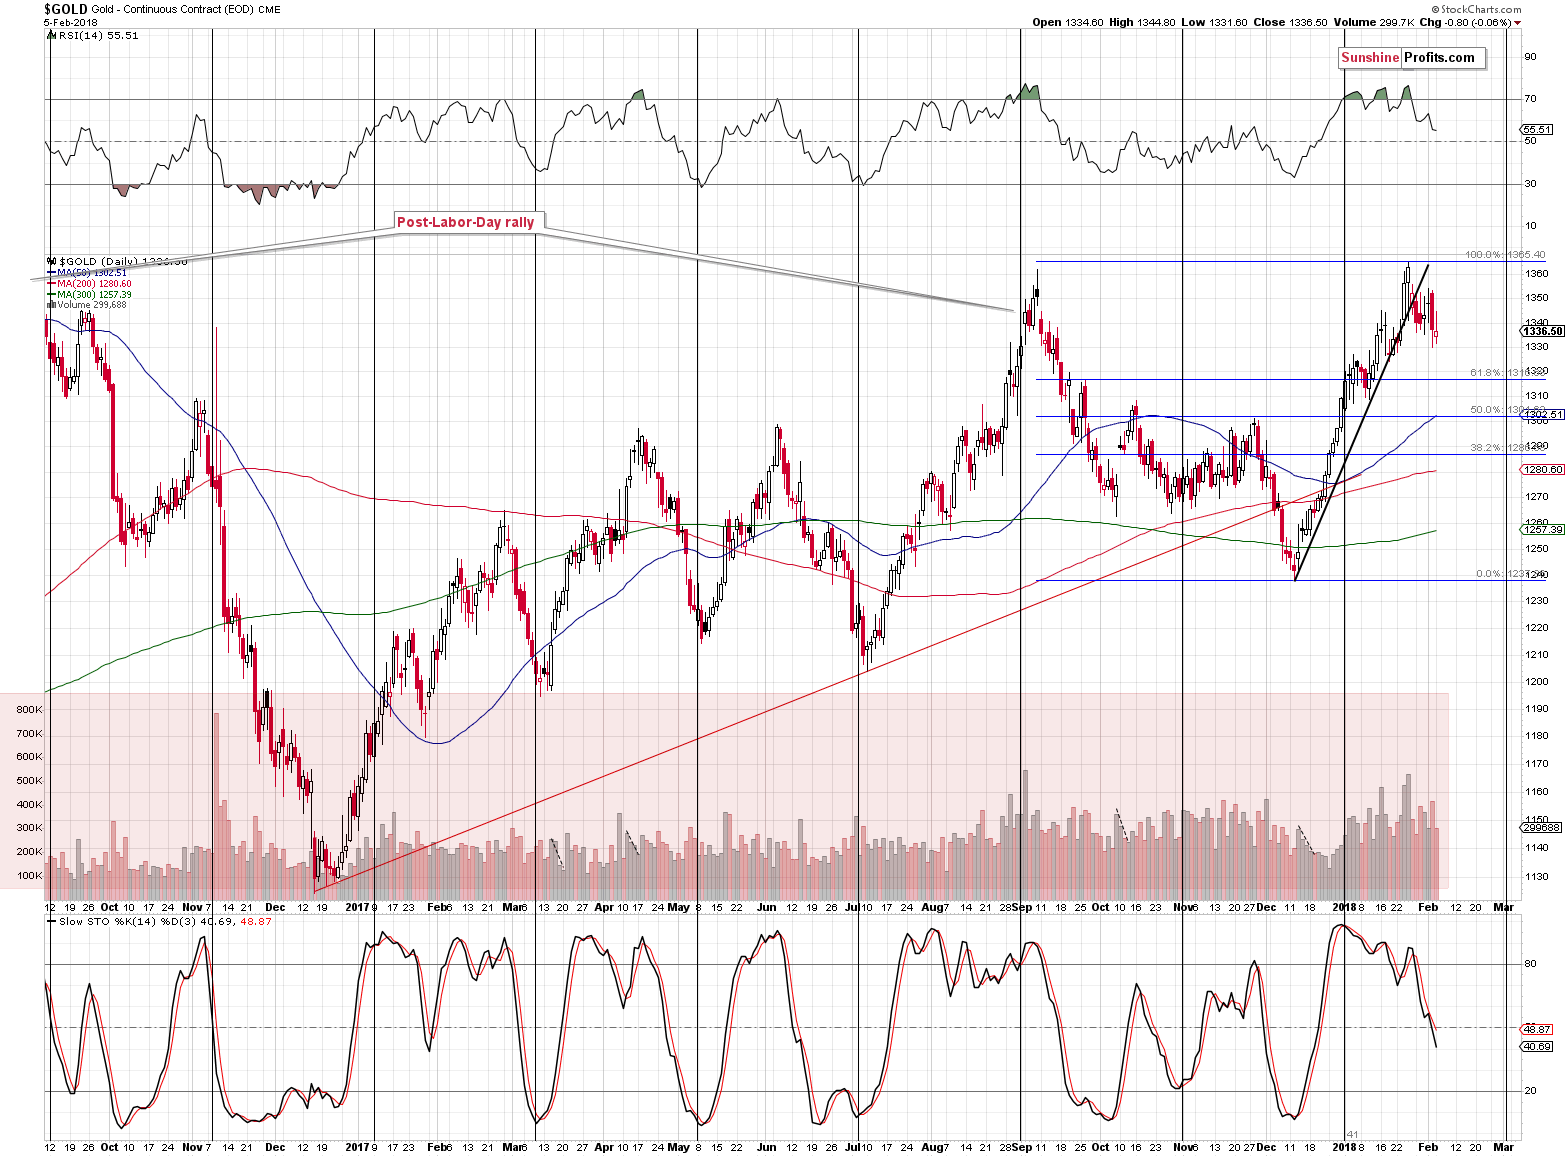
Moving to gold, we don’t see any fireworks on the above chart or anything else that’s particularly interesting – even taking into account today’s move to about $1,340 (that’s the “current price” at the moment of writing these words). The key thing is that we are not seeing bullish action despite the stock market’s plunge and the yen’s rally. The lack of reaction to factors that could have triggered a bigger rally is actually a bearish factor.
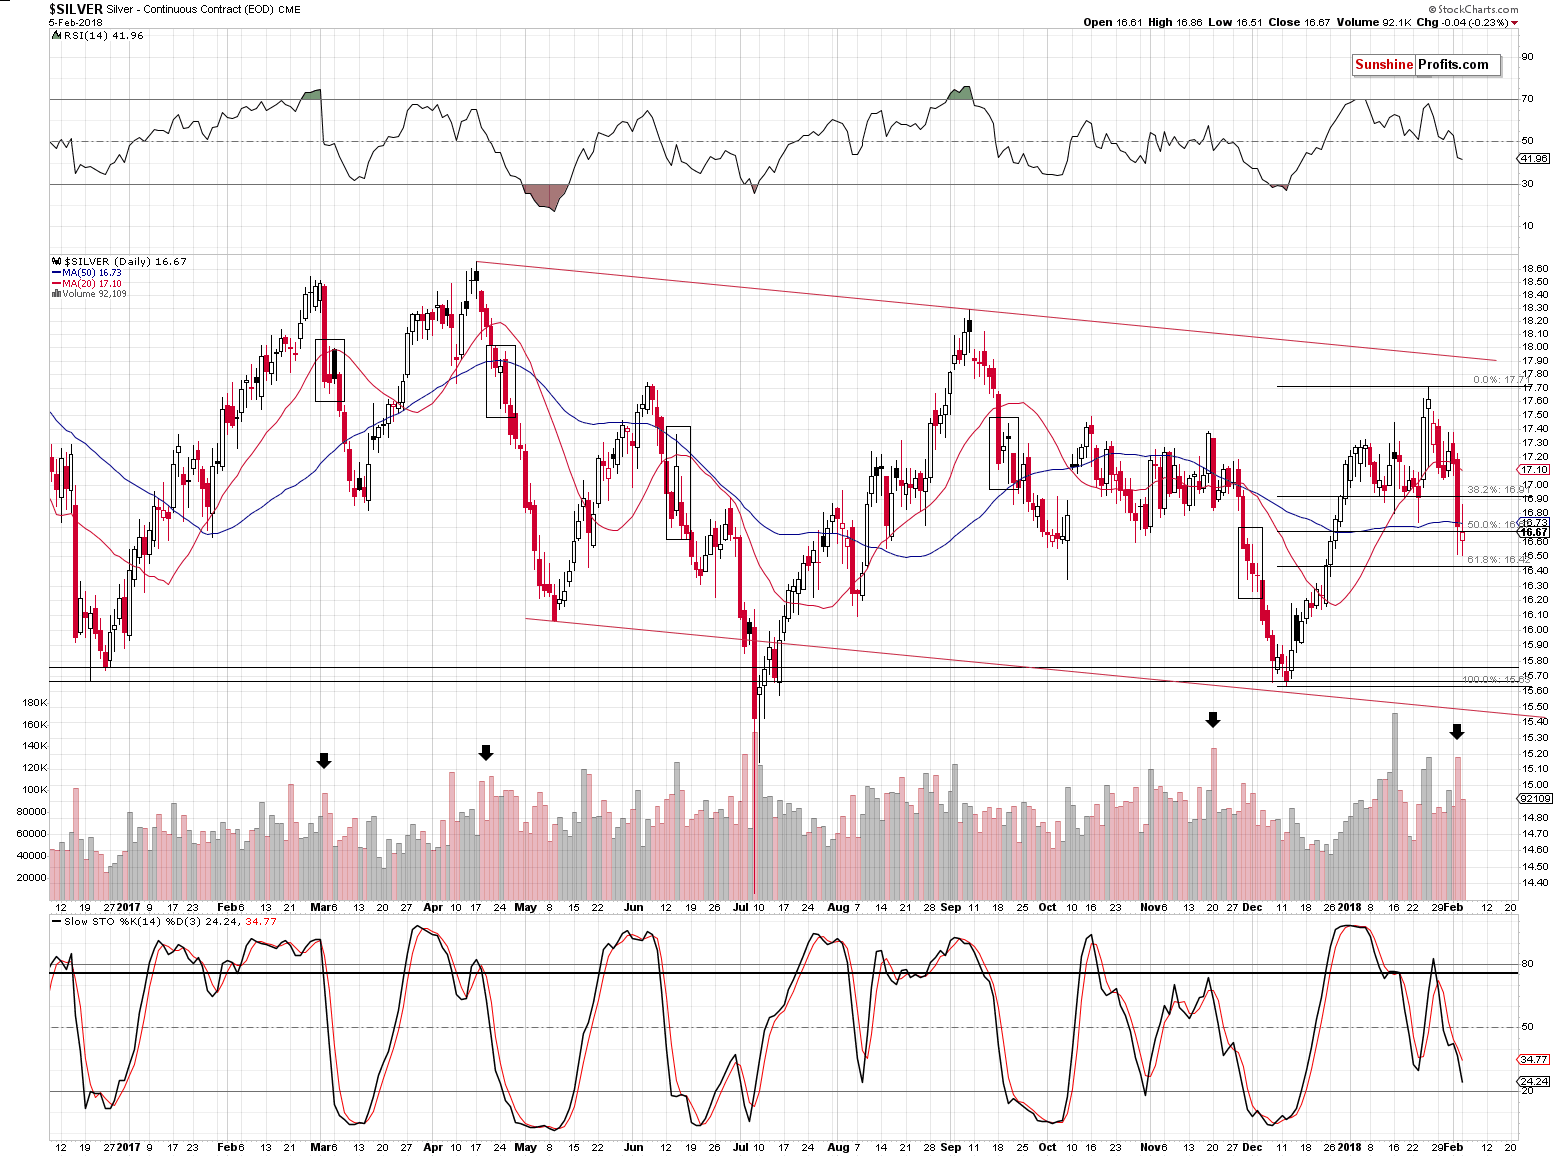
As far as silver is concerned, we see a corrective upswing that follows a sharp slide and a breakdown below the previous lows. A corrective upswing is something very natural at this stage of the decline and should not be viewed as a reversal.
We marked similar situations with black rectangles. Virtually all big declines had this kind of pause before the slide continued, so seeing one now is definitely nothing odd or bullish. Interestingly, in two cases (April 2017 and June 2017) silver corrected from below the 50-day moving average to slightly above it only to plunge in the following days. So far, the price action is similar.
Please note that the pauses didn’t take more than a couple of days, so it seems that this pause is over or about to be over.
Summing up, the USD’s recent epic turnaround along with gold’s extraordinary weakness relative to the USD’s movement along with multiple bearish confirmations paint a very bearish picture for the precious metals market for the following weeks. The situation was very bearish for PMs based on the above, but the record-breaking weekly and monthly volume levels in gold took the bearishness to a new – even more extreme – level. Gold’s inability to move much higher despite the stocks’ 4% decline and a rally in the Japanese yen shows that the market doesn’t really want to move up – it wants to move lower.
The mining stocks’ underperformance and the breakdown in the HUI to gold ratio below the 2016 and 2017 lows suggest that the big decline is already underway.
On a side note, please note that our bearish comments on the precious metals sector doesn’t make us an enemy of gold and silver investors – it makes us a true (!) friend. If you ask your friends how you look before going to an important meeting, everyone will tell you that you look great regardless of the truth as they will prefer not to be the ones that ruin your mood by saying something unpleasant. But a true friend will tell you how things really are, so that you can fix something before your leave. This may be unpleasant, but ultimately, it’s the second approach that benefits you. Most gold promoters will want you to think that gold is going to go higher no matter what happens and all you should do is buy, buy, buy. And then buy some more. They don’t want to risk upsetting you. But not us. We’re that true friend that tells you what they think and why, regardless of the possibility of being unpleasant – so that you can benefit more. In this case, if we’re correct about the bearish outlook for the precious metals, it will be much more profitable to be buying at lower prices than at the current ones.
So, in our view, the outlook for the precious metals market is friendly bearish. The precious metals market is likely to move much higher in the coming years, but if we’re correct about the medium-term decline first, then the best buying opportunity is still ahead of us.
As always, we will keep you – our subscribers – informed.
To summarize:
Trading capital (supplementary part of the portfolio; our opinion): Full short positions (200% of the full position) in gold, silver and mining stocks are justified from the risk/reward perspective with the following stop-loss orders and initial target price levels:
- Gold: initial target price: $1,218; stop-loss: $1,382; initial target price for the DGLD ETN: $53.98; stop-loss for the DGLD ETN $37.68
- Silver: initial target price: $14.63; stop-loss: $17.82; initial target price for the DSLV ETN: $33.88; stop-loss for the DSLV ETN $20.88
- Mining stocks (price levels for the GDX ETF): initial target price: $19.22; stop-loss: $26.14; initial target price for the DUST ETF: $39.88; stop-loss for the DUST ETF $15.78
In case one wants to bet on junior mining stocks' prices (we do not suggest doing so – we think senior mining stocks are more predictable in the case of short-term trades – if one wants to do it anyway, we provide the details), here are the stop-loss details and initial target prices:
- GDXJ ETF: initial target price: $27.82; stop-loss: $38.22
- JDST ETF: initial target price: $94.88 stop-loss: $37.78
Long-term capital (core part of the portfolio; our opinion): No positions (in other words: cash)
Insurance capital (core part of the portfolio; our opinion): Full position
Important Details for New Subscribers
Whether you already subscribed or not, we encourage you to find out how to make the most of our alerts and read our replies to the most common alert-and-gold-trading-related-questions.
Please note that the in the trading section we describe the situation for the day that the alert is posted. In other words, it we are writing about a speculative position, it means that it is up-to-date on the day it was posted. We are also featuring the initial target prices, so that you can decide whether keeping a position on a given day is something that is in tune with your approach (some moves are too small for medium-term traders and some might appear too big for day-traders).
Plus, you might want to read why our stop-loss orders are usually relatively far from the current price.
Please note that a full position doesn’t mean using all of the capital for a given trade. You will find details on our thoughts on gold portfolio structuring in the Key Insights section on our website.
As a reminder – “initial target price” means exactly that – an “initial” one, it’s not a price level at which we suggest closing positions. If this becomes the case (like it did in the previous trade) we will refer to these levels as levels of exit orders (exactly as we’ve done previously). Stop-loss levels, however, are naturally not “initial”, but something that, in our opinion, might be entered as an order.
Since it is impossible to synchronize target prices and stop-loss levels for all the ETFs and ETNs with the main markets that we provide these levels for (gold, silver and mining stocks – the GDX ETF), the stop-loss levels and target prices for other ETNs and ETF (among other: UGLD, DGLD, USLV, DSLV, NUGT, DUST, JNUG, JDST) are provided as supplementary, and not as “final”. This means that if a stop-loss or a target level is reached for any of the “additional instruments” (DGLD for instance), but not for the “main instrument” (gold in this case), we will view positions in both gold and DGLD as still open and the stop-loss for DGLD would have to be moved lower. On the other hand, if gold moves to a stop-loss level but DGLD doesn’t, then we will view both positions (in gold and DGLD) as closed. In other words, since it’s not possible to be 100% certain that each related instrument moves to a given level when the underlying instrument does, we can’t provide levels that would be binding. The levels that we do provide are our best estimate of the levels that will correspond to the levels in the underlying assets, but it will be the underlying assets that one will need to focus on regarding the signs pointing to closing a given position or keeping it open. We might adjust the levels in the “additional instruments” without adjusting the levels in the “main instruments”, which will simply mean that we have improved our estimation of these levels, not that we changed our outlook on the markets. We are already working on a tool that would update these levels on a daily basis for the most popular ETFs, ETNs and individual mining stocks.
Our preferred ways to invest in and to trade gold along with the reasoning can be found in the how to buy gold section. Additionally, our preferred ETFs and ETNs can be found in our Gold & Silver ETF Ranking.
As a reminder, Gold & Silver Trading Alerts are posted before or on each trading day (we usually post them before the opening bell, but we don't promise doing that each day). If there's anything urgent, we will send you an additional small alert before posting the main one.
=====
Latest Free Trading Alerts:
At the end of last week, gold encountered a couple of headwinds. Will they topple the yellow metal?
Will Hawkish Fed and Strong Payrolls Blow Out Gold Rally?
=====
Hand-picked precious-metals-related links:
PRECIOUS-Gold barely rises since equity sell-off seen as blip
Monday massacre: Gold price rises as stocks crater
Gold Jewelry Demand Seen at 20-Year Low in United Arab Emirates
=====
In other news:
Stock sell-off overdue, investors lick their wounds and hunt
Fed's Kashkari says needs to see faster wage and price growth
U.S. regulators to back more oversight of virtual currencies
Bitcoin Breaks Below $6,000 as Cryptocurrency Exodus Accelerates
How to Keep Cool When the Market Is Not
=====
Thank you.
Sincerely,
Przemyslaw Radomski, CFA
Founder, Editor-in-chief, Gold & Silver Fund Manager
Gold & Silver Trading Alerts
Forex Trading Alerts
Oil Investment Updates
Oil Trading Alerts

