

Briefly: In our opinion, full (150% of the regular full position) speculative short positions in gold, silver and mining stocks are justified from the risk/reward perspective at the moment of publishing this alert.
The situation in the precious metals market remains in tune with what we wrote previously, so we’ll comment on yesterday’s developments rather briefly and we’ll move on to something you may find more interesting. Quite a lot is being said about the USD and the interest rate hikes and how another move higher in the latter is not likely to cause the USD to rally as its already in the price or because the previous few moves didn’t trigger major rallies when they were seen. We’ll put the above to the test. What kind of test? You’ll see in just a few paragraphs and in the meantime, let’s take a look at gold, silver and mining stocks (chart courtesy of http://stockcharts.com).
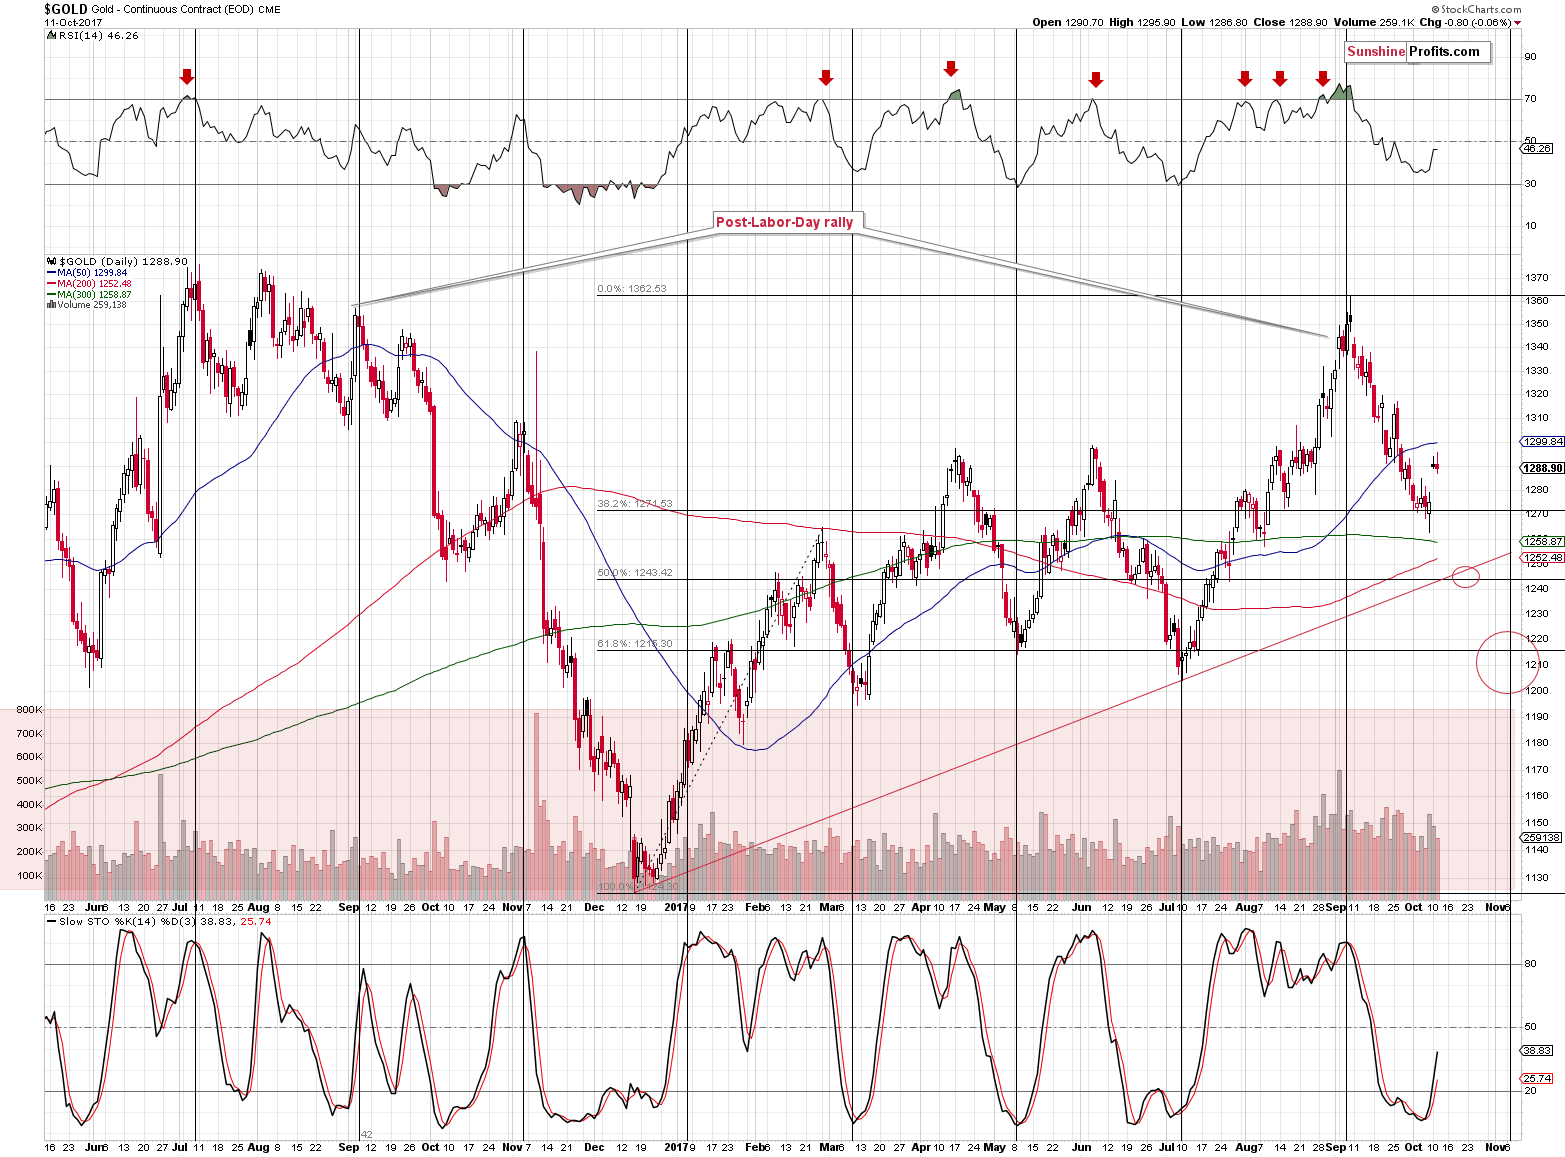
Gold moved back and forth, but on average it closed a bit higher (at least based on kitco’s data). Today’s pre-market high so far is $1,297 – very close to the price levels that we described previously. Consequently, our previous comments on gold remain up-to-date:
Gold moved higher, but not above the $1,300 level, so what we’re seeing right now seems to be just a verification of the breakdown below this level and the previous 2017 highs.
The resistance of the $1,300 level is strengthened by the 50-day moving average. In September and October 2016 gold also moved back to/above the 50-day MA before sliding further. Yesterday’s intraday high was $1,294 – very close to this level.
(…)
So, if the similarity is to continue, gold could (! – doesn’t have to) rally almost to the August 31st closing price, which approximately corresponds to the declining, long-term resistance line and the psychologically important $1,300 level. Consequently, the $1,300 level and its surrounding appears to be the maximum target for the upswing that might have just started. A move to this level would not only not invalidate the bearish long-term analogy – it would be in tune with it.
As you can see on the above chart, gold has not yet reached the resistance line, which is currently at about $1,309. Overall, from the technical point of view not much changed – gold appears to be before a big slide and this week’s upswing doesn’t seem to be anything meaningful.
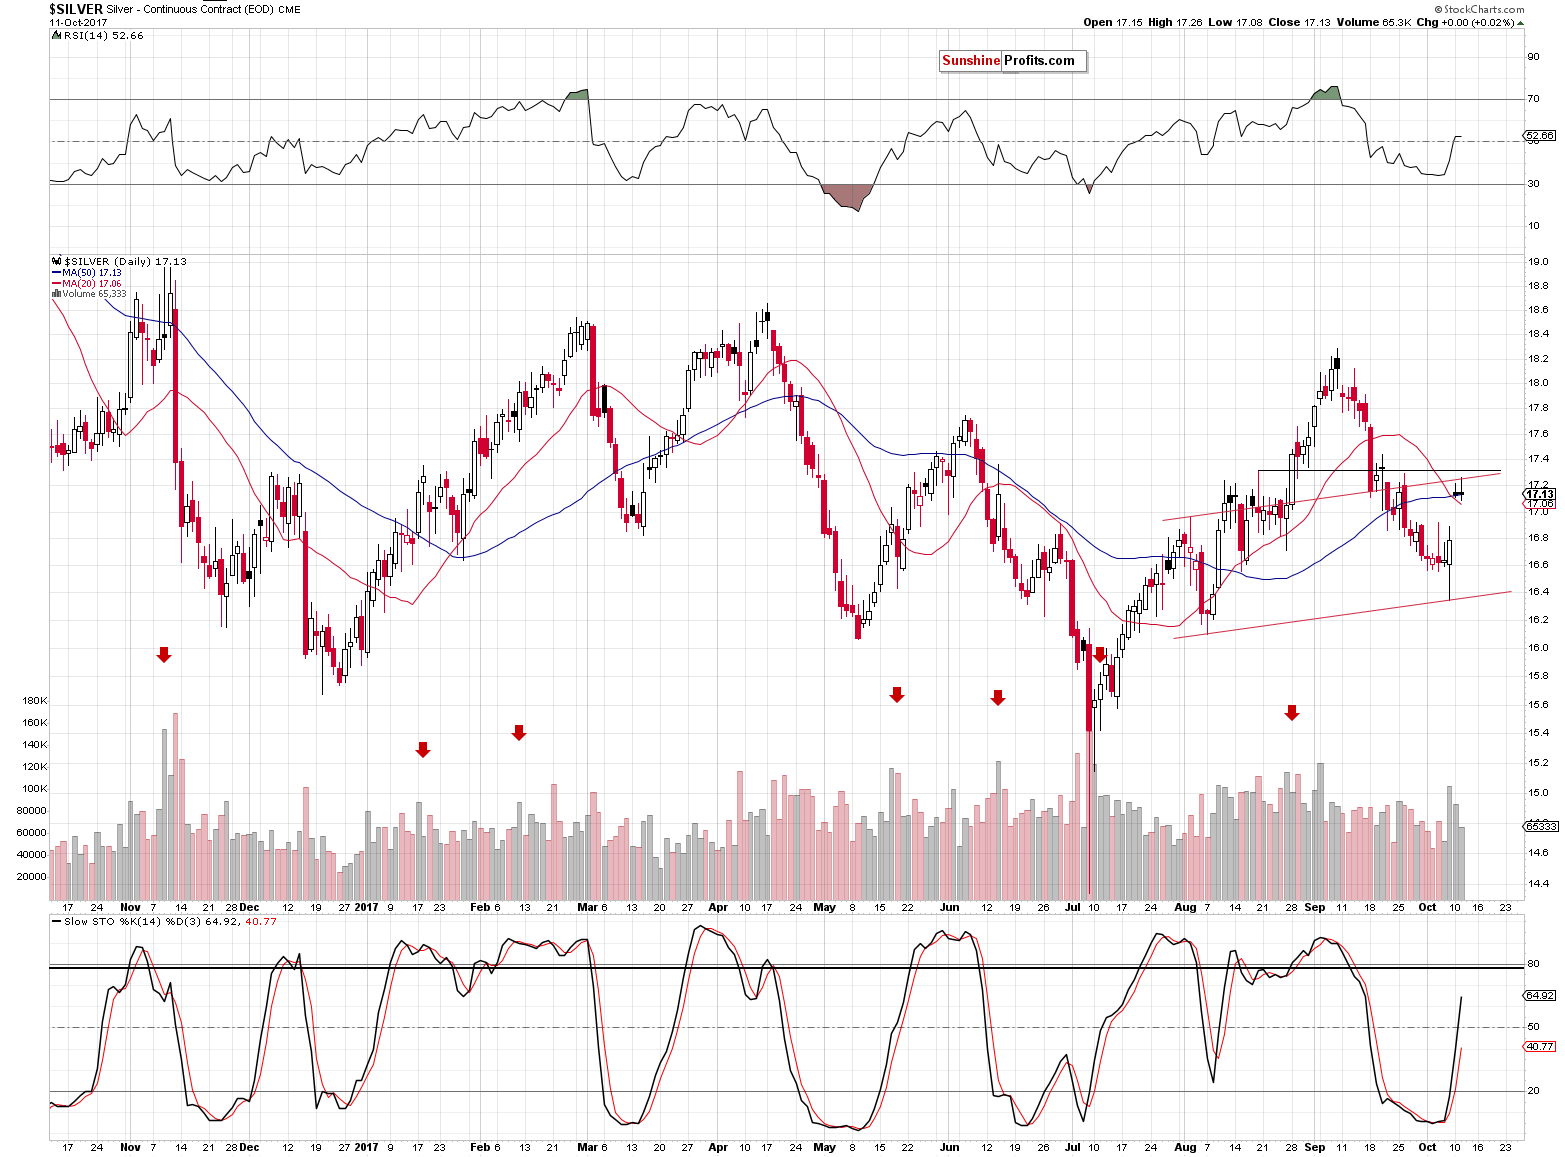
Silver ended yesterday’s session without bigger changes, so our previous comments on silver also remain up-to-date:
Please note that silver moved back and forth around the $17 level for more than 2 weeks in August, so it wouldn’t be surprising to see some back and forth action also this time.
The moves are quite wide, but that’s exactly what we’re seeing. The white metal was below $17 and is currently back above it. The nearby resistance levels are created by the combination of moving averages (at about $17.10), the rising red support line and the mid-August intraday high at $17.32. Which of these levels is most likely to be reached and trigger a reversal? We’d say that the $17.10 - $17.25 area as that’s where the most daily highs are located.
Silver closed within the above area, but let’s keep in mind that even if it moves a bit higher, it would not change much.
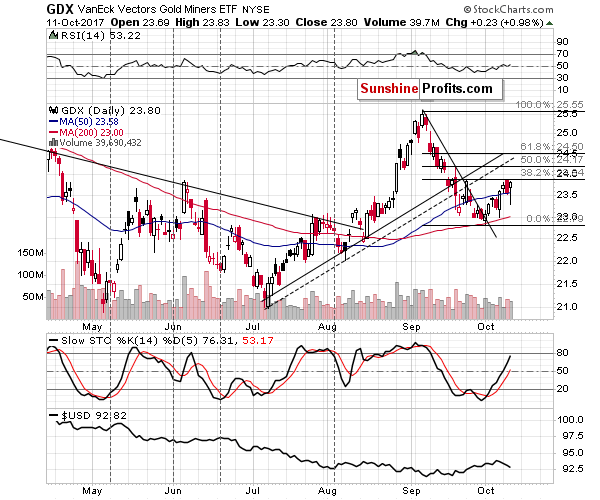
Mining stocks moved higher yesterday, but they didn’t move to new highs and remain below the 38.2% Fibonacci retracement level. Gold is making new highs, but miners don’t – the underperformance of the latter continues to paint a bearish picture for the following weeks. The self-similarity pattern in mining stocks also continues to have very bearish implications for the following weeks and months.
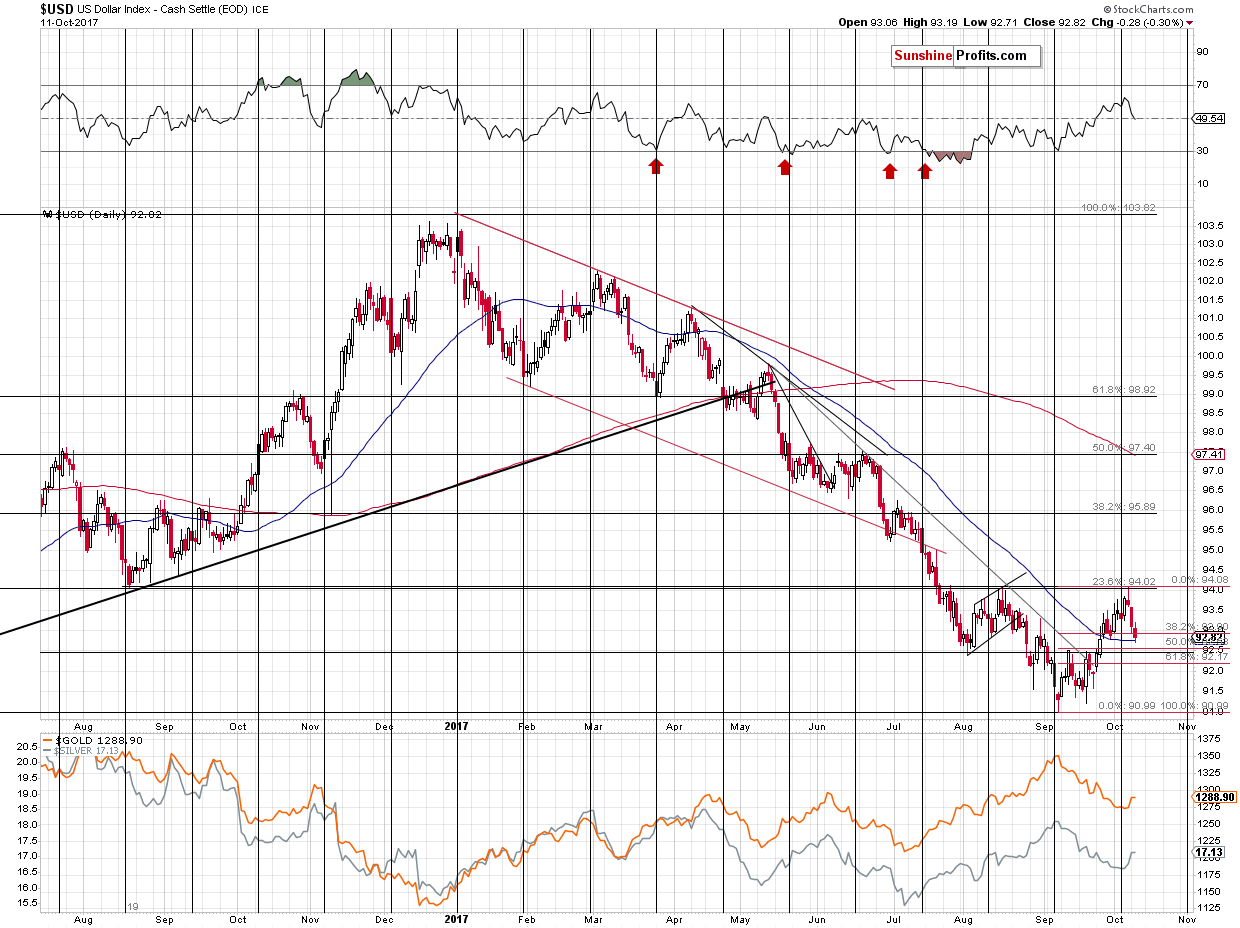
In yesterday’s alert, we wrote the following about the USD Index:
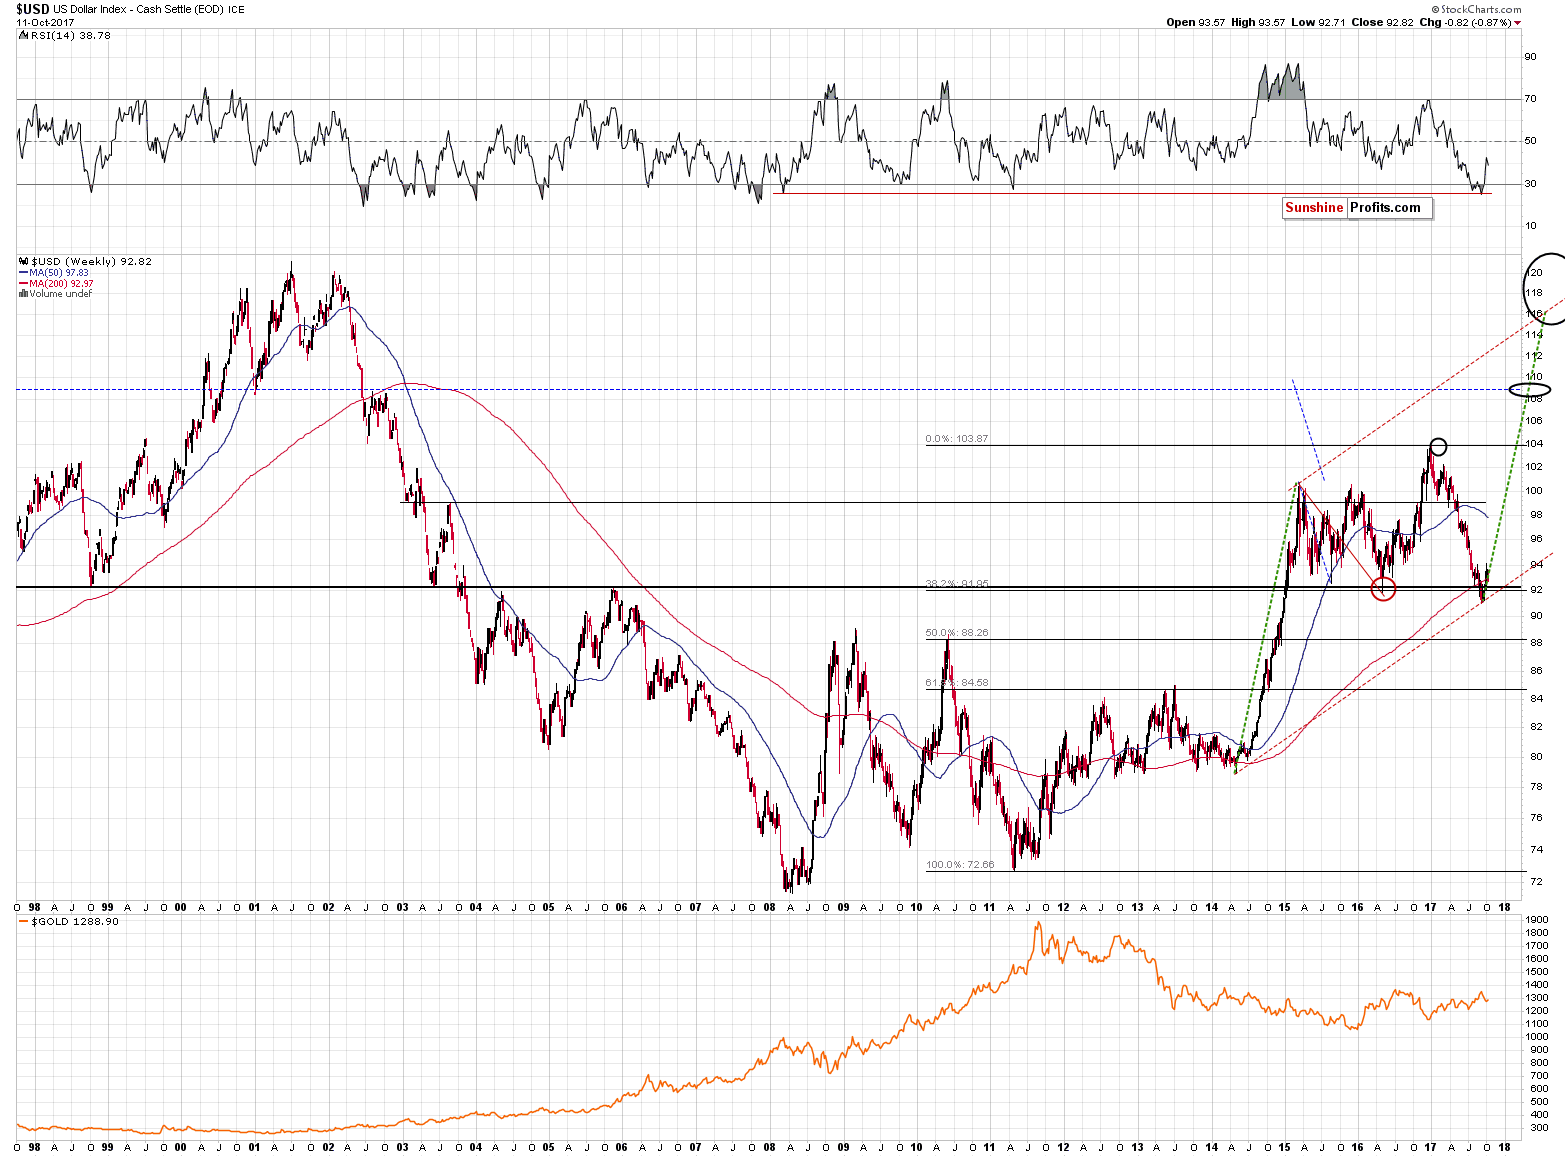
As far as the short term is concerned, we see that the USD Index has already reached its 32.8% Fibonacci retracement level, which could be something that triggers a rebound – it did twice in August. If the above doesn’t stop the decline, then the 92.5 level is very likely to do the job. That’s where we have the 50% Fibonacci retracement, the early September high and a correction to it would be quite in tune with what we saw at the beginning of the previous huge upswing in the USD. On the long-term chart you can see the small dip in mid-2014 – if the follow-up action is to be similar, should one really be concerned about this temporary pullback? Not really.
Today’s pre-market low for the USD Index is (so far) 92.8, which means that it’s very close to the mentioned 92.5 target. The short-term downside, therefore, seems very limited while the medium-term upside remains substantial.
Since we are already discussing the USD Index, let’s analyze the USD Index – interest rates link.
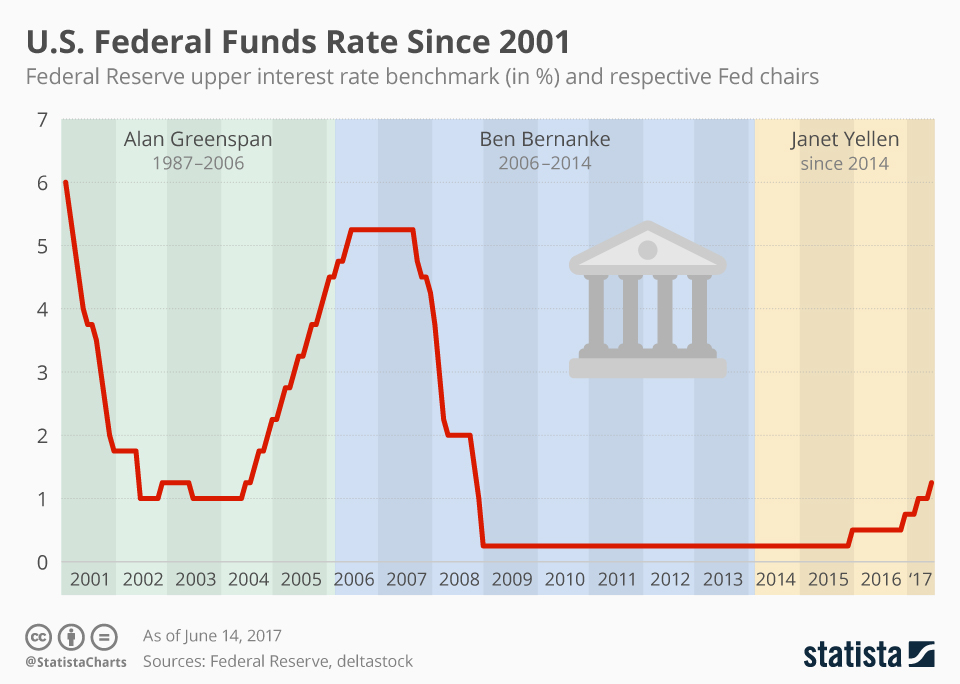
There is only one similar case of rising interest rates in the recent past and that is the 2002 – 2004/2005 period. Here’s exactly what happened and how the USD Index responded:
- The first interest rate hike took place at the end of 2002 after which there were no increases for a long time. The USD Index declined.
- Interest rates were increased for the second time in mid-2014 and it was the start of a series of rate hikes. The USD Index declined.
- Interest rates were increased for the third time (second time in a row) relatively shortly after the previous increase. The USD Index declined.
- Interest rates were increased for the fourth time (third time in a row) close to the end of 2004. The USD Index bottoms shortly (from the long-term perspective) thereafter and starts a yearly rally.
Now, here’s the recent history of rate hikes:
- The first interest rate hike took place at the end of 2015 after which there were no increases for a long time. The USD Index declined (it recovered later in 2015, but the initial reaction was a decline).
- Interest rates were increased for the second time at the end of 2016 and it was a start of a series of rate hikes. The USD Index declined.
- Interest rates were increased for the third time (second in a row) relatively shortly after the previous increase. The USD Index declined.
- Interest rates were increased for the fourth time (third in the series) close to the middle of the year. The USD Index bottoms shortly (from the long-term perspective) thereafter and…. Starts a yearly rally?
The similarities are striking and the implications appear very bullish for the USD, especially that the official plan (it’s being executed so far) is to continue to increase the interest rates.
- What about gold? Didn’t it rally in 2005?
It did, but it’s important to keep in mind that it rallied in the second part of the year – after the initial top in the USD. Gold didn’t rally in the first half of the 2005 – it moved sideways. Now, this may not seem bearish, but gold was in a very strong and stable uptrend at that time and this sideways trading was the first time since the bull market’s inception that gold had moved below the clear long-term support line. The bull market was too young and the fundamentals too favorable for gold to decline substantially, so a bigger pause was the most bearish thing that could realistically happen.
This time gold is not within a clearly defined uptrend. In fact, it’s been trading sideways between approximately $1,000 and $1,400 for a few years. What can it currently do if the USD soars and continues to climb for at least 6 months? It could decline and break below an important support ($1,000), just like it broke below it in 2005. Once it does and enough people panic, the bottom will be formed and a huge comeback rally is likely to follow.
Summing up, gold, silver and mining stocks all seem to be very close to their upside targets for this short-term corrective upswing. Mining stocks have already declined after reaching our target price, while gold and silver area close enough for the top to be already in, but at the same time they still have some limited room to rally. Silver outperformed while miners declined, which is a classic bearish confirmation. Consequently, it seems that the rally will be over sooner rather than later. Those who engaged in day-trading and aimed to profit on the short-term upswing in the precious metals sector may want to close their long positions at this time or prepare to do so shortly and switch to short ones.
The outlook for the precious metals sector for the following months remains bearish and the analogy between the two most recent series of interest rate hikes confirms it.
As always, we will keep you – our subscribers – informed.
To summarize:
Trading capital (supplementary part of the portfolio; our opinion): Short positions (150% of the full position) in gold, silver and mining stocks are justified from the risk/reward perspective with the following stop-loss orders and initial target price levels / profit-take orders:
- Gold: initial target price level: $1,063; stop-loss: $1,366; initial target price for the DGLD ETN: $81.88; stop-loss for the DGLD ETN $38.74
- Silver: initial target price: $13.12; stop-loss: $19.22; initial target price for the DSLV ETN: $46.18; stop-loss for the DSLV ETN $17.93
- Mining stocks (price levels for the GDX ETF): initial target price: $9.34; stop-loss: $26.34; initial target price for the DUST ETF: $143.56; stop-loss for the DUST ETF $21.37
In case one wants to bet on junior mining stocks' prices (we do not suggest doing so – we think senior mining stocks are more predictable in the case of short-term trades – if one wants to do it anyway, we provide the details), here are the stop-loss details and initial target prices:
- GDXJ ETF: initial target price: $14.13; stop-loss: $45.31
- JDST ETF: initial target price: $417.04; stop-loss: $43.12
Long-term capital (core part of the portfolio; our opinion): No positions (in other words: cash)
Insurance capital (core part of the portfolio; our opinion): Full position
Important Details for New Subscribers
Whether you already subscribed or not, we encourage you to find out how to make the most of our alerts and read our replies to the most common alert-and-gold-trading-related-questions.
Please note that the in the trading section we describe the situation for the day that the alert is posted. In other words, it we are writing about a speculative position, it means that it is up-to-date on the day it was posted. We are also featuring the initial target prices, so that you can decide whether keeping a position on a given day is something that is in tune with your approach (some moves are too small for medium-term traders and some might appear too big for day-traders).
Plus, you might want to read why our stop-loss orders are usually relatively far from the current price.
Please note that a full position doesn’t mean using all of the capital for a given trade. You will find details on our thoughts on gold portfolio structuring in the Key Insights section on our website.
As a reminder – “initial target price” means exactly that – an “initial” one, it’s not a price level at which we suggest closing positions. If this becomes the case (like it did in the previous trade) we will refer to these levels as levels of exit orders (exactly as we’ve done previously). Stop-loss levels, however, are naturally not “initial”, but something that, in our opinion, might be entered as an order.
Since it is impossible to synchronize target prices and stop-loss levels for all the ETFs and ETNs with the main markets that we provide these levels for (gold, silver and mining stocks – the GDX ETF), the stop-loss levels and target prices for other ETNs and ETF (among other: UGLD, DGLD, USLV, DSLV, NUGT, DUST, JNUG, JDST) are provided as supplementary, and not as “final”. This means that if a stop-loss or a target level is reached for any of the “additional instruments” (DGLD for instance), but not for the “main instrument” (gold in this case), we will view positions in both gold and DGLD as still open and the stop-loss for DGLD would have to be moved lower. On the other hand, if gold moves to a stop-loss level but DGLD doesn’t, then we will view both positions (in gold and DGLD) as closed. In other words, since it’s not possible to be 100% certain that each related instrument moves to a given level when the underlying instrument does, we can’t provide levels that would be binding. The levels that we do provide are our best estimate of the levels that will correspond to the levels in the underlying assets, but it will be the underlying assets that one will need to focus on regarding the signs pointing to closing a given position or keeping it open. We might adjust the levels in the “additional instruments” without adjusting the levels in the “main instruments”, which will simply mean that we have improved our estimation of these levels, not that we changed our outlook on the markets. We are already working on a tool that would update these levels on a daily basis for the most popular ETFs, ETNs and individual mining stocks.
Our preferred ways to invest in and to trade gold along with the reasoning can be found in the how to buy gold section. Additionally, our preferred ETFs and ETNs can be found in our Gold & Silver ETF Ranking.
As a reminder, Gold & Silver Trading Alerts are posted before or on each trading day (we usually post them before the opening bell, but we don't promise doing that each day). If there's anything urgent, we will send you an additional small alert before posting the main one.
=====
Latest Free Trading Alerts:
Yesterday, the minutes of the Federal Reserve’s September meeting were released. What do they say about the Fed’s stance and what do they mean for the gold market?
FOMC Minutes from September 2017 Meeting and Gold
S&P 500 index gained 0.2% on Tuesday, as it remained close to new record high. Will uptrend continue despite short-term overbought conditions? There have been no confirmed negative signals so far.
More New S&P 500 Record Highs Or Topping Action?
=====
Hand-picked precious-metals-related links:
Germans Have Quietly Become the World's Biggest Buyers of Gold
=====
In other news:
Minutes of the Federal Open Market Committee September 19–20, 2017
Bonds Rise, Dollar Drifts on Fed Inflation Debate: Markets Wrap
GLOBAL MARKETS-Dollar suffers from Fed's inflation headache
Brexit Talks Edge Backward as Time-Pressed U.K. Braces for Worst
UK banks plan biggest squeeze on consumer credit since 2008
IMF: higher taxes for rich will cut inequality without hitting growth
Bitcoin Surges Past $5,000 for the First Time Amid Staggering Cryptocurrency Run
=====
Thank you.
Sincerely,
Przemyslaw Radomski, CFA
Founder, Editor-in-chief, Gold & Silver Fund Manager
Gold & Silver Trading Alerts
Forex Trading Alerts
Oil Investment Updates
Oil Trading Alerts

