

Briefly: In our opinion, full (100% of the regular size of the position) speculative long positions in gold, silver and mining stocks are justified from the risk/reward perspective at the moment of publishing this alert. We are moving the target for gold $3 higher and we are changing all initial targets to binding profit-take levels.
Gold moved higher just a little yesterday, but that was enough for mining stocks to rally more visibly. Silver, on the other hand, declined modestly. Which of these markets is showing the true direction in which the entire sector is about to move? Multiple short-term signals combined with the big, medium-term signal from the Japanese stocks paint a quite clear roadmap for the coming days and weeks.
Let’s start with the former. The part of today’s alert in which we discuss the short-term developments is, to a large extent, a continuation and repeat of yesterday’s issue. The reason is that what we saw yesterday was very similar to what we had seen on Wednesday. Namely, not much happened and what happened supported our previous outlook.
Let’s start with gold (chart courtesy of http://stockcharts.com).
Gold moved higher by $1 yesterday, so everything that we wrote in yesterday’s alert remains up-to-date:
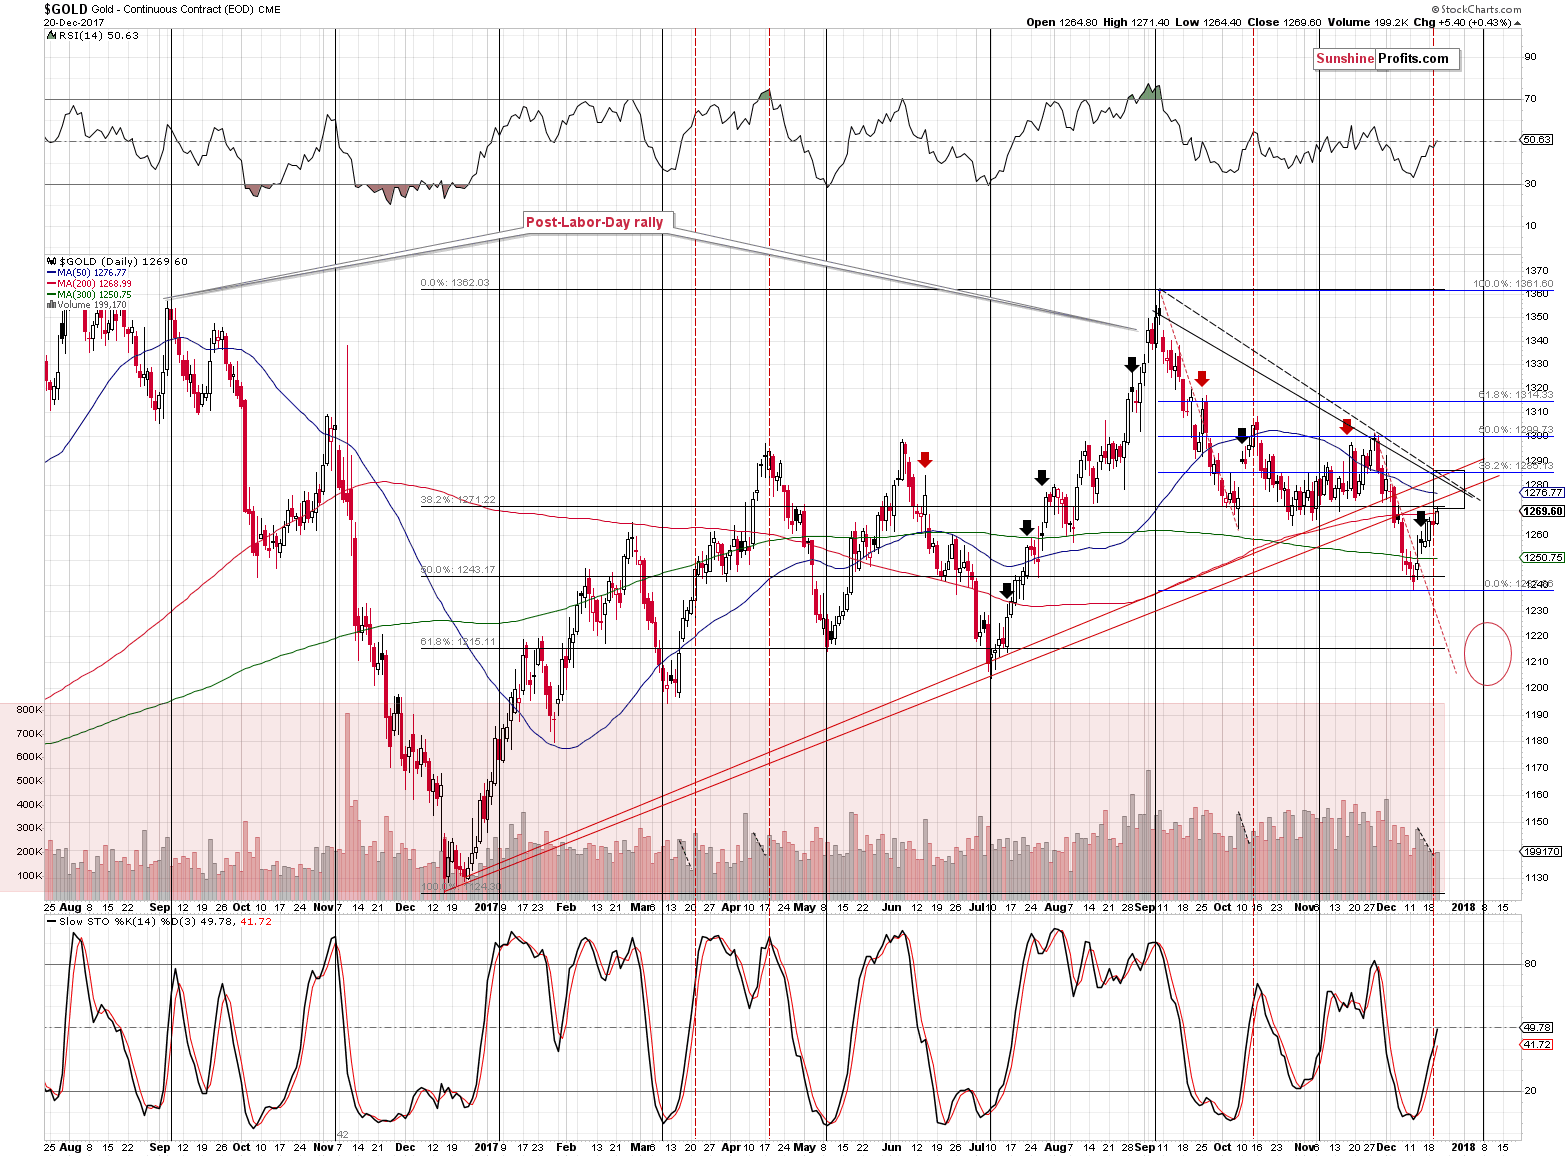
The price of gold has been moving steadily higher in the past several days and it moved to the lower border of our target area.
So, is the rally ending?
Ending – perhaps. Ended – most likely no.
The upper part of the target area is where most resistance levels coincide and since we haven’t seen any meaningful bearish confirmations, gold is likely to move higher in the short term. These resistance levels are:
- The rising red resistance line based on the previous major lows in terms of the daily closing prices.
- The declining black resistance line based on the September and November tops in terms of both: intraday and closing prices.
- The 38.2% Fibonacci retracement based on the September – December decline.
Moreover, the upper part of the target area (above $1,280) is slightly above the 50-day moving average and in the previous two months gold reversed and started to decline only after it moved a bit above this MA.
There is an additional thing that the above chart tells us.
It answers the “when” question.
There are two turning points that are about to be in play. The first one is today or tomorrow and it’s based on the apex of the triangle created by the two lines that we discussed in the bullet points. (…)
The apex of the triangle in gold is either today or tomorrow. Naturally, the turnaround is not imminent, but the above is enough for one to be on the lookout for bearish confirmations and be prepared to take profits by closing one’s long position shortly.
The second turning point is based directly on gold’s cyclical nature. It’s on January 8th, so it’s still relatively far, however, at the same time it’s something that we should keep in mind. If gold tops shortly as the first triangle’s apex suggests, then it could start a decline and form a temporary bottom close to January 8th.
Alternatively, we could see another wave up and the final top close to January 8th. Could the counter-trend upswing really last that long?
Yes, and we need to keep both possibilities in mind while monitoring the market for bullish and bearish confirmations. For now, we have an increasing number of bullish signs for the short term.
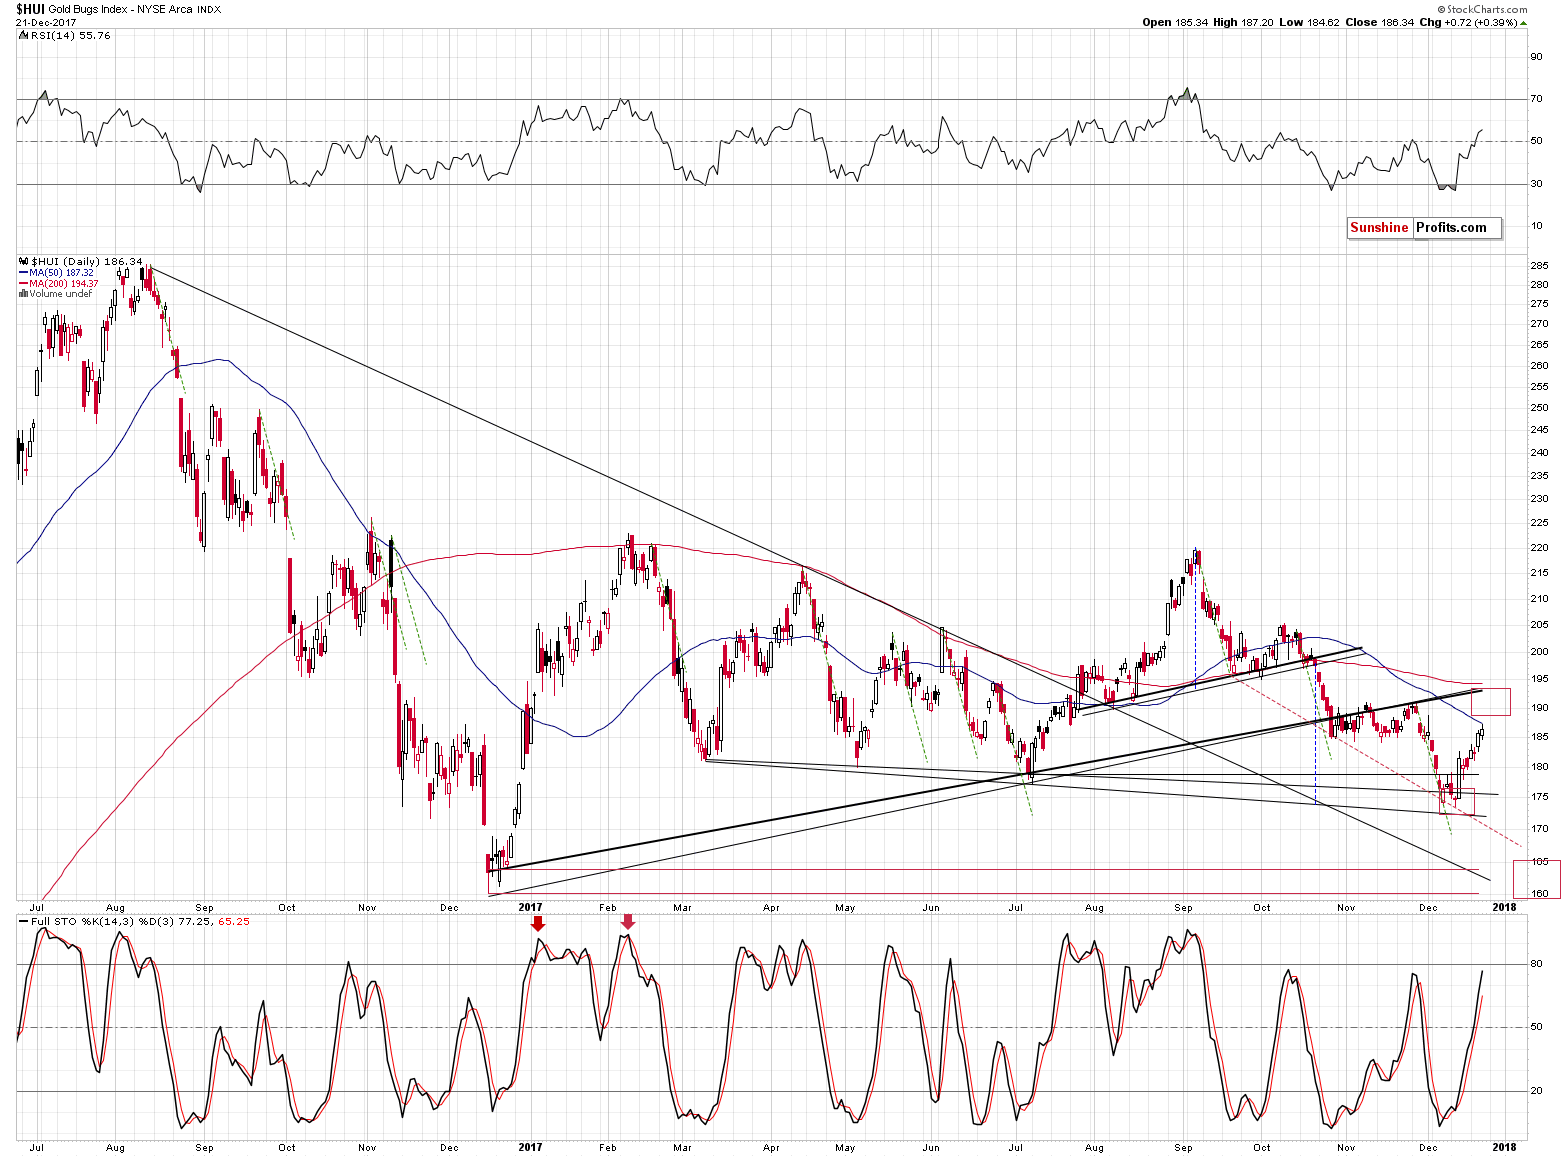
Mining stocks once again outperformed gold yesterday, so – again – what we wrote about the above charts previously, remains up-to-date:
First of all, mining stocks rallied outperforming gold, which is a classic bullish sign. The sizable volume during yesterday’s upswing adds to the bullish signal’s credibility. If the top was just around the corner, weakness in the miners should be present and we are seeing something opposite.
The volume during yesterday’s session wasn’t huge, but it was not low either. The bullish implications of miners’ relative strength remain up-to-date.
There’s another thing that’s worth keeping in mind. In June and July and, to some extent, also in the second half of September, when the HUI Index moved above the 50-day moving average, it moved higher sharply. If miners repeated such a sharp move today or in the following days, they could reach the 194 target level.
If the above happens and we see confirmation from the silver market, we’ll most likely take profits off the table and close the long positions while at the same time opening short ones. Still, we have definitely not seen such a confirmation so far.
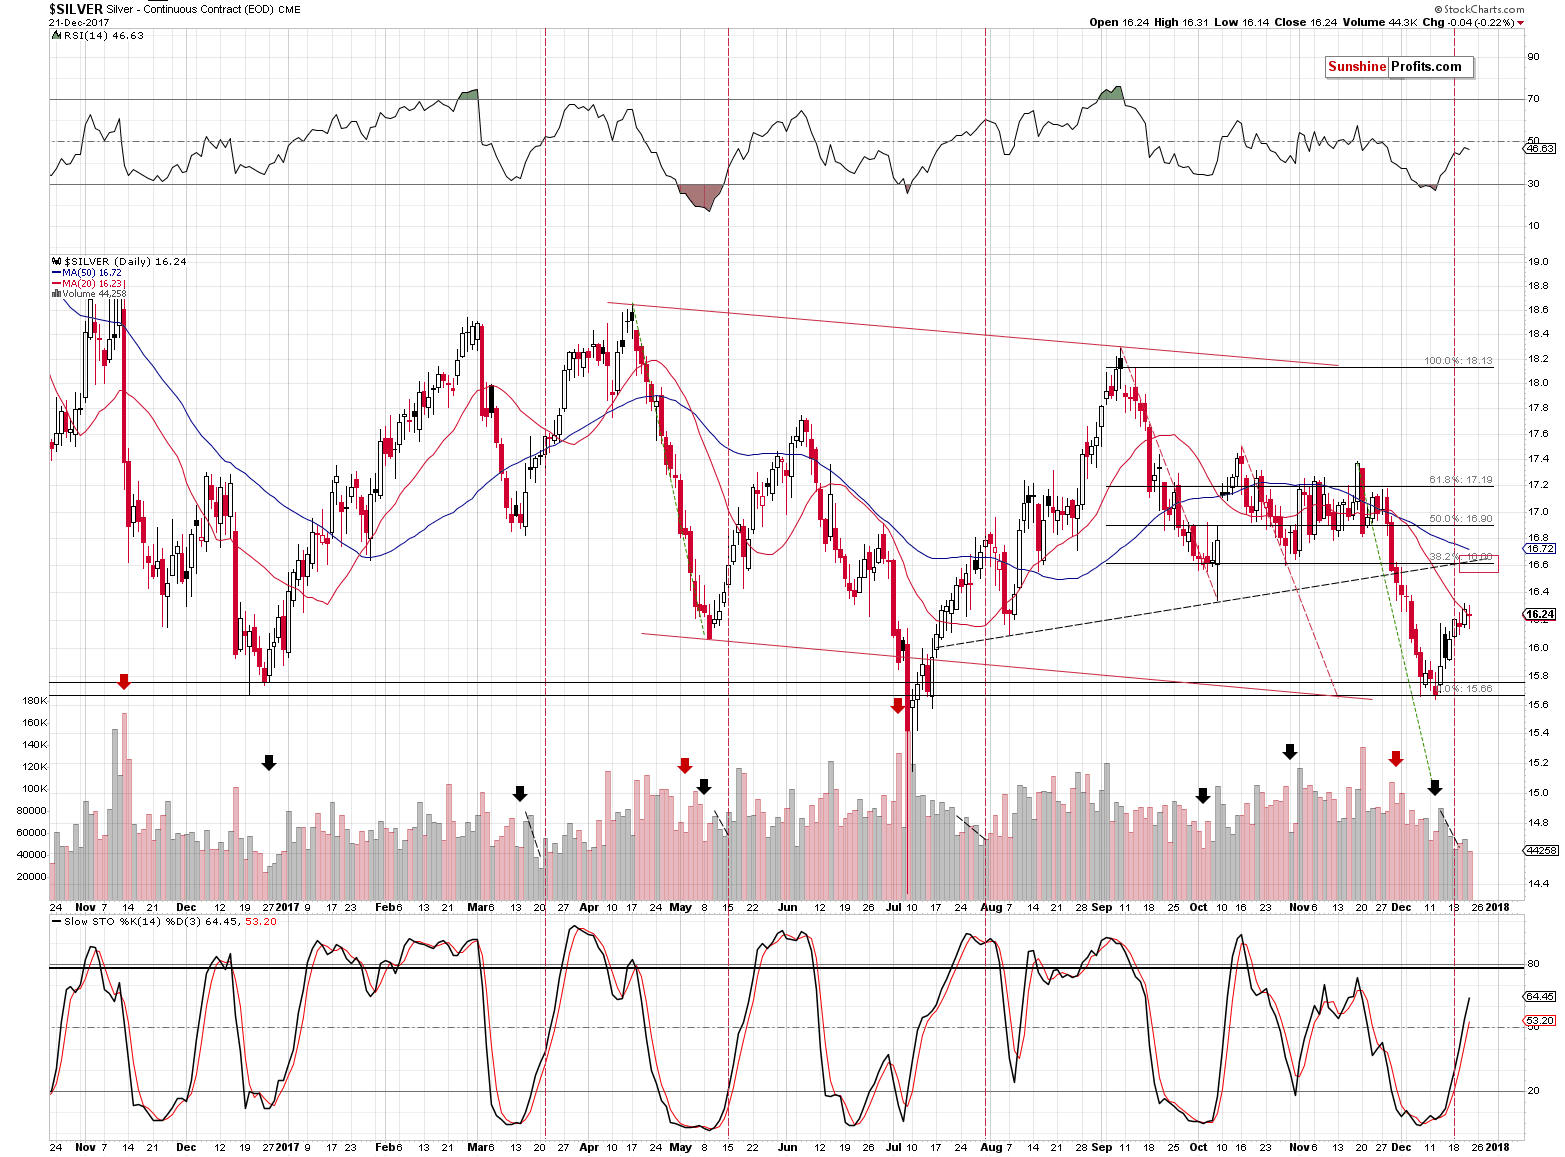
Silver moved 4 cents lower, so it definitely didn’t provide us with a confirmation in the form of quick outperformance. Without this important bearish confirmation, it seems that the top is not yet in. Will it be in after today’s or the following session? Knowing silver’s tendency to ignite big intraday moves, it’s certainly possible. At the same time, it’s possible that the rally will continue for several additional days. The best approach is to wait for the white metal to start its strong outperformance of gold and take action at that time. Naturally, we’ll keep you informed.
Meanwhile, the situation in the currency market remains unchanged and our previous comments also remain up-to-date:
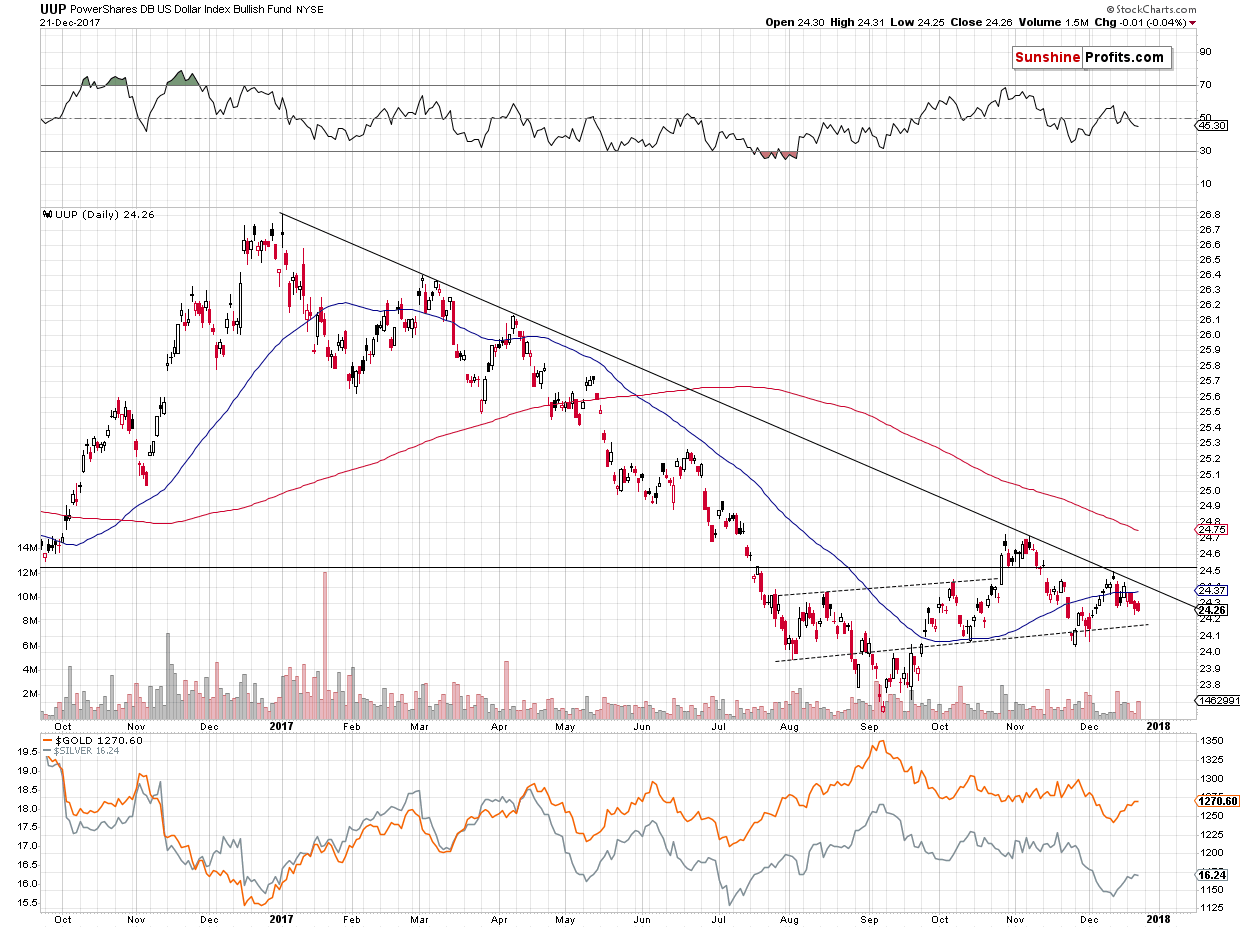
The USD Index could still move lower before turning up again – the October and November lows could be touched, but we think that a confirmed breakdown below them is not likely. The USD’s decline is likely to result in an upswing in the precious metals sector, so the above chart more or less confirms what we wrote earlier today.
The USD is close enough to the previous lows to reach them within just one or two sessions, but at the same time it’s far enough for the decline to these levels to take several days. Based on the way the USD declined in October, the former is more likely.
Before summarizing, let’s put the bullish case into proper perspective, looking at the relationship between gold and Nikkei 225.
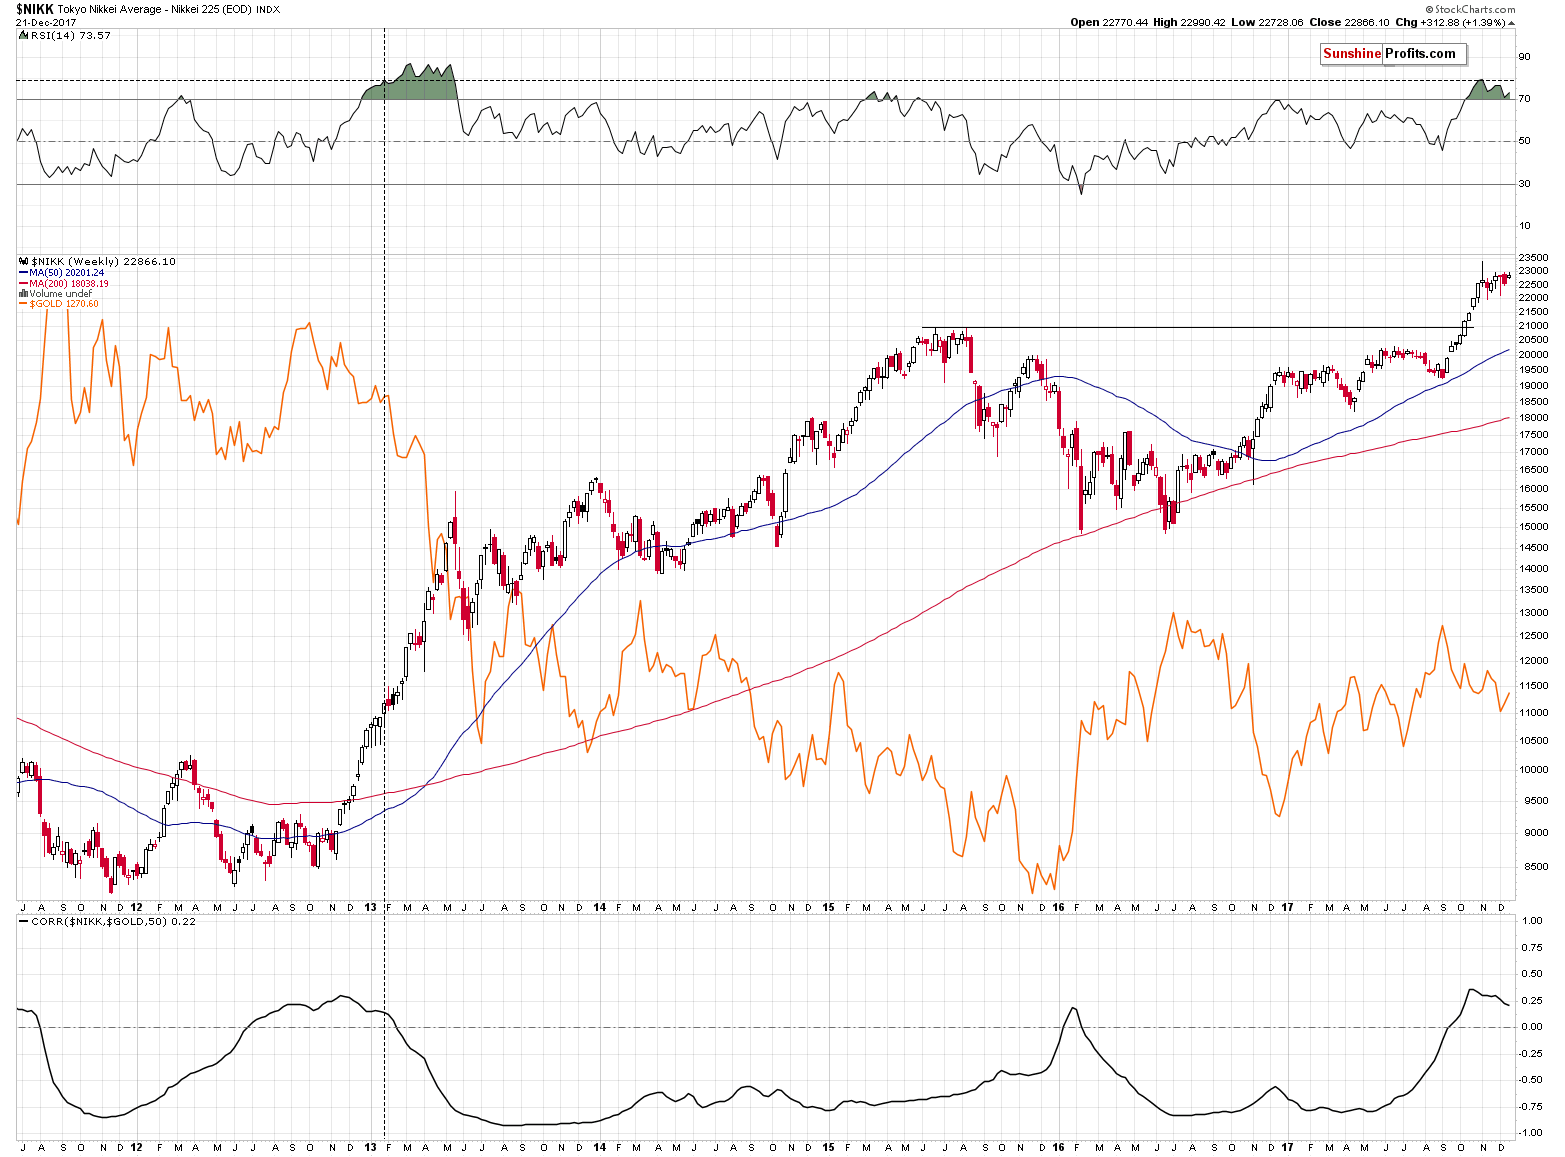
We featured the above chart in October and back then we commented on the Japanese stocks’ breakout in the following way:
The correlation between Nikkei 225 and gold moved above 0 and the RSI just moved to the 30 level. There was only one similar situation in the recent past and that is when Nikkei was breaking above its previous weekly high. Well, since the Nikkei just broke above its 2015 high in weekly terms, the situations are now very similar.
Back in 2015 it meant that a big rally was about to unfold and the same appears to be likely also this time. Why should we – gold and silver investors – bother with the above analysis? Because Japanese stocks tend to move in the opposite direction to the price of gold in the medium term (in the short-term their moves are not necessarily aligned).
In particular, we should care about the above because the only similar (in fact, very similar) situation in Nikkei was when gold was after the late-2012 top and was during a breather before the huge decline that took place in the following months. This is the same similarity that other long-term factors indicated previously, which means that this scenario is now even more likely to take place in the following weeks and months.
The analogy to the 2012 – 2013 decline in gold and the simultaneous rally in Nikkei remains up-to-date. The latter continued to move higher after the breakout, while gold moved lower. The Japanese stocks are currently taking a breather, similarly to how they paused at the end of 2012 and in the first weeks of 2013. Gold is also correcting.
But, did the pause in Nikkei or a corrective upswing in gold change anything in early 2013? No – the price moves continued for many weeks. Consequently, we can expect that gold will resume its decline either shortly or within the next few weeks.
Summing up, the medium-term outlook for the precious metals market didn’t change based on last and this week’s developments and it remains bearish, but the short-term outlook is bullish. The declining volume in gold might indicate that the top is going to be seen relatively soon, but it doesn’t seem that it has been formed yet. Yesterday’s strength in mining stocks and the lack of it in silver suggest that the precious metals sector is going to move higher, at least in the very short term.
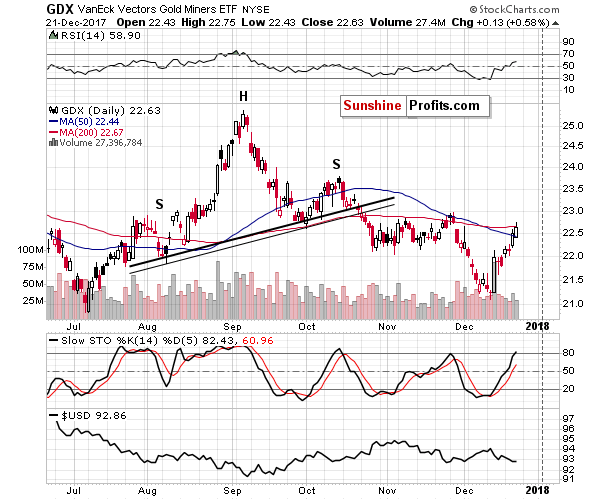
In light of the possible sharp moves in the precious metals and mining stocks, we are moving the target for gold $3 higher and we are changing the initial target levels to final profit-take levels. Triggering such a level will close the position automatically, without an additional confirmation. Moreover, if any of the targets in the base instruments (gold, silver, GDX) touches its profit-take level, we think that the long positions in the remaining instruments should also be closed and profits taken off the table.
This does not apply to the leveraged ETFs.
For instance, if gold moves to $1,282, the positions in gold, silver and mining stocks should be closed. If silver moves to $16.48, the positions in gold, silver and mining stocks should be closed. If GDX moves to $23.27, the positions in gold, silver and mining stocks should be closed.
At the same time, we are not automatically suggesting re-opening short positions without a separate confirmation. In the case of opening positions, we prefer to verify the entire situation manually instead of relying on price levels alone. At least in this case.
On an administrative note, due to your Editor’s Holiday- and year-end travel plans there will be no regular Gold & Silver Trading Alerts on Monday and Tuesday, December 26th and there will be no Gold & Silver Trading Alert on January 2nd. In other words, in the next week, the regular alerts will be posted on Wednesday, Thursday and Friday and following that, the next Alert will be posted on January 3rd.
However, since the situation in the precious metals is tense, we will be monitoring the market and if anything urgent happens, we’ll send you a quick message with our comments.
As always, we will keep you – our subscribers – informed.
To summarize:
Trading capital (supplementary part of the portfolio; our opinion): Long positions (100% of the full position) in gold, silver and mining stocks are justified from the risk/reward perspective with the following stop-loss orders and initial targets:
- Gold: profit-take level: $1,282; stop-loss: $1,236; profit-take level for the UGLD ETN: $10.78; stop-loss for the UGLD ETN $9.38
- Silver: profit-take level: $16.48; stop-loss: $15.58; profit-take level for the USLV ETN: $11.18; stop-loss for the USLV ETN $8.88
- Mining stocks (price levels for the GDX ETF): profit-take level: $23.27; stop-loss: $21.08; profit-take level for the NUGT ETF: $31.87; stop-loss for the NUGT ETF $23.78
In case one wants to bet on junior mining stocks' prices (we do not suggest doing so – we think senior mining stocks are more predictable in the case of short-term trades – if one wants to do it anyway, we provide the details), here are the stop-loss details and exit prices:
- GDXJ ETF: profit-take level: $33.97; stop-loss: $29.78
- JNUG ETF: profit-take level: $17.77; stop-loss: $11.78
Long-term capital (core part of the portfolio; our opinion): No positions (in other words: cash)
Insurance capital (core part of the portfolio; our opinion): Full position
Important Details for New Subscribers
Whether you already subscribed or not, we encourage you to find out how to make the most of our alerts and read our replies to the most common alert-and-gold-trading-related-questions.
Please note that the in the trading section we describe the situation for the day that the alert is posted. In other words, it we are writing about a speculative position, it means that it is up-to-date on the day it was posted. We are also featuring the initial target prices, so that you can decide whether keeping a position on a given day is something that is in tune with your approach (some moves are too small for medium-term traders and some might appear too big for day-traders).
Plus, you might want to read why our stop-loss orders are usually relatively far from the current price.
Please note that a full position doesn’t mean using all of the capital for a given trade. You will find details on our thoughts on gold portfolio structuring in the Key Insights section on our website.
As a reminder – “initial target price” means exactly that – an “initial” one, it’s not a price level at which we suggest closing positions. If this becomes the case (like it did in the previous trade) we will refer to these levels as levels of exit orders (exactly as we’ve done previously). Stop-loss levels, however, are naturally not “initial”, but something that, in our opinion, might be entered as an order.
Since it is impossible to synchronize target prices and stop-loss levels for all the ETFs and ETNs with the main markets that we provide these levels for (gold, silver and mining stocks – the GDX ETF), the stop-loss levels and target prices for other ETNs and ETF (among other: UGLD, DGLD, USLV, DSLV, NUGT, DUST, JNUG, JDST) are provided as supplementary, and not as “final”. This means that if a stop-loss or a target level is reached for any of the “additional instruments” (DGLD for instance), but not for the “main instrument” (gold in this case), we will view positions in both gold and DGLD as still open and the stop-loss for DGLD would have to be moved lower. On the other hand, if gold moves to a stop-loss level but DGLD doesn’t, then we will view both positions (in gold and DGLD) as closed. In other words, since it’s not possible to be 100% certain that each related instrument moves to a given level when the underlying instrument does, we can’t provide levels that would be binding. The levels that we do provide are our best estimate of the levels that will correspond to the levels in the underlying assets, but it will be the underlying assets that one will need to focus on regarding the signs pointing to closing a given position or keeping it open. We might adjust the levels in the “additional instruments” without adjusting the levels in the “main instruments”, which will simply mean that we have improved our estimation of these levels, not that we changed our outlook on the markets. We are already working on a tool that would update these levels on a daily basis for the most popular ETFs, ETNs and individual mining stocks.
Our preferred ways to invest in and to trade gold along with the reasoning can be found in the how to buy gold section. Additionally, our preferred ETFs and ETNs can be found in our Gold & Silver ETF Ranking.
As a reminder, Gold & Silver Trading Alerts are posted before or on each trading day (we usually post them before the opening bell, but we don't promise doing that each day). If there's anything urgent, we will send you an additional small alert before posting the main one.
=====
Latest Free Trading Alerts:
This week, the U.S. Congress approved the tax bill. What does it mean for the gold market?
In October, the Federal Reserve started the unwinding of its massive balance sheet. But the financial markets seem to be unaffected. We invite you to read our today’s article about the so-called quantitative tightening and find out what would such program imply for the gold market.
Fed Unwinds, Gold Market Yawns
Yesterday, the Australian dollar increased sharply against the greenback, which resulted in a breakout above the upper border of the consolidation. How high could the exchange rate go in the coming days?
=====
Hand-picked precious-metals-related links:
Silver to fare better than Gold in 2018: Goldman Sachs
Asia Gold-Demand softens on higher prices, slow holiday trade
Australia’s New Gold Rush Hits Speed Bump on Drilling Results
=====
In other news:
Congress clears funding bill, staving off shutdown
EU markets hold their breath ahead of 'MiFID' Day
Spain's political crisis is 'back to square one' after Catalonia election
Bitcoin plunges — losing as much as $2,500 in a single session
Goldman Sachs launching trading desk for bitcoin, report says
=====
Thank you.
Sincerely,
Przemyslaw Radomski, CFA
Founder, Editor-in-chief, Gold & Silver Fund Manager
Gold & Silver Trading Alerts
Forex Trading Alerts
Oil Investment Updates
Oil Trading Alerts

