

Yesterday, the Australian dollar increased sharply against the greenback, which resulted in a breakout above the upper border of the consolidation. How high could the exchange rate go in the coming days?
EUR/USD
Yesterday, we wrote the following:
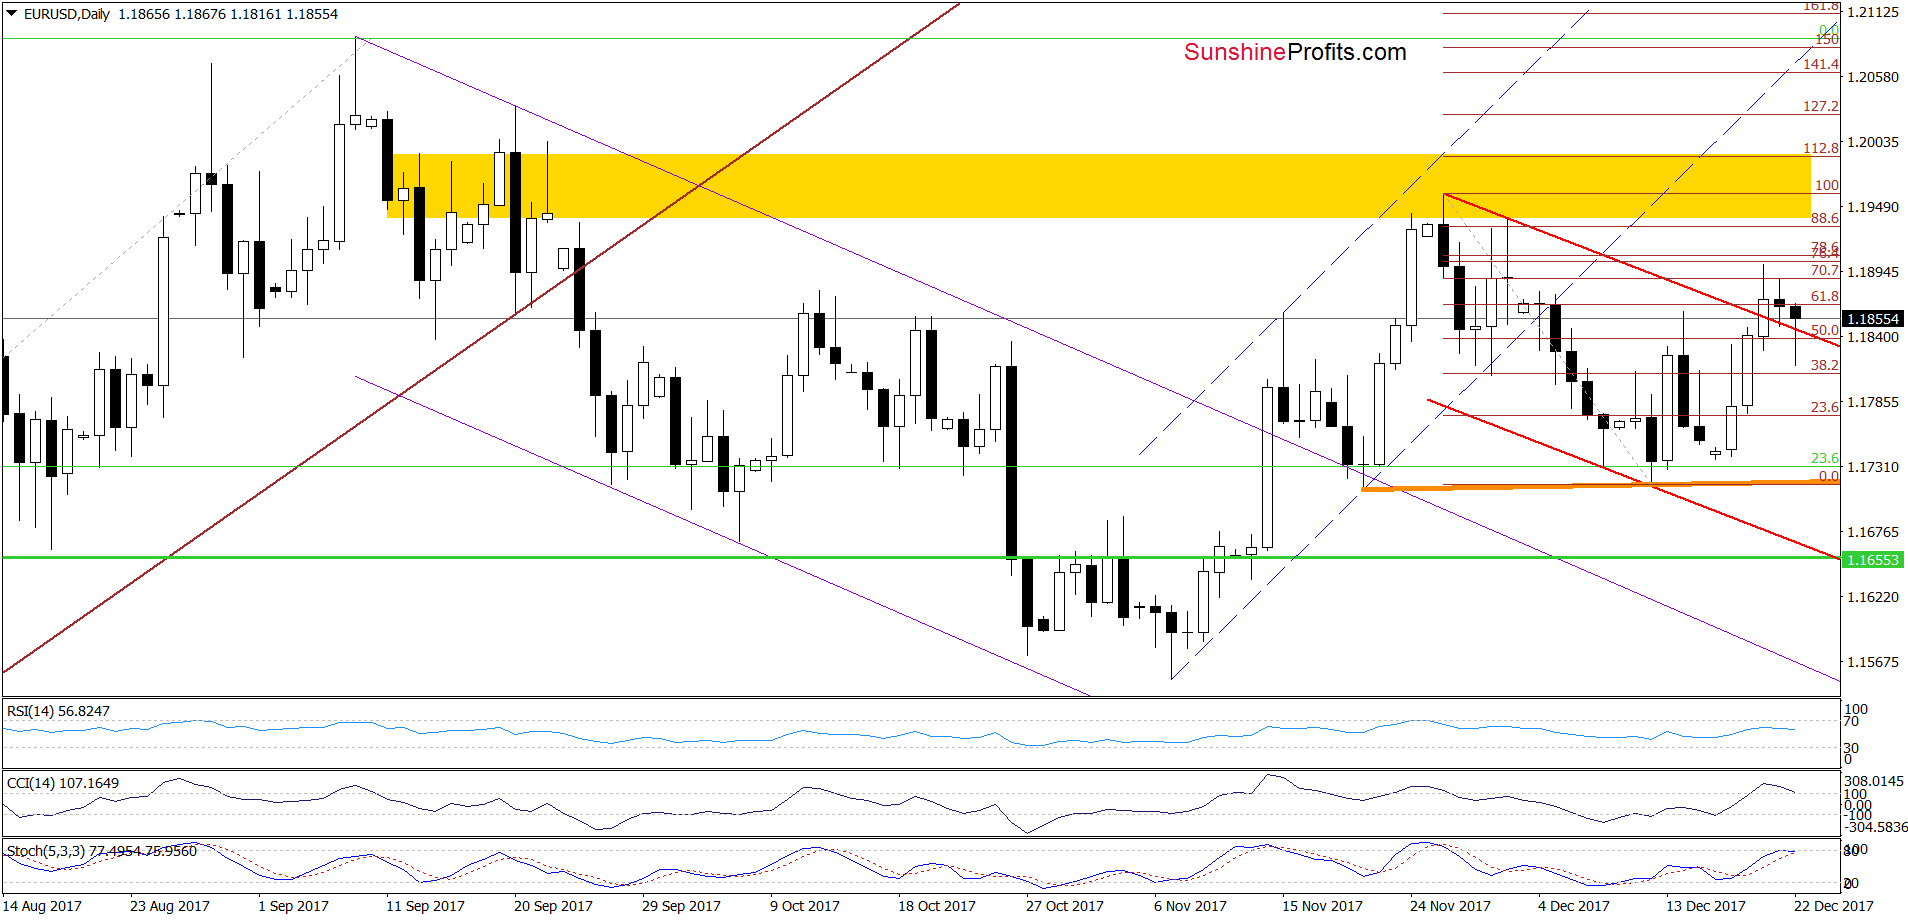
(…) the combination of the 76.4% and 78.6% Fibonacci retracements (based on the entire recent downward move) stopped currency bulls, triggering a pullback. Earlier today, the exchange rate wavers between this resistance area and the previously-broken upper line of the declining trend channel, but considering the current position of the daily indicators, we think that another move to the downside is just around the corner.
If this is the case we’ll see a test of the upper red line or even an attempt to invalidate yesterday's breakout. This scenario is also reinforced by the broader picture of the pair.
From today’s point of view, we see that the situation developed in line with the above scenario and currency bears pushed EUR/USD under the upper border of the red declining trend channel earlier today. Despite this move, their opponents triggered a rebound, which invalidated the breakdown in the following hours.
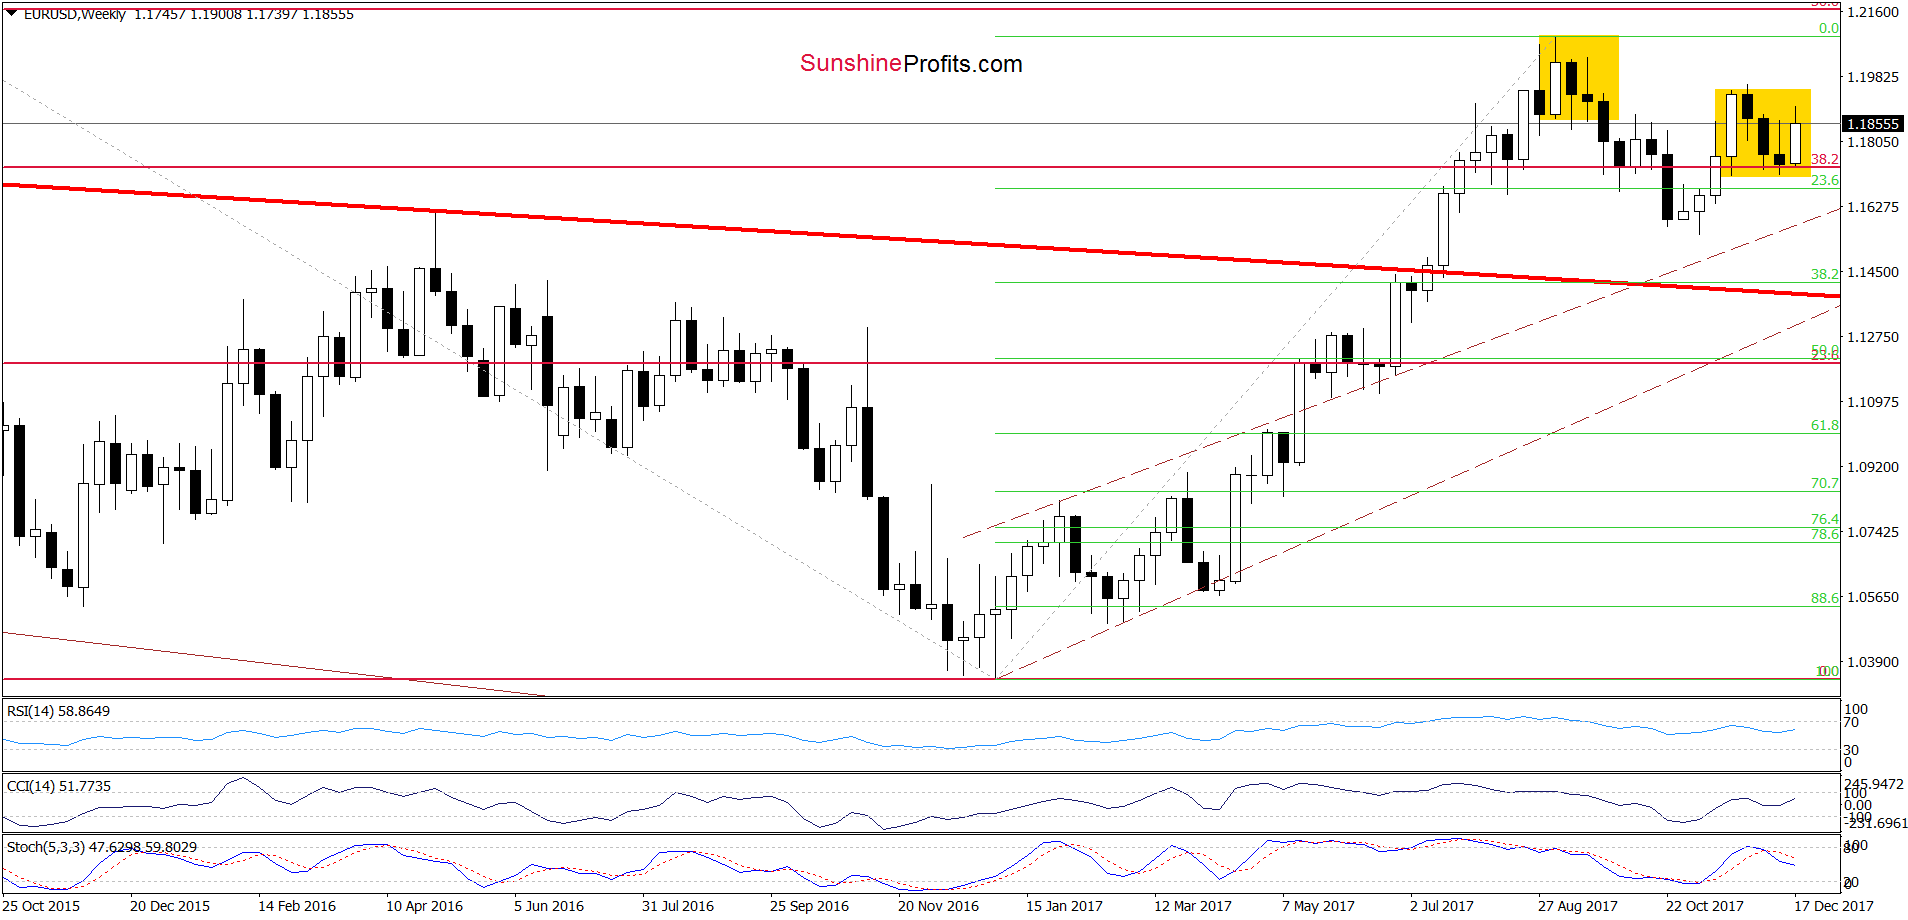
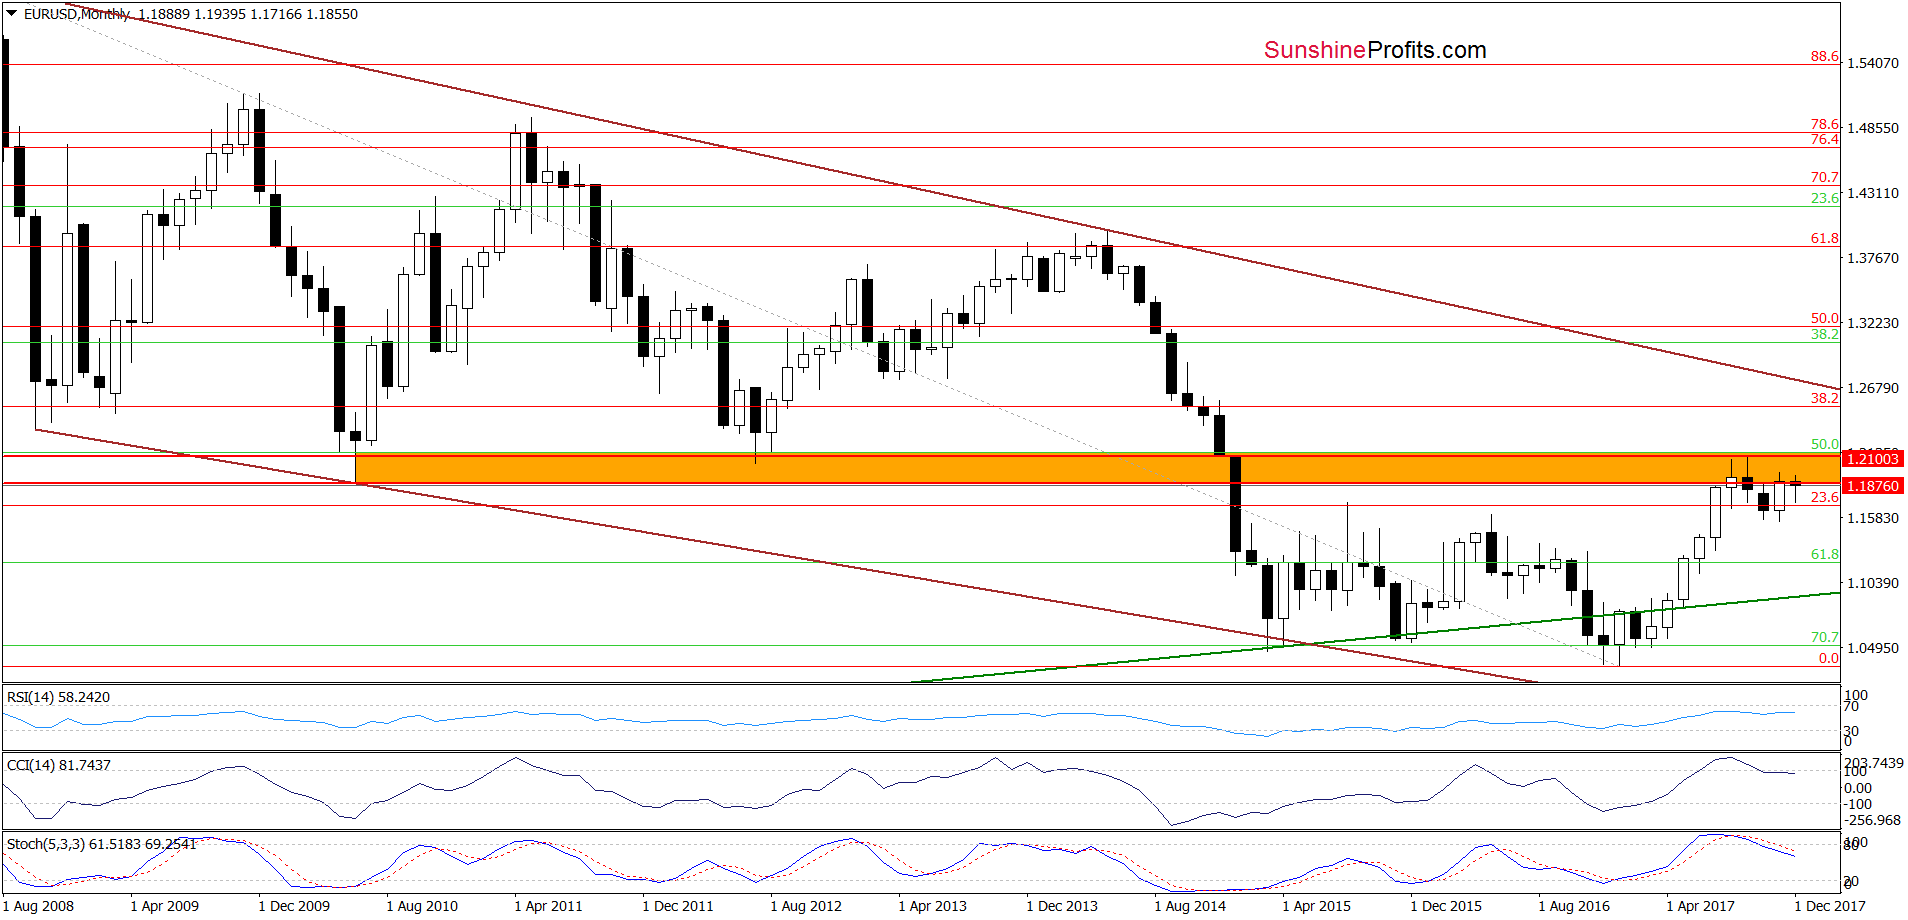
Although such price action looks quite positive, we should keep in mind that the CCI and the Stochastic Oscillator are very close to generating sell signals, which doesn’t bode well for further rally. Additionally, the exchange rate remains in the yellow consolidation under the orange resistance zone, which together with the sell signals generated by the weekly and monthly indicators (marked on the charts below) suggest that another move will be to the downside.
What does it mean for EUR/USD? In our opinion, if currency bears attack once again, we’ll likely see an invalidation of the Wednesday breakout above the upper line of the red declining trend channel. Such price action would be a bearish development, which should translate into further deterioration and a drop to around 1.1718, where the orange support line based on the previous lows currently is. Nevertheless, if this support is broken, the next downside target for the sellers will be the lower border of the trend channel in the following days.
GBP/USD
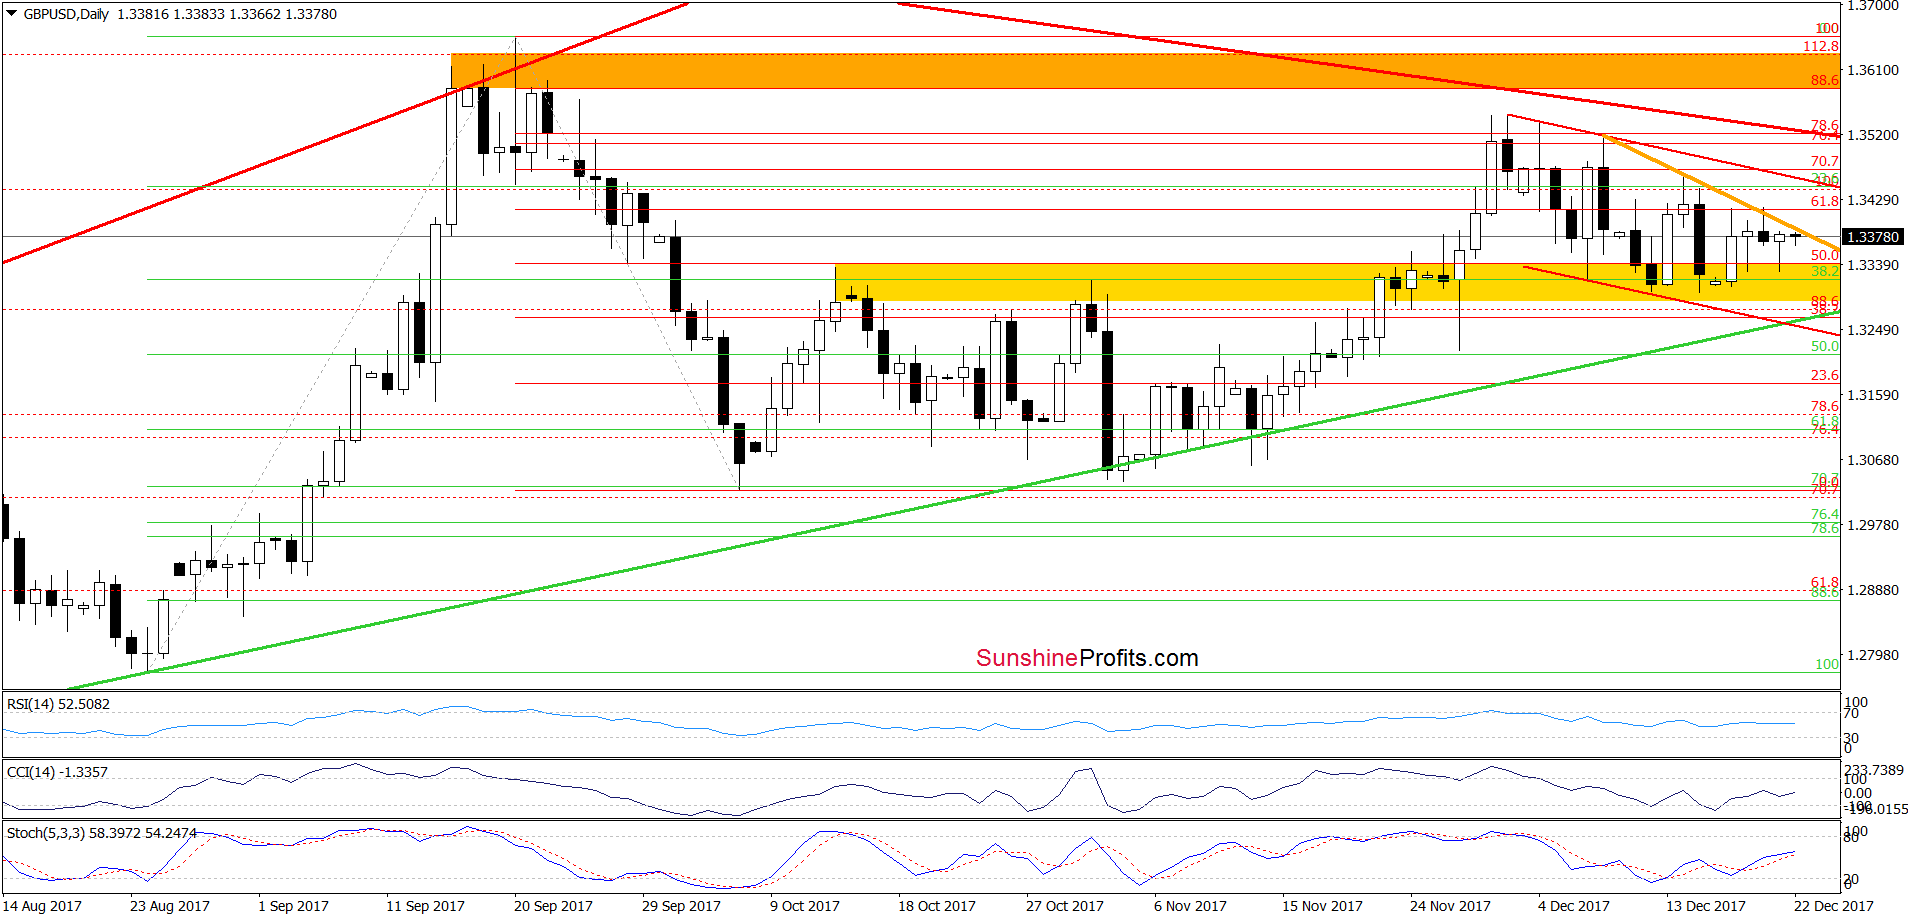
Looking at the daily chart, we see that the overall situation in the short term hasn’t changed much as GBP/USD is still trading in a very narrow range between the yellow zone, which serves as the nearest support and the orange declining resistance line based on the previous highs. Taking this fact into account, we believe that what we wrote in our Forex Trading Alert posted on December 18 remains up-to-date also today:
(…) GBP/USD bounced off the yellow support zone once again (…). We saw similar price action two times in December, but none of them brought any improvement in the short-term (not to mention the medium-term perspective). When we take a closer look at the above chart, we notice that the last week’s increase was smaller than the previous one, which translated into another decline. Therefore, in our opinion, as long as there is no breakout above the upper border of the red declining trend channel lower values of GBPUSD are very likely and short positions continue to be justified from the risk/reward perspective.
AUD/USD
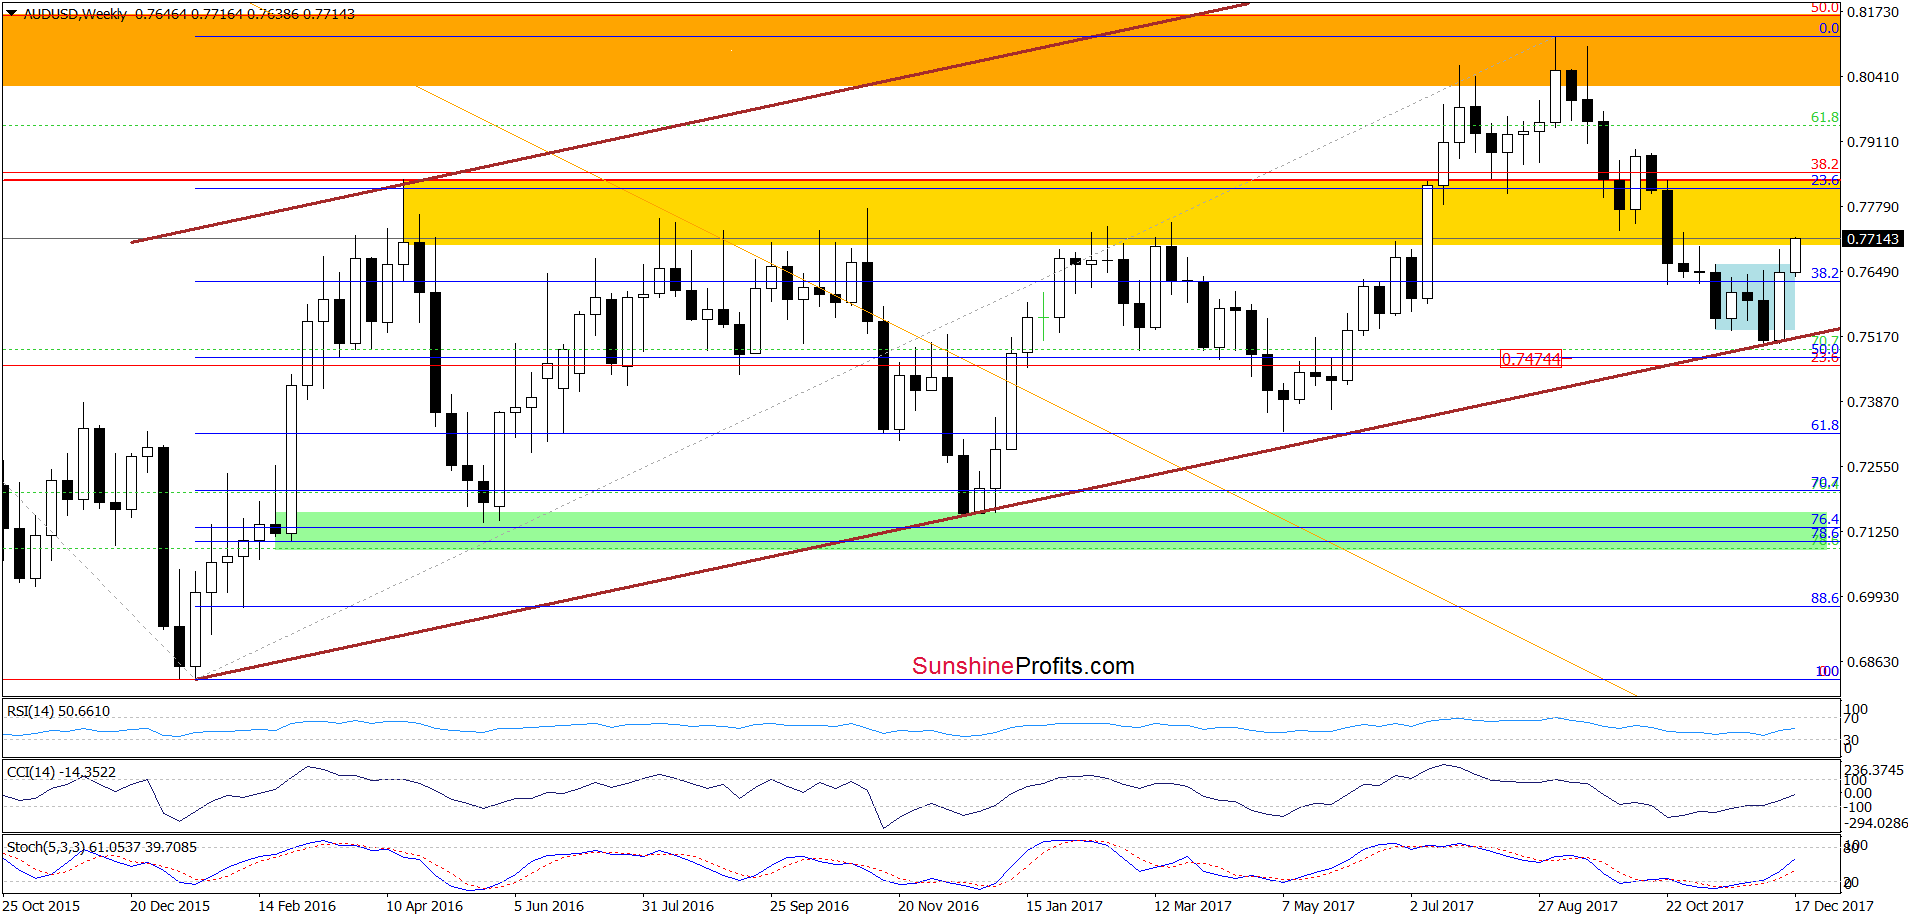
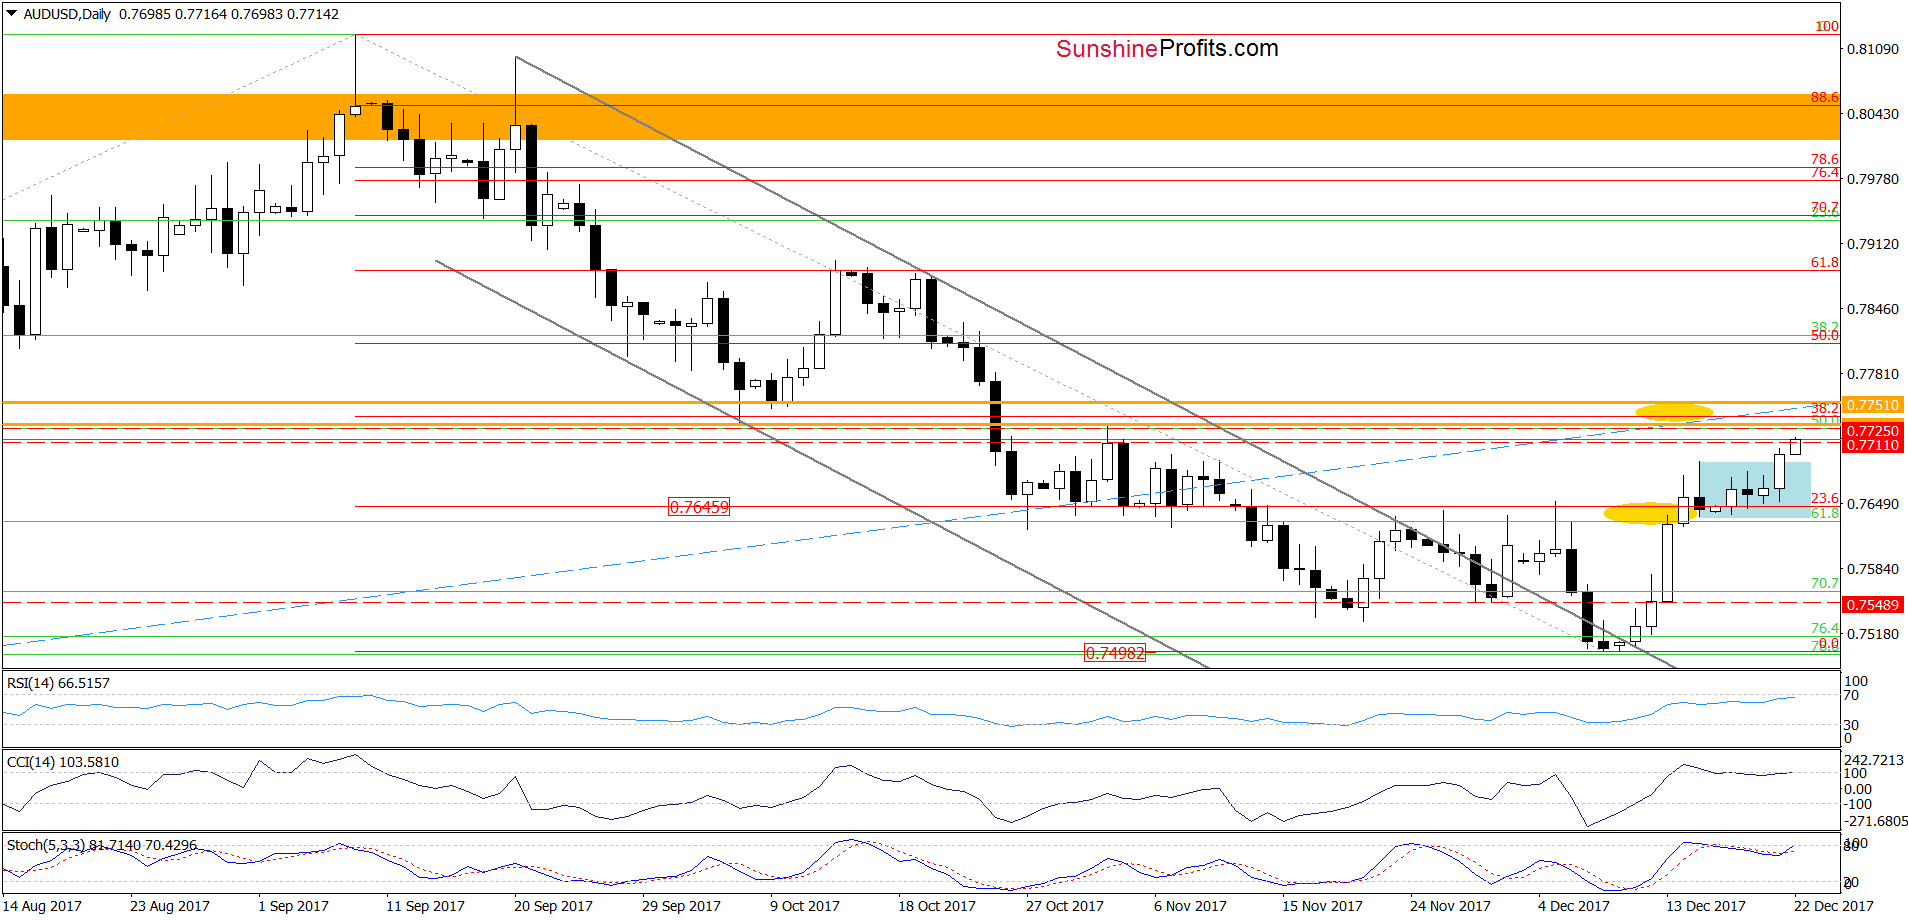
The first thing that catches the eye on the daily chart is the breakout above the upper border of the blue consolidation. Additionally, the Stochastic Oscillator re-generated the buy signal, which suggests that we’ll see a realization of the scenario from our Forex Trading Alert posted on December 13:
(…) we’ll likely see an increase even to around 0.7728-0.7751, where the orange horizontal resistance lines and the 38.2% Fibonacci retracement are.
At the moment of writing these words, the AUD/USD is trading at 0.7716, which is very close to our target area. It is often said that a bird in hand is worth two in the bush, and it seems that this saying can be applied to the current situation. Namely, it seems that taking profits off the table at this time is already justified. As a reminder, we opened them on December 12 when AUD/USD was trading around 0.7550.
Naturally, the above could change in the coming days and we’ll keep our subscribers informed, but that’s what appears likely based on the data that we have right now. If you enjoyed reading our analysis, we encourage you to subscribe to our daily Forex Trading Alerts.
Thank you.
Nadia Simmons
Forex & Oil Trading Strategist
Przemyslaw Radomski, CFA
Founder, Editor-in-chief, Gold & Silver Fund Manager
Gold & Silver Trading Alerts
Forex Trading Alerts
Oil Investment Updates
Oil Trading Alerts
