

Briefly: in our opinion, full (250% of the regular size of the position) speculative short positions in gold, silver and mining stocks are justified from the risk/reward perspective at the moment of publishing this alert.
Although it didn’t appear to be a breakdown, silver just closed the day (and week) at a new yearly low. Remember the day when silver moved briefly below $14? Ultimately, silver futures closed at $14.15 on that day, and they just closed at $14.14 on Friday. So little, yet so much. Breakdown confirmed by weekly closes is something very significant and yet, it’s not the most important thing that we will comment on in today’s analysis. The key details will come from the gold market.
Let’s start with silver and mining stocks, though (charts courtesy of http://stockcharts.com/).
Silver - Business as Usual
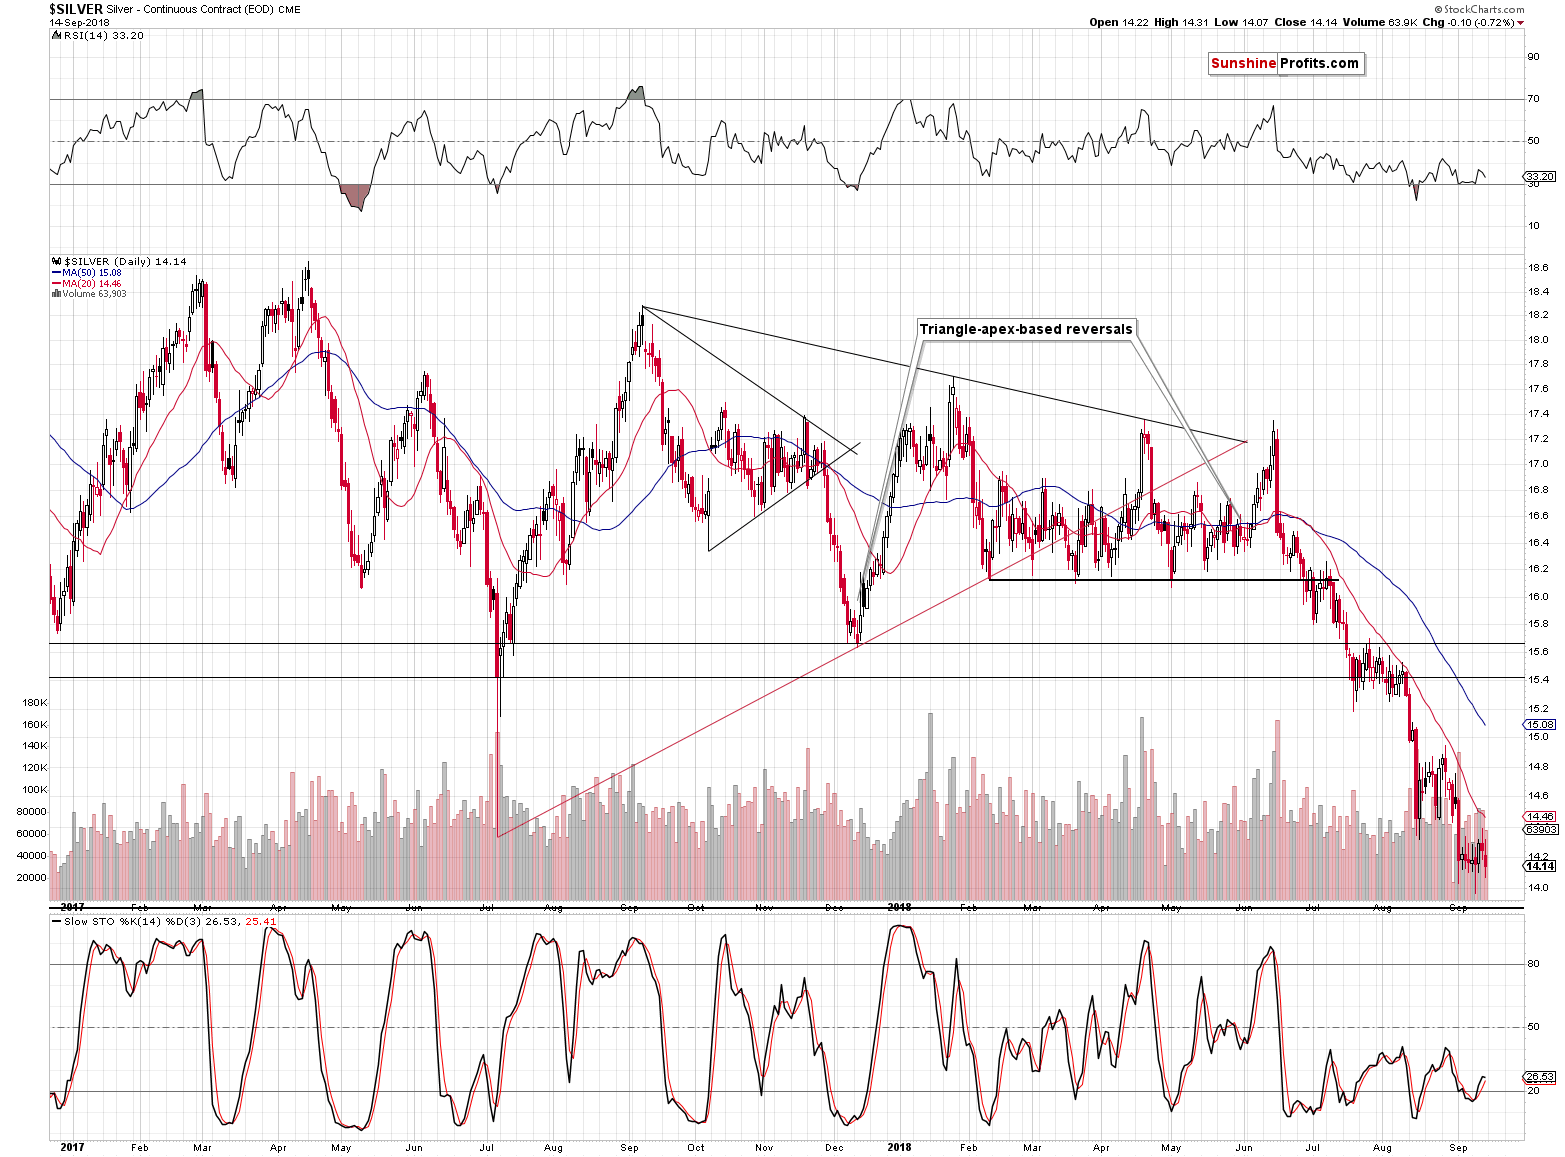
On Thursday, silver rallied visibly higher on an intraday basis, which is something that silver quite often does before starting volatile declines. We saw that in the final part of August, in early July, and – in a more visible way – in mid-June. The signal would have been even stronger if silver outperformed gold on that day, but due to the breakout in the gold to silver ratio, it was difficult to achieve, and thus what silver did seems to be a rather normal thing to do right before declining.
The price of the white metal didn’t plunge yet, but it did close the day and the week at a new yearly low, which is a subtle, but strong indication that the next big move lower is about to start.
Another Breakdown, Another Verification

In case of the mining stocks, there was no new breakdown, but we once again saw a textbook example of breakdown’s verification.
The first major breakdown was below the 150 level that corresponds to the 2008 low. After moving below it, the HUI Index moved to the October 2015 highs and started the corrective upswing from these levels. After moving back to the previously broken 150 level, HUI declined once again, this time breaking below the October 2015 highs.
Gold stocks managed to decline to almost 130, before correcting. Like it was the case previously, what was support, now provided resistance. The HUI Index tried to move back above the levels of October 2015 highs (approximately 140), and even succeeded on an intraday basis, but ultimately failed by not managing to close above this level for even a single day.
The breakdown below the 140 level is confirmed and the implications are very bearish. In 2016, it took about 2 weeks for the HUI Index to rally from below 100 to the current levels and we could see similar level of volatility on the downside. The implications are very bearish.
Having discussed the situation in silver and miners, let’s take a look at the key part of today’s analysis – the gold market.
Gold’s Ultimate Confirmation
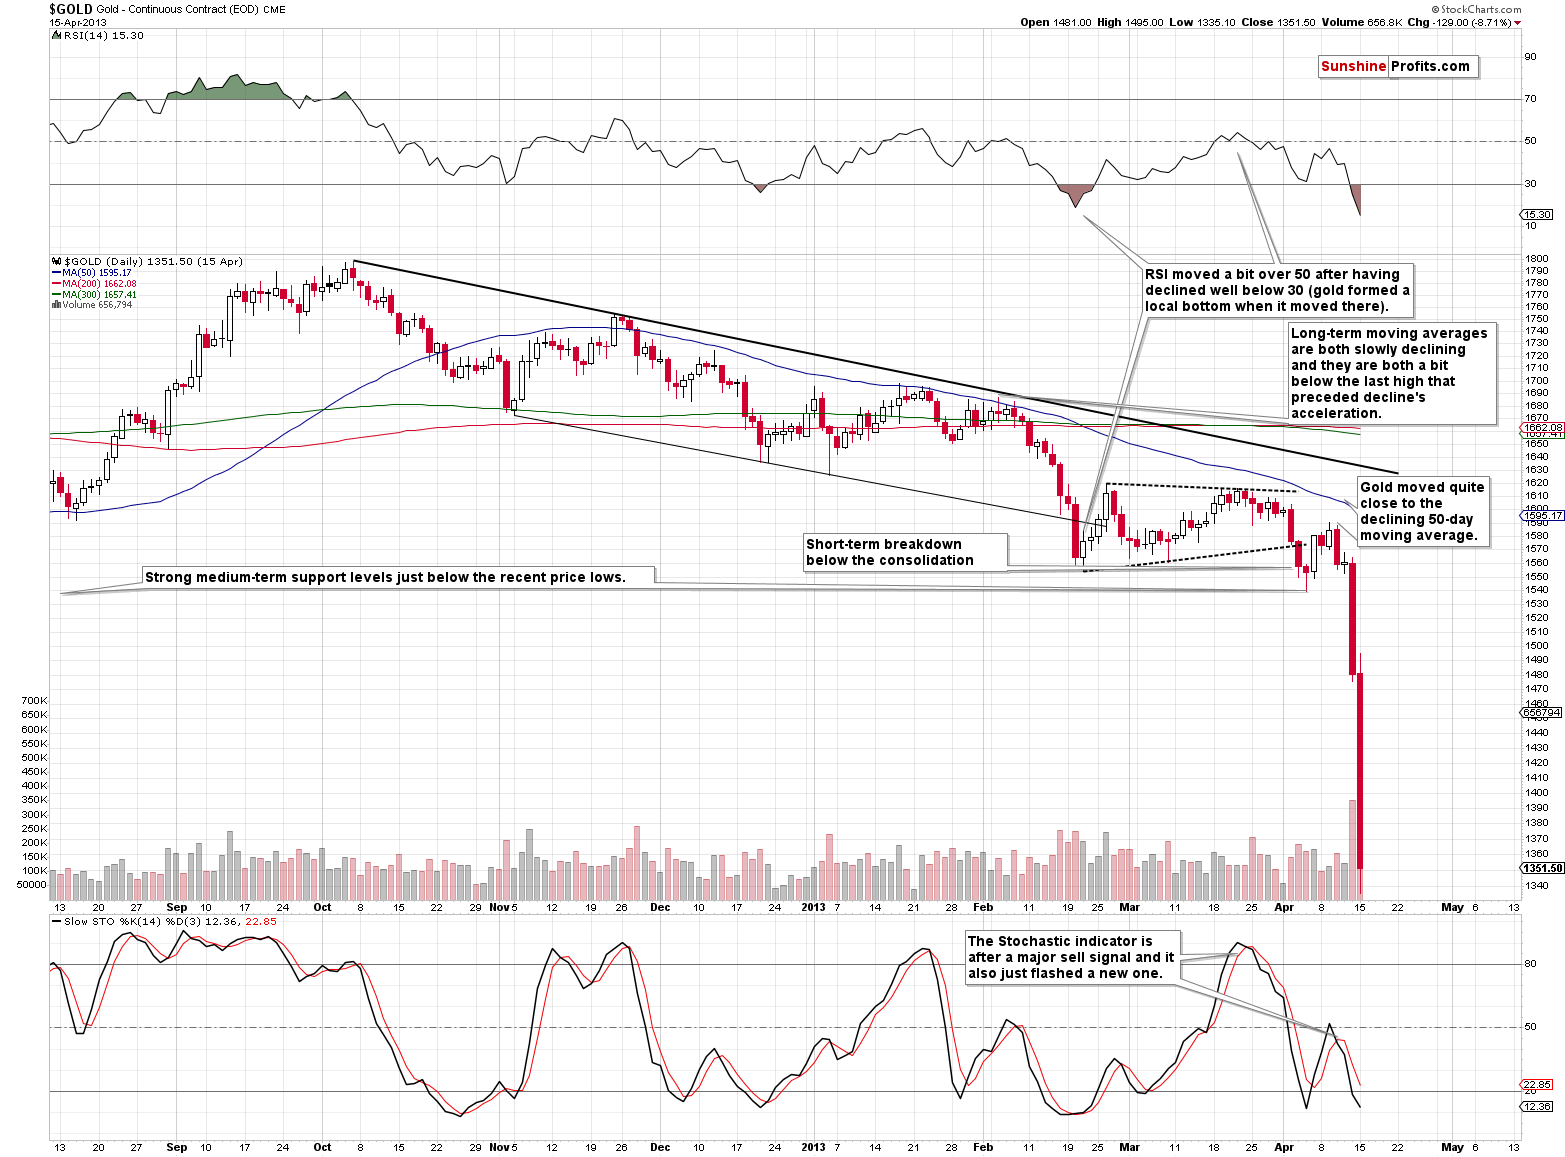
Gold moved back and forth lately as it’s been consolidating after the recent sharp decline that took gold to the medium-term support levels (even a bit below some of them) and the declining thin black support line (based on the previous lows).
The yellow metal moved close to its 50-day moving average (staying below it) and it’s still far from the declining black resistance line, which suggests that the trend remains down and that everything that we saw recently is just a pause within a bigger decline.
The RSI indicator was very oversold on a short-term basis during the recent volatile bottoming pattern, but it recovered since that time, and it recently even moved above 50, thus indicating that the situation is far from being very oversold on a short-term basis.
The Stochastic indicator already confirmed that the major short-term top is already in and we just saw another move lower in it, after it moved above the middle of its trading range.
Moreover, gold already broke below the consolidation pattern marked with dashed lines and even though it moved very briefly back into the pattern, it closed the last two sessions visibly below it.
Some will say that what we’re seeing is just a prolonged bottoming pattern and what we have now is the first post-bottom pause. But we disagree. Based on multiple other factors, including severe underperformance of gold stocks, the outlook remains strongly bearish and gold price appears ready to decline once again.
But, we don’t have to convince you that the above is the case. The odds are that you already convinced yourself, without realizing it.
What has been will be again,
what has been done will be done again;
there is nothing new under the sun.
- Ecclesiastes 1:9-10
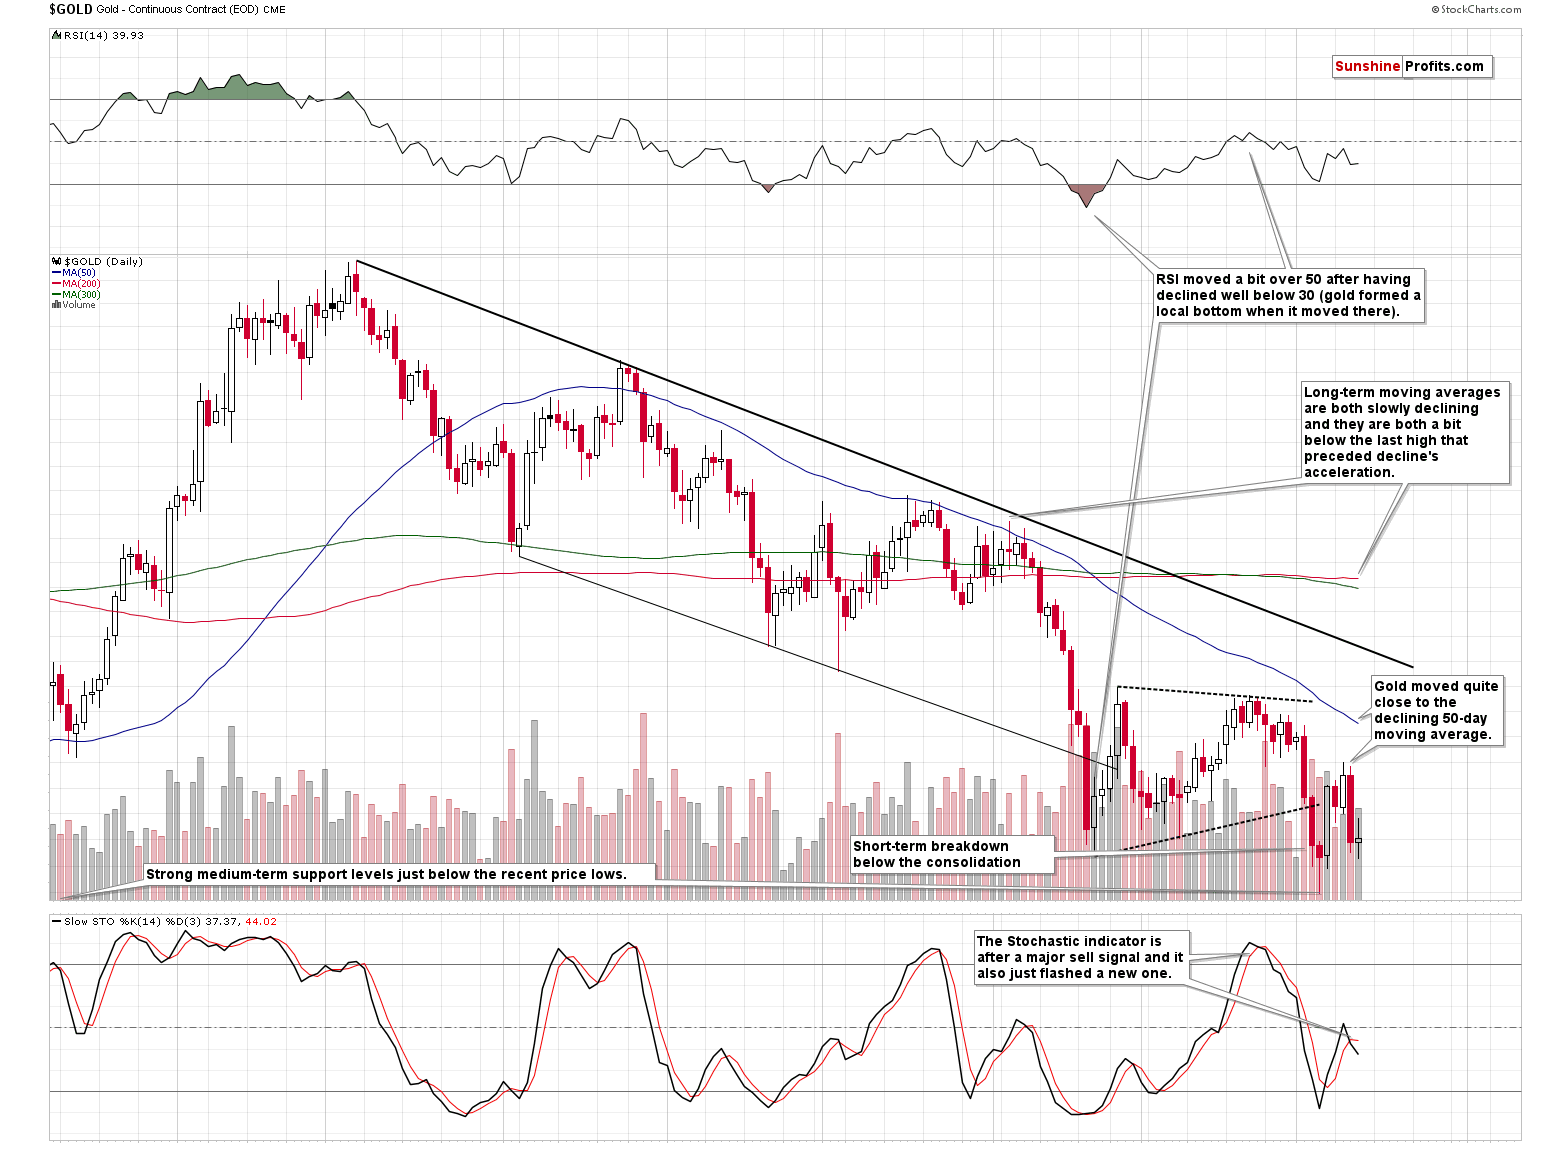
Did you notice the dates and price levels on the above chart?
You didn’t notice them, as they are not there, and the reason they are not there is that we wanted you to focus on the shape of the price movement and many other factors. The above chart does not feature the current price of gold.
Everything that we wrote above is true and correctly describes the current situation on the gold market, but… It features a different period from the past. Here’s what the current gold chart looks like:
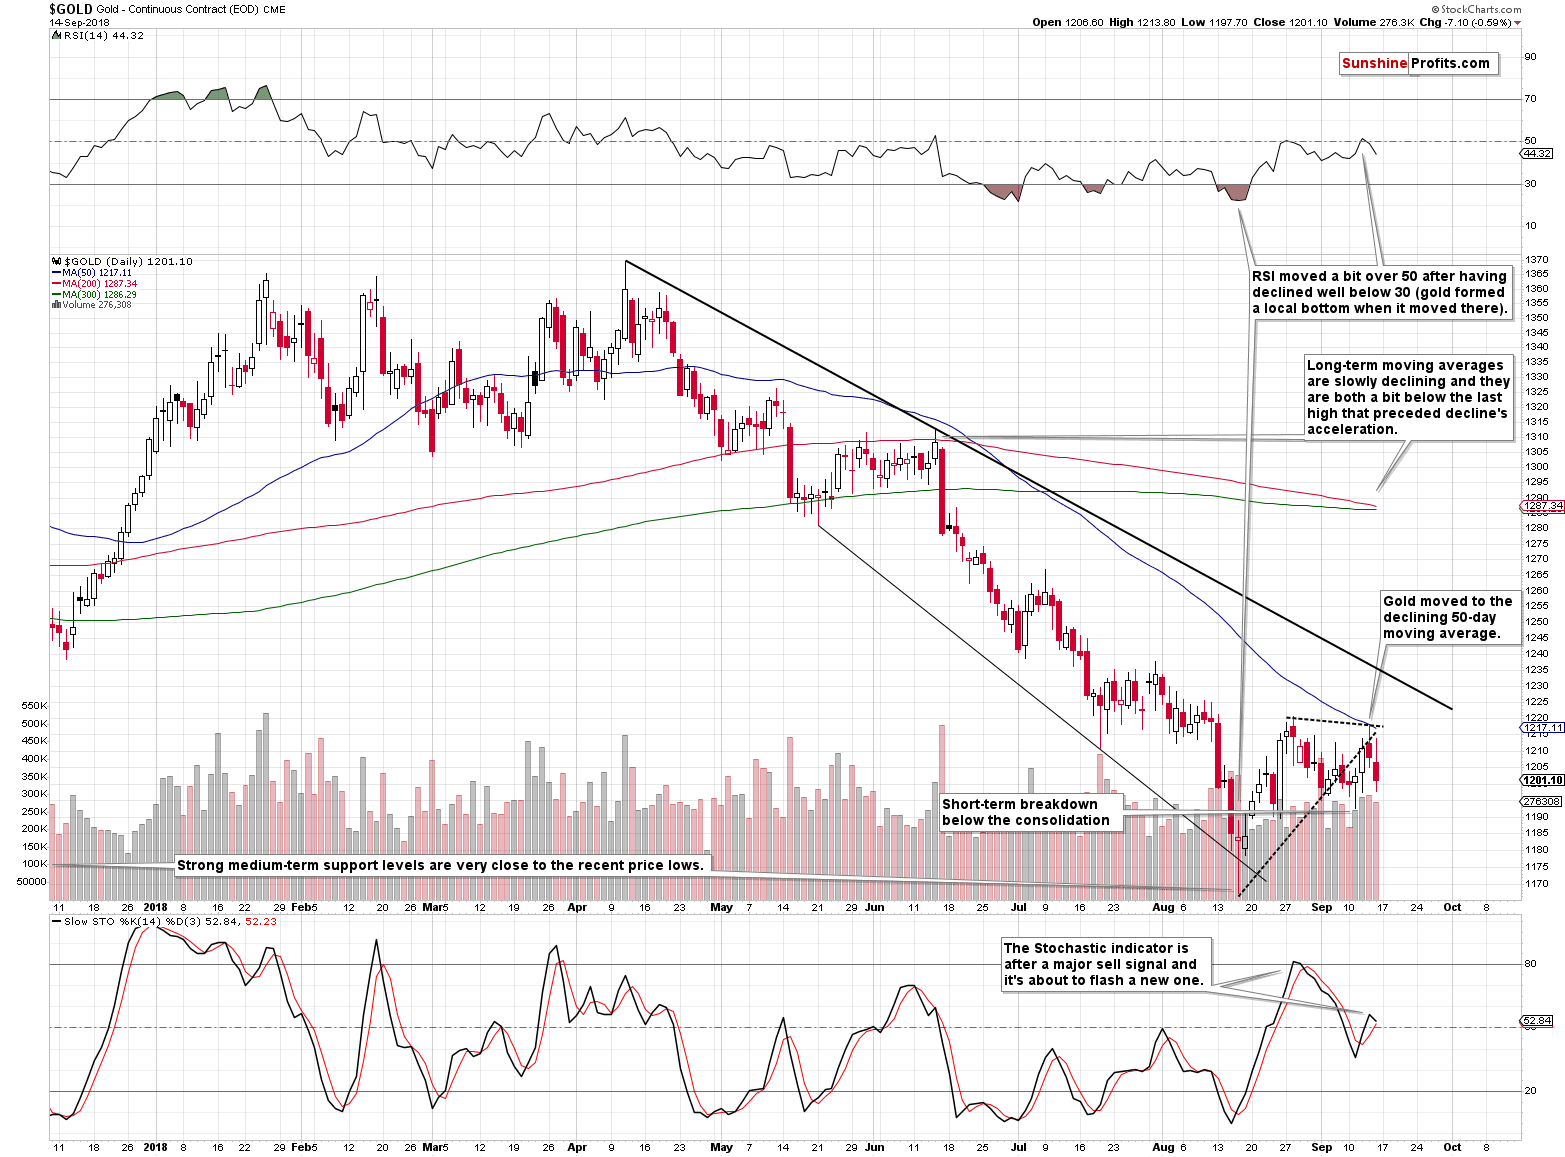
Please re-read everything that we wrote on the previous gold chart. It all applies to the current gold chart as well. Everything. Not just the position of indicators, proximity to the support and resistance lines, situation regarding the consolidation pattern, and the 50- a day moving average. Even the 200-, and 300- a day moving averages (marked with red and green) are slowly declining and are just below the local top after which the decline accelerated.
Shocking, isn’t it?
The more similar a given price pattern is, the stronger the implications are and while it’s usually best to have multiple patterns that are similar to the current one that are followed by the same outcome, this doesn’t seem necessary right now. The similarity is simply so big that even the single case can make a certain outcome very, very likely.
The million (billion?) dollar question is what kind of action followed the still-unknown self-similar pattern in gold in the past.
What followed was a price action that was so significant that if it’s included in the original chart it makes the previous chart patterns small and irrelevant. That’s why we cut it out. After all, nobody knew how significant the moves are going to be before they happened.
Here’s the chart once again, this time with dates and prices.
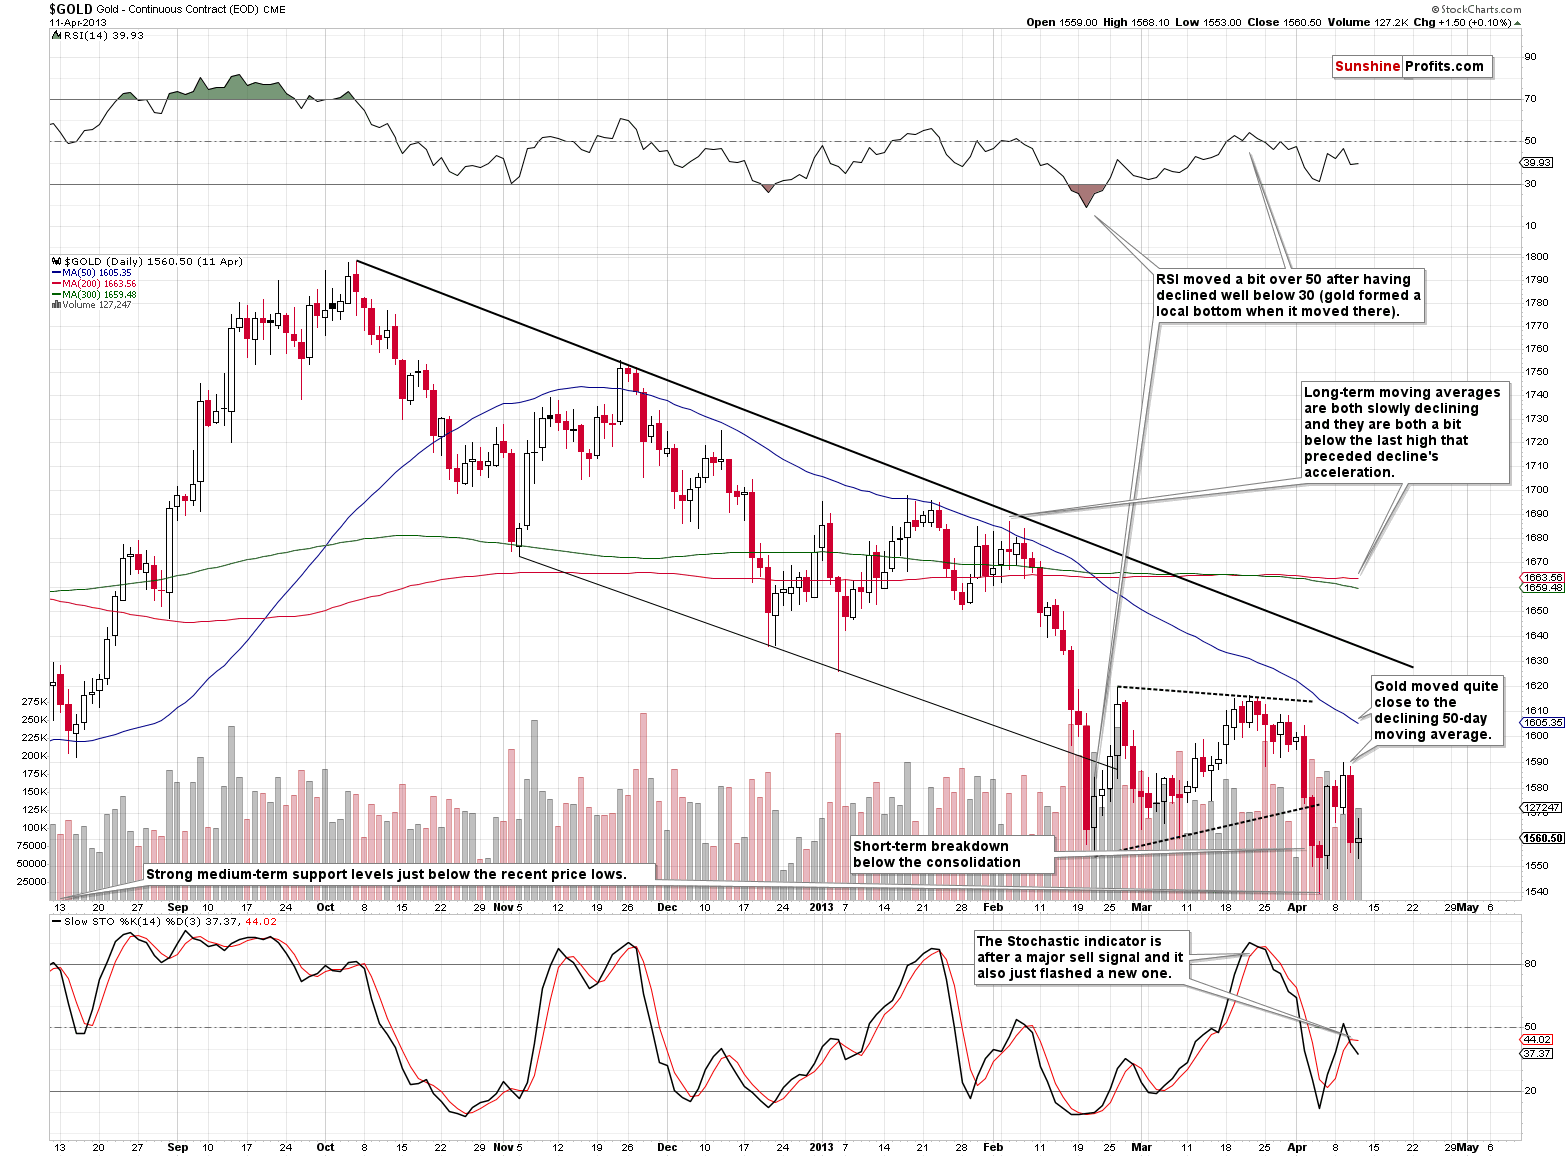
And here it is along with the next 2 trading days.
Yes, what you probably thought was the current gold price chart, was actually visible precisely before the 2-day slide that took gold over $200 lower. Translating this to today’s prices (the price moves tend to be analogous more in percentage terms than in absolute terms), we get a very strong indication that gold could slide to its December 2015 lows so quickly that it will be almost impossible to catch this move unless one is prepared in advance. For many days, we’ve been emphasizing how bearish the outlook is and how many signs point to much lower PM prices. We trust that you are prepared.
And that’s it. There is nothing that could have clearer implications than the above chart and whatever we write today, will not be as convincing as what you discovered yourself when you noticed that the recent chart was actually a chart featuring something that happened over 5 years ago. And then you saw what followed.
Thank you for using our premium services. As always, we’ll keep you – our subscribers – informed.
To summarize:
Trading capital (supplementary part of the portfolio; our opinion): Full short positions (250% of the full position) in gold, silver and mining stocks are justified from the risk/reward perspective with the following stop-loss orders and exit profit-take price levels:
- Gold: profit-take exit price: $1,062; stop-loss: $1,226; initial target price for the DGLD ETN: $82.96; stop-loss for the DGLD ETN $53.67
- Silver: profit-take exit price: $12.72; stop-loss: $15.16; initial target price for the DSLV ETN: $46.97; stop-loss for the DSLV ETN $31.37
- Mining stocks (price levels for the GDX ETF): profit-take exit price: $13.12; stop-loss: $19.61; initial target price for the DUST ETF: $80.97; stop-loss for the DUST ETF $33.37
Note: the above is a specific preparation for a possible sudden price drop, it does not reflect the most likely outcome. You will find a more detailed explanation in our August 1 Alert. In case one wants to bet on junior mining stocks’ prices (we do not suggest doing so – we think senior mining stocks are more predictable in the case of short-term trades – if one wants to do it anyway, we provide the details), here are the stop-loss details and target prices:
- GDXJ ETF: profit-take exit price: $17.52; stop-loss: $29.43
- JDST ETF: initial target price: $154.97 stop-loss: $64.88
Long-term capital (core part of the portfolio; our opinion): No positions (in other words: cash)
Insurance capital (core part of the portfolio; our opinion): Full position
Important Details for New Subscribers
Whether you already subscribed or not, we encourage you to find out how to make the most of our alerts and read our replies to the most common alert-and-gold-trading-related-questions.
Please note that the in the trading section we describe the situation for the day that the alert is posted. In other words, it we are writing about a speculative position, it means that it is up-to-date on the day it was posted. We are also featuring the initial target prices, so that you can decide whether keeping a position on a given day is something that is in tune with your approach (some moves are too small for medium-term traders and some might appear too big for day-traders).
Plus, you might want to read why our stop-loss orders are usually relatively far from the current price.
Please note that a full position doesn’t mean using all of the capital for a given trade. You will find details on our thoughts on gold portfolio structuring in the Key Insights section on our website.
As a reminder – “initial target price” means exactly that – an “initial” one, it’s not a price level at which we suggest closing positions. If this becomes the case (like it did in the previous trade) we will refer to these levels as levels of exit orders (exactly as we’ve done previously). Stop-loss levels, however, are naturally not “initial”, but something that, in our opinion, might be entered as an order.
Since it is impossible to synchronize target prices and stop-loss levels for all the ETFs and ETNs with the main markets that we provide these levels for (gold, silver and mining stocks – the GDX ETF), the stop-loss levels and target prices for other ETNs and ETF (among other: UGLD, DGLD, USLV, DSLV, NUGT, DUST, JNUG, JDST) are provided as supplementary, and not as “final”. This means that if a stop-loss or a target level is reached for any of the “additional instruments” (DGLD for instance), but not for the “main instrument” (gold in this case), we will view positions in both gold and DGLD as still open and the stop-loss for DGLD would have to be moved lower. On the other hand, if gold moves to a stop-loss level but DGLD doesn’t, then we will view both positions (in gold and DGLD) as closed. In other words, since it’s not possible to be 100% certain that each related instrument moves to a given level when the underlying instrument does, we can’t provide levels that would be binding. The levels that we do provide are our best estimate of the levels that will correspond to the levels in the underlying assets, but it will be the underlying assets that one will need to focus on regarding the signs pointing to closing a given position or keeping it open. We might adjust the levels in the “additional instruments” without adjusting the levels in the “main instruments”, which will simply mean that we have improved our estimation of these levels, not that we changed our outlook on the markets. We are already working on a tool that would update these levels on a daily basis for the most popular ETFs, ETNs and individual mining stocks.
Our preferred ways to invest in and to trade gold along with the reasoning can be found in the how to buy gold section. Additionally, our preferred ETFs and ETNs can be found in our Gold & Silver ETF Ranking.
As a reminder, Gold & Silver Trading Alerts are posted before or on each trading day (we usually post them before the opening bell, but we don't promise doing that each day). If there's anything urgent, we will send you an additional small alert before posting the main one.
=====
Latest Free Trading Alerts:
Friday's trading session was virtually flat, as investors hesitated following series of economic data releases. The S&P 500 index trades above the level of 2,900, and it remains relatively very close to its late August record high. But will stocks continue higher? Or is this just an advance within a topping consolidation?
=====
Thank you.
Sincerely,
Przemyslaw Radomski, CFA
Founder, Editor-in-chief, Gold & Silver Fund Manager
Gold & Silver Trading Alerts
Forex Trading Alerts
Oil Investment Updates
Oil Trading Alerts

