

Briefly: In our opinion, full (200% of the regular size of the position) speculative short positions in gold, silver and mining stocks are justified from the risk/reward perspective at the moment of publishing this alert.
We received quite a few interesting questions from our subscribers recently, so today’s alert will take the form of a bigger Q&A panel. We’ll start with the question that nobody has asked yet, but addressing which should be particularly informative. “OK guys, we were supposed to have a decline in the precious metals market and instead we saw a move higher in gold and silver – what’s going on?”
Let’s start with what’s not going on. Big changes are not going on. In fact, the long-term gold and HUI Index charts show that the situation is developing in precise tune with what we saw in the early part of the decline in 2012. Let’s take a closer look (chart courtesy of http://stockcharts.com).
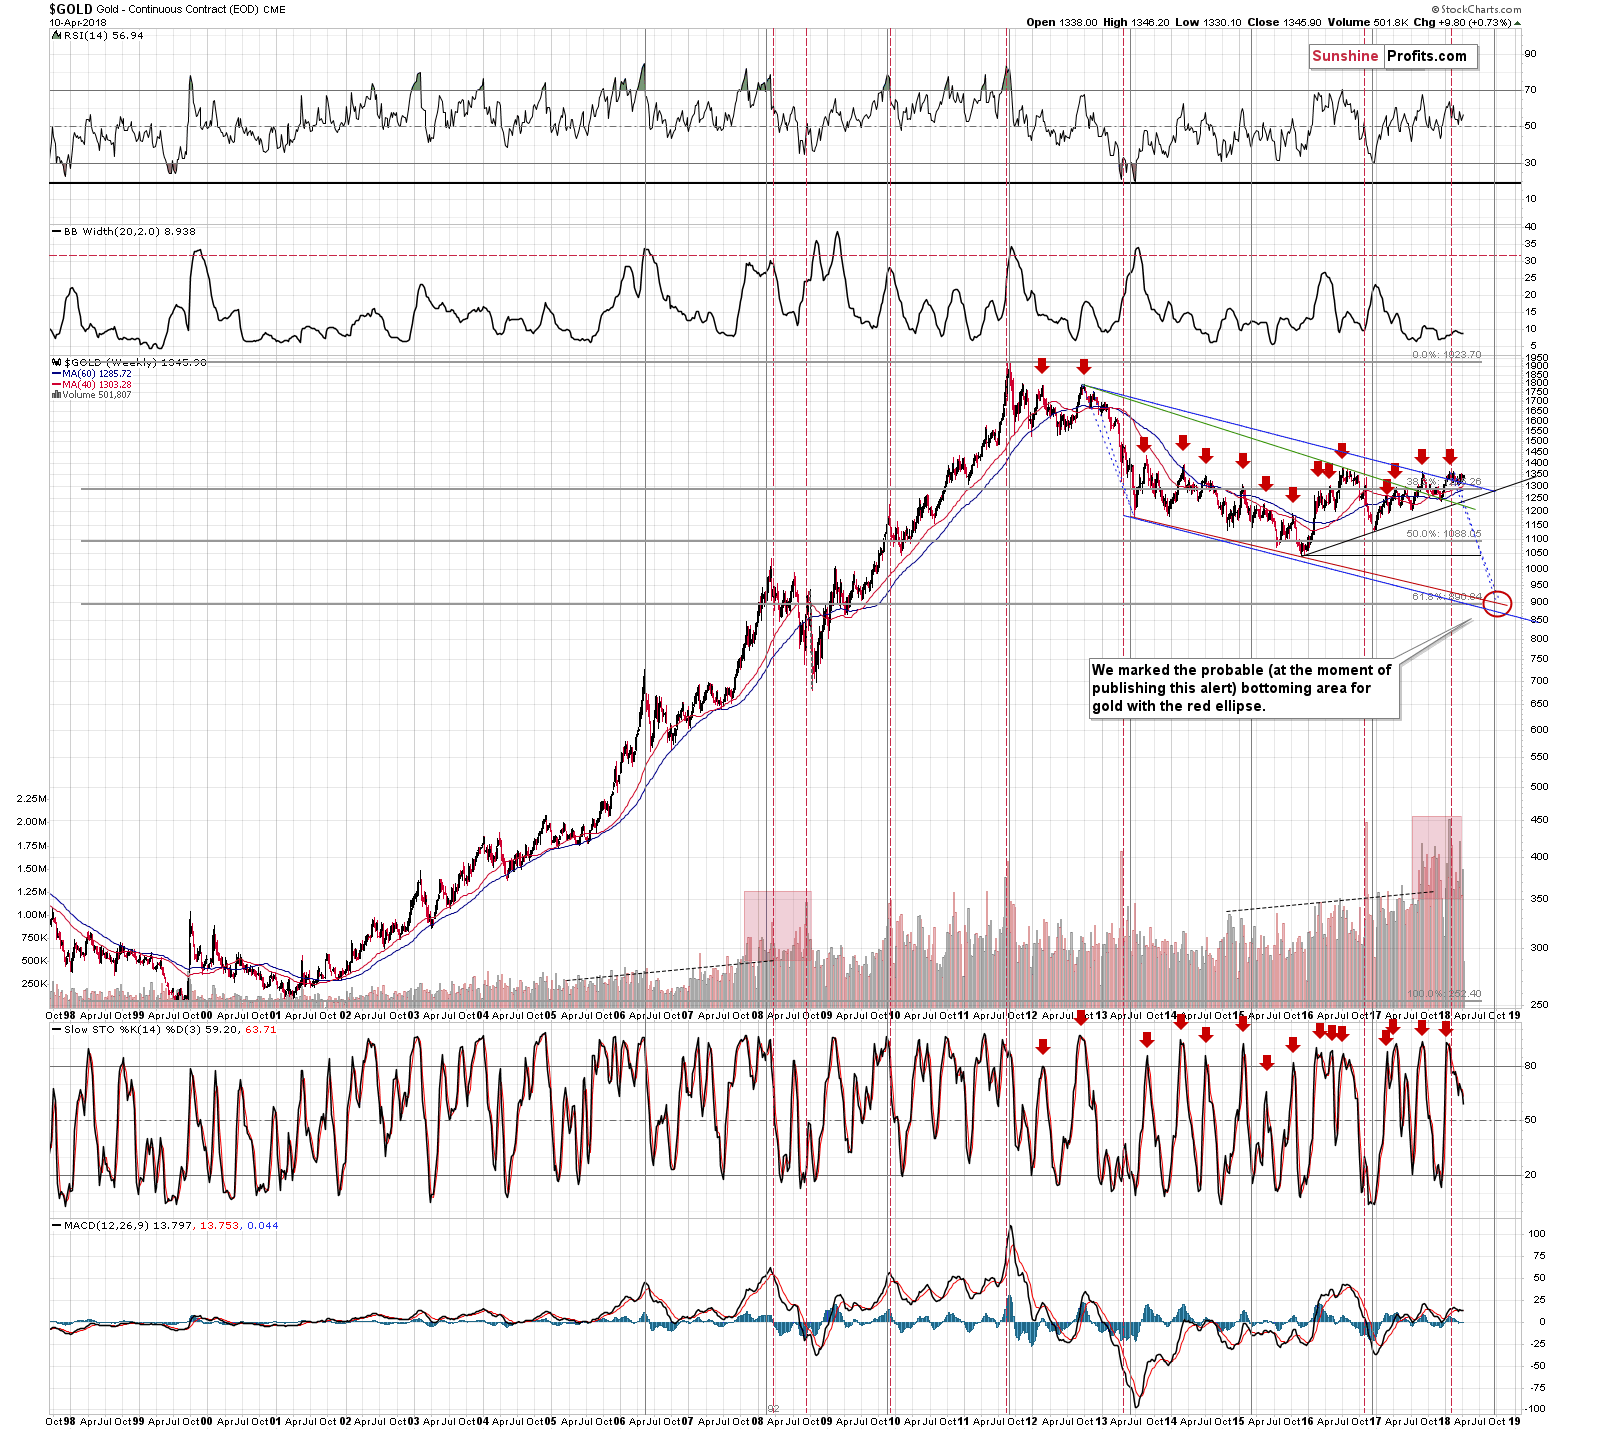
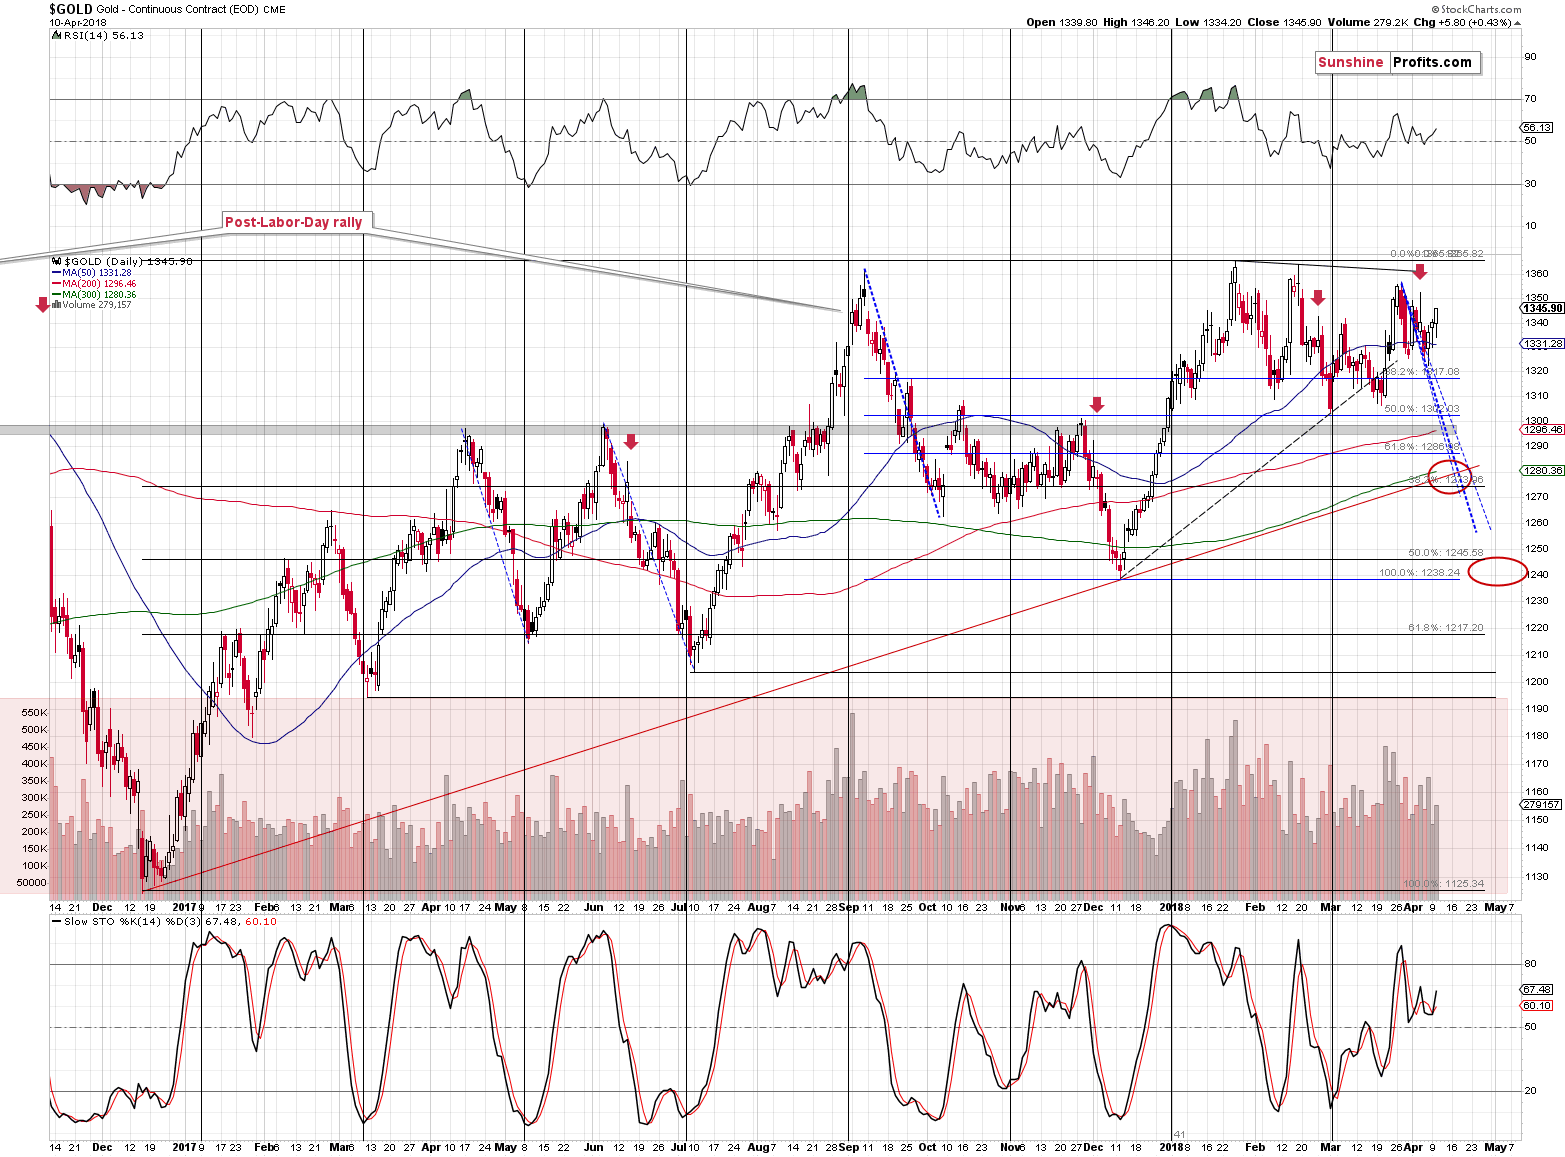
Gold initially declined in tune with the declining blue dashed line and it moved back up while being above the 40- and 60-week moving averages. We saw the same thing recently. Gold’s latest upswing is not a breakout – it’s a part of a self-similar decline.
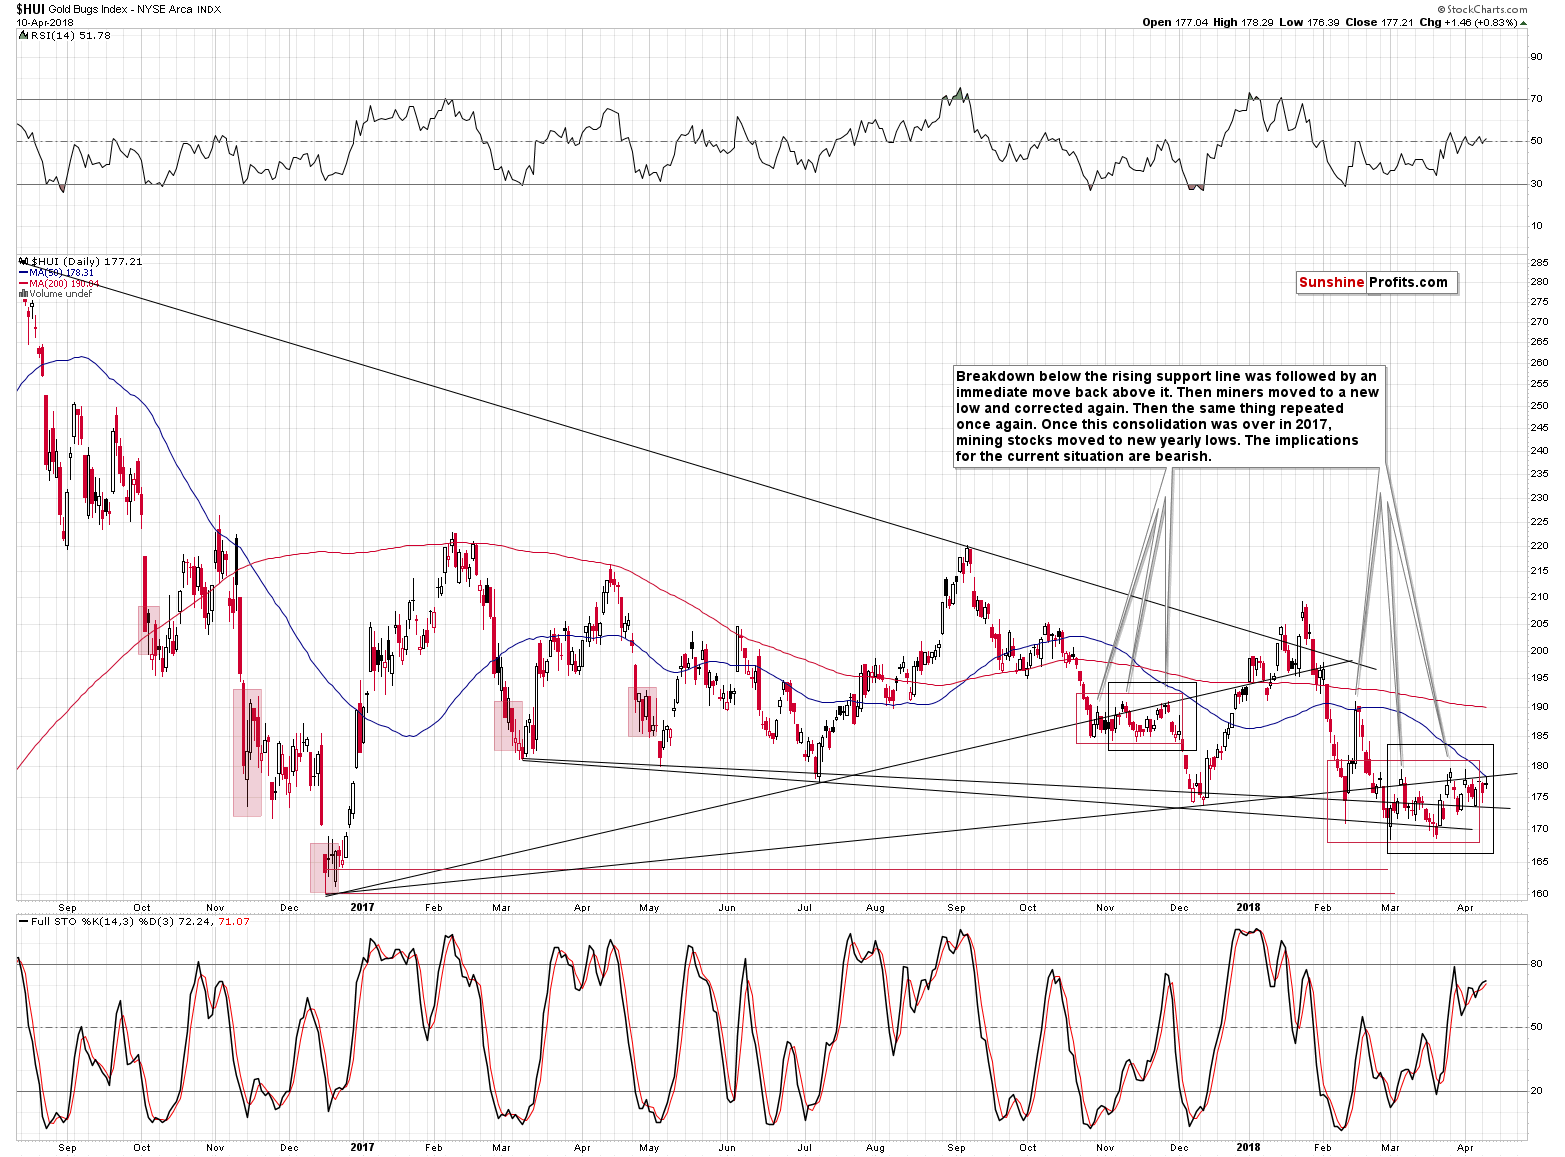
It wouldn’t be as significant if we hadn’t seen the same kind of reaction in the case of gold stocks. But we did.
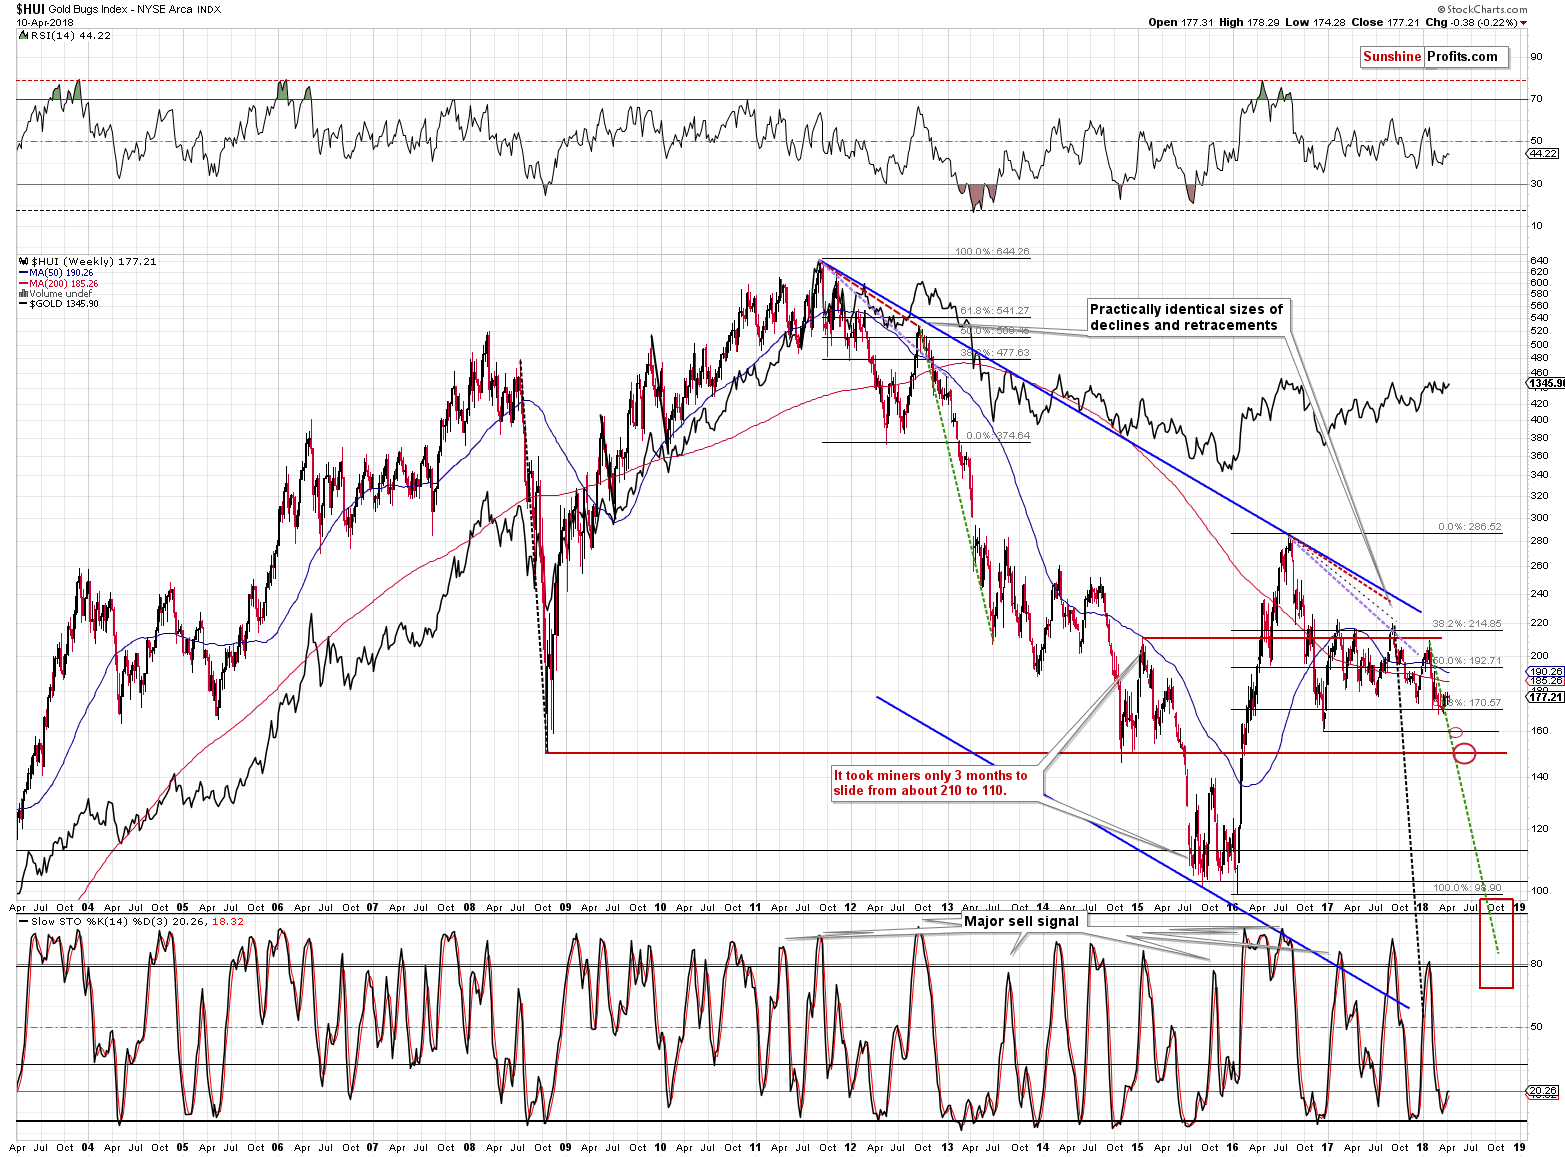
The HUI Index declined quite in tune with the declining dashed line in both 2018 and 2012. In 2012, there was a pause within the huge decline, but it was nothing to call home about. The same is the case now – gold miners moved a bit higher recently, but the move is very small from the long-term point of view.
Everything remains in tune with the previous decline.
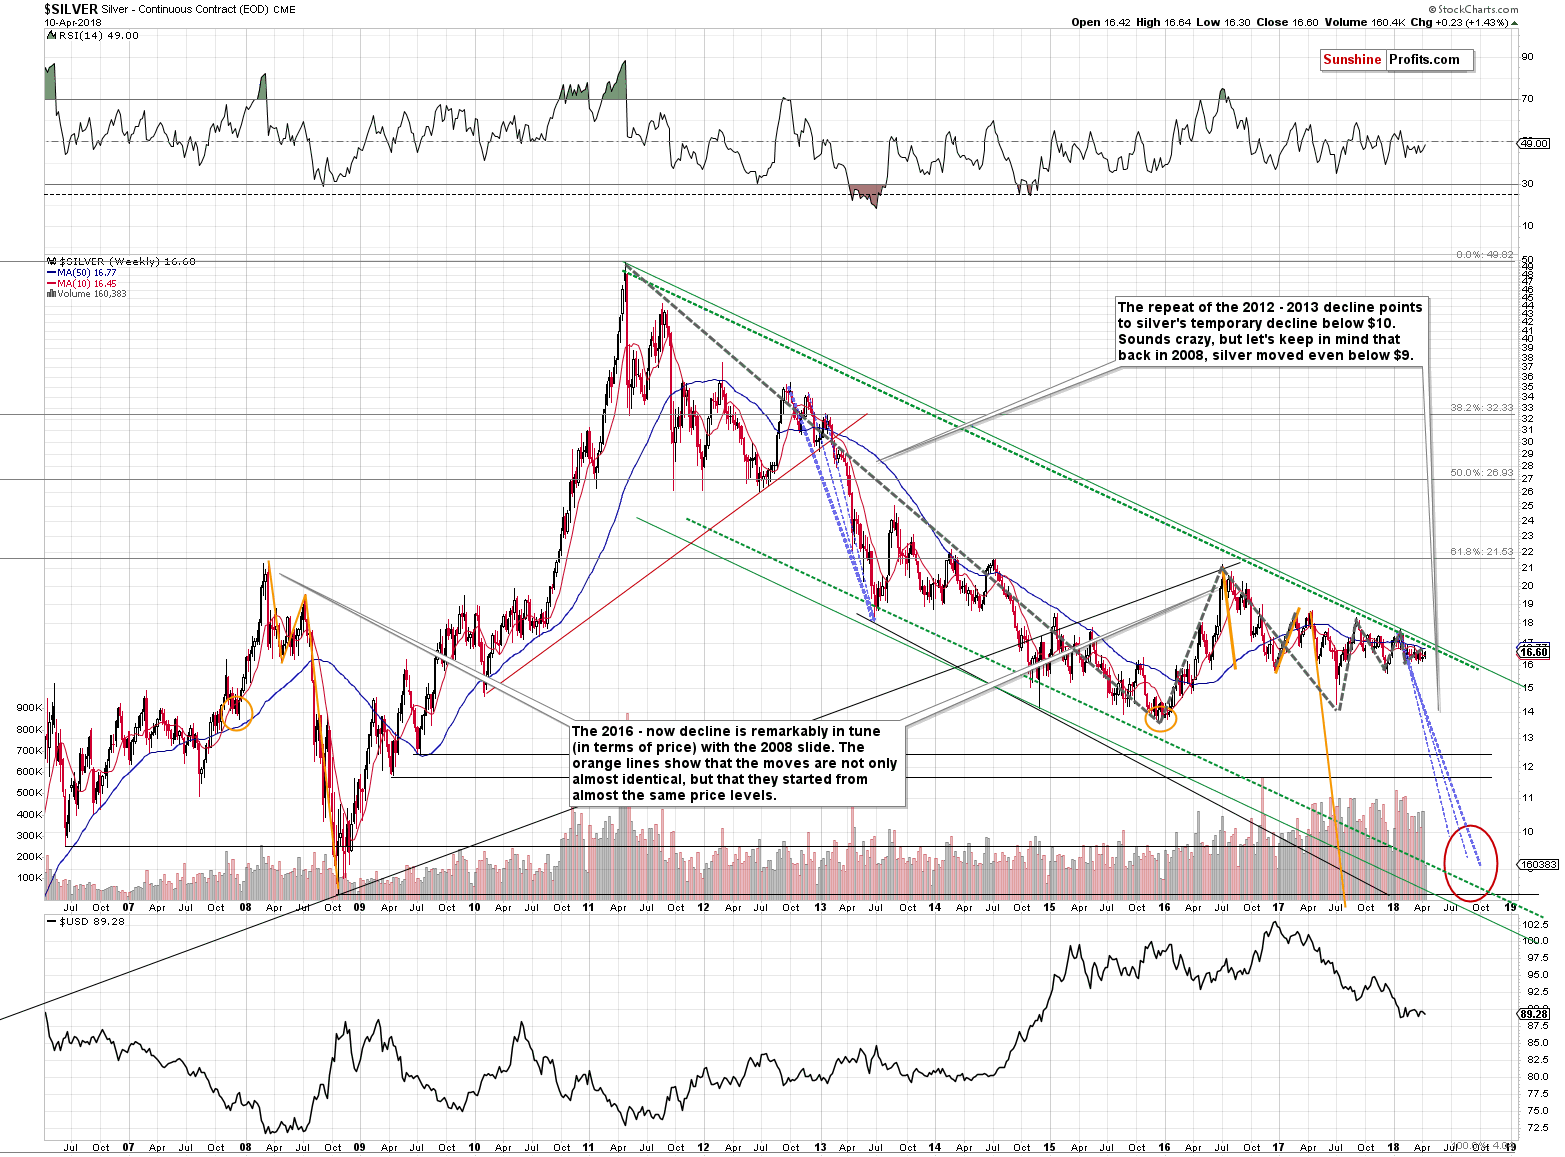
In 2012, silver moved higher along with gold and this time, the white metal underperforms. That’s understandable given the situation in the gold to silver ratio and the oscillating nature of silver’s recent movement.
Namely, the gold to silver ratio could be preparing for the move above its 2003, 2008 and 2016 highs and to move to its real long-term extremes – to the 100 level or its proximity. We discussed details last year, but they remain up-to-date at this time as well (except for the likely timeframe for the final bottom in the precious metals market – based on the data that we have right now, September – October of this year seem to be the most likely months for the big rebound).
OK, so as you see, nothing big really changed. So what did? Why haven’t the PMs declined yet, as one might expect based on the triangle-based reversals?
Let’s take one more look at the charts with reversals before replying to the above.
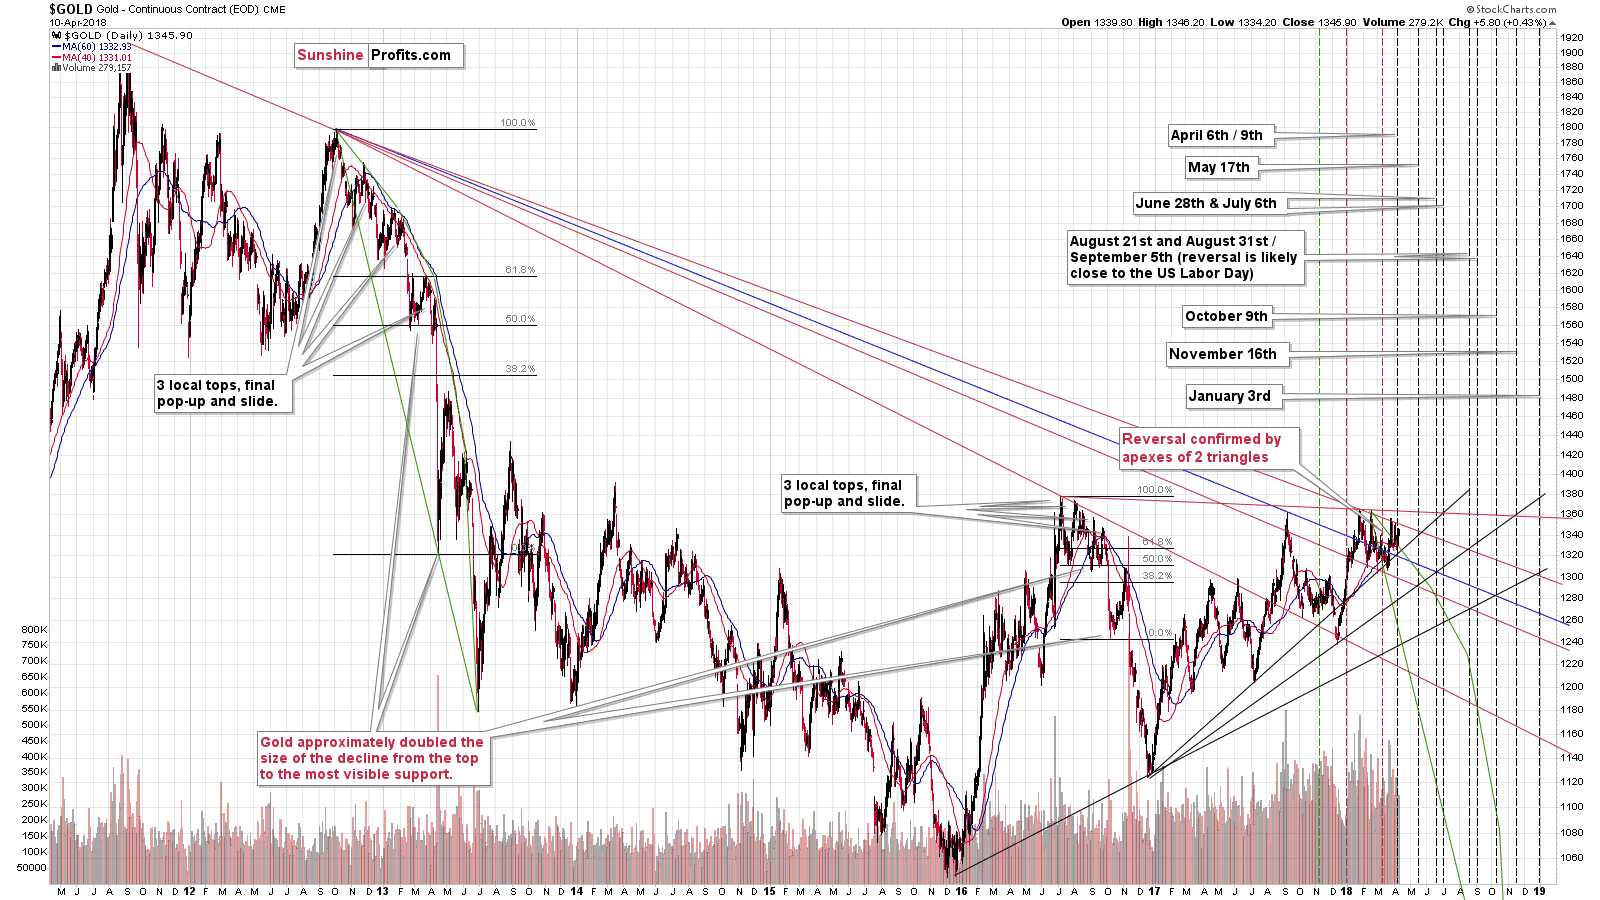
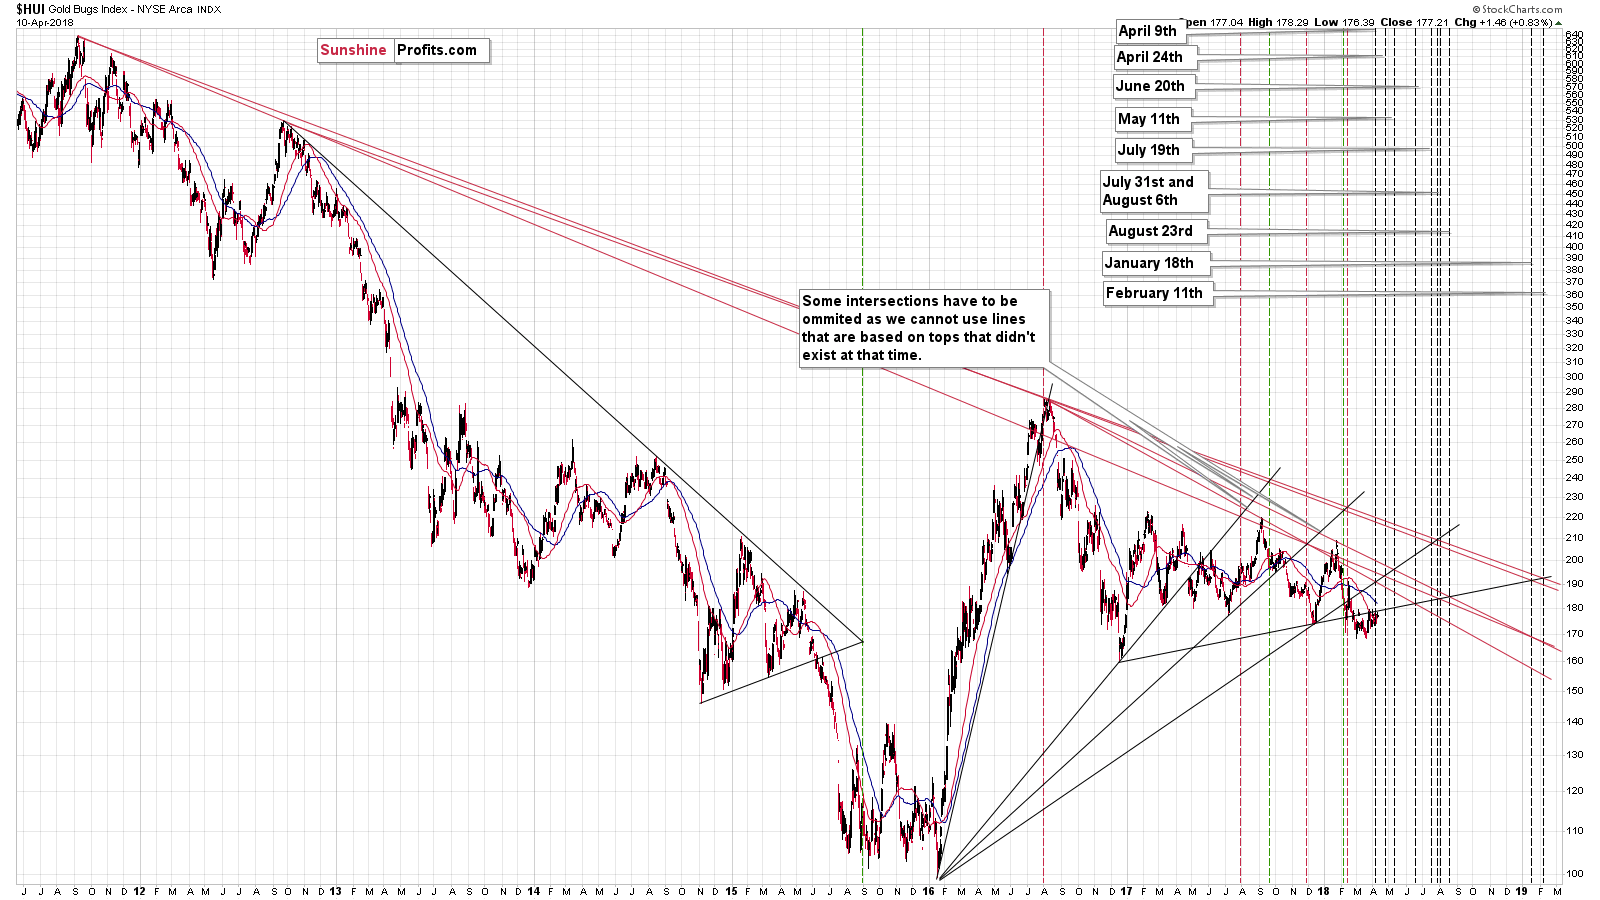
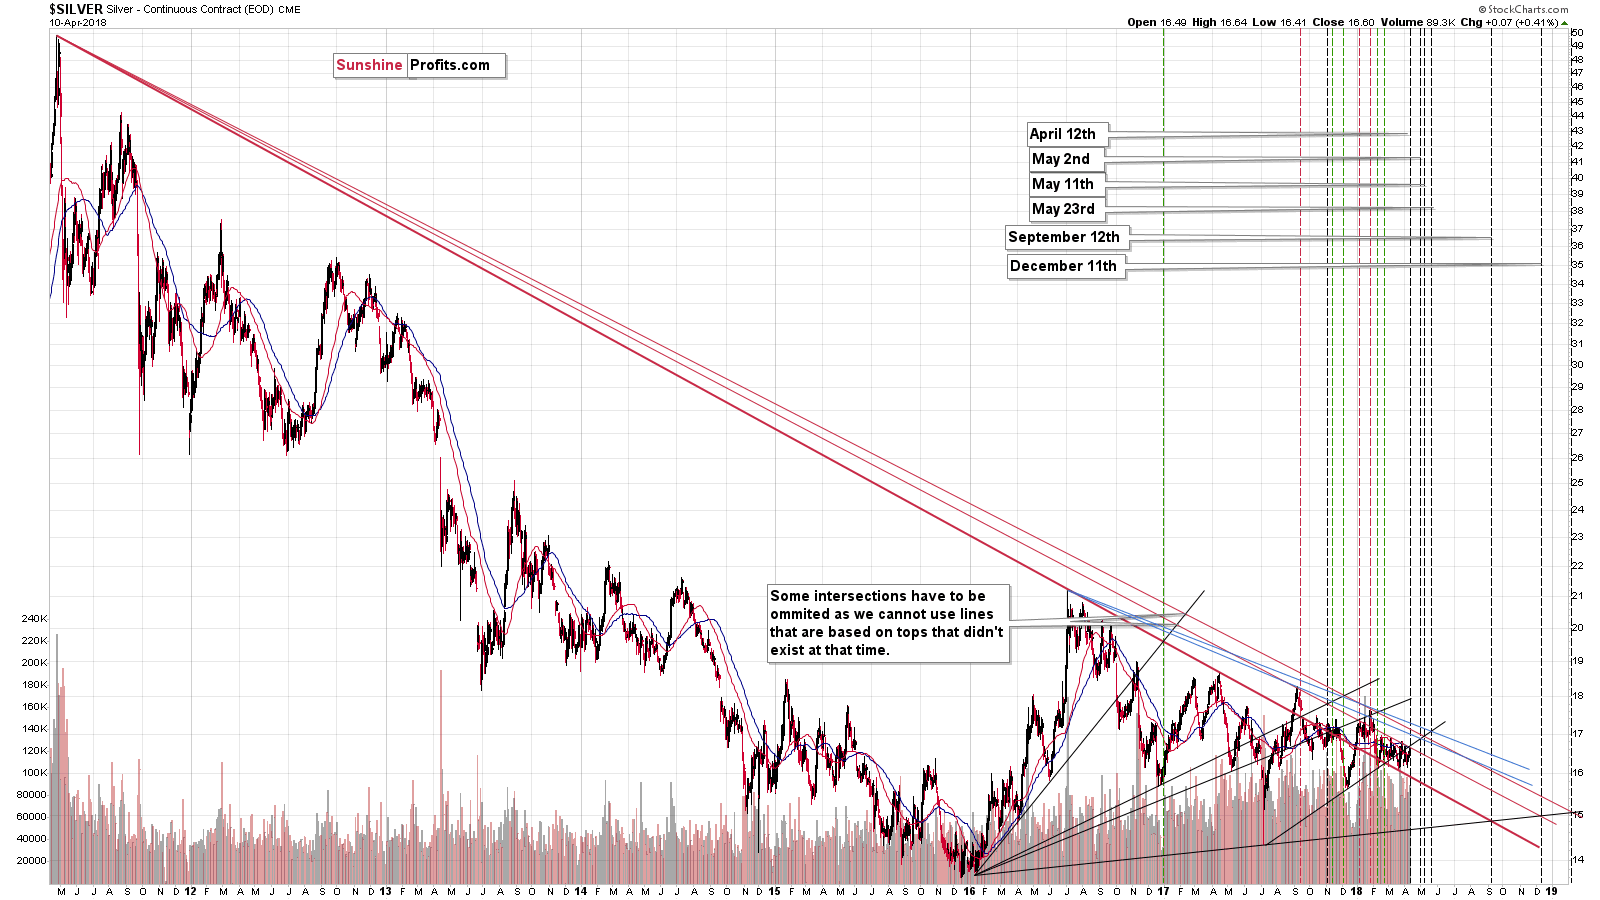
The triangle-apex-based reversals were highly effective in the past and that was the reason why we marked all of the long-term triangles on all 3 above charts.
However, since the charts and lines that we marked are of a long-term nature, then the implications are likely to be severe. However, at the same time, it means that we shouldn’t pay too much attention to them being very precise and we should accept that very short-term deviations are rather normal.
The apex-based reversals were so extremely effective that it was easy to extrapolate that into the future and expect this kind of efficiency each and every time and then be disappointed when things didn’t work out this way. It seems that such expectations were too high. In analogy, if you have a sharpshooter that hit the target that’s one mile away 9 out of 10 times (while everyone else managed to hit it 4 times at best), it’s easy to expect that they will practically always hit it from this distance. But, perhaps this sharpshooter just had a good day? Obviously, this person is very good with guns, but being disappointed if they only hit the target 6 or 7 times on the next day (still performing better than others) is an exaggeration. It would not be something to be disappointed with – it would be a very good outcome.
In the current situation, it might be the case that we shouldn’t expect the apex-based-reversals to work with daily precision. Actually, looking at the above charts, if the real reversal takes place in the same week as the expected reversal date, it should be viewed as very precise.
So, finally, the reply to the “what’s going on” and “what changed” questions is that the interpretation of the apex-based-reversals is changing. Instead of expecting the long-term triangle-apex-based reversals to work precisely on the predicted date, we are moving toward expecting the reversal to take place in the proximity of the target. One week before and after the expected reversal might be too broad, so it seems that a +/- 3-day rule is sufficient.
Today’s session is between the gold / gold stocks’ apex-based reversal date and silver’s reversal date, so if we see a reversal today, tomorrow or on Friday, we will still view it as being in perfect tune with the technique.
Yesterday’s Price Moves
During yesterday’s session, gold, silver and mining stocks moved higher, while the latter underperformed the yellow metal once again, suggesting that the rally is not the true direction of the PM sector.
Please compare the action in gold and gold stocks since the December bottom. Both rallied after it, topping in January. Now, gold is close to the January high, while gold stocks are close to the December low. That’s a clear bearish confirmation – something that we saw at the beginning of the 2012-2013 decline.
Let’s stay with silver for a minute. First of all, our yesterday comments remain up-to-date:
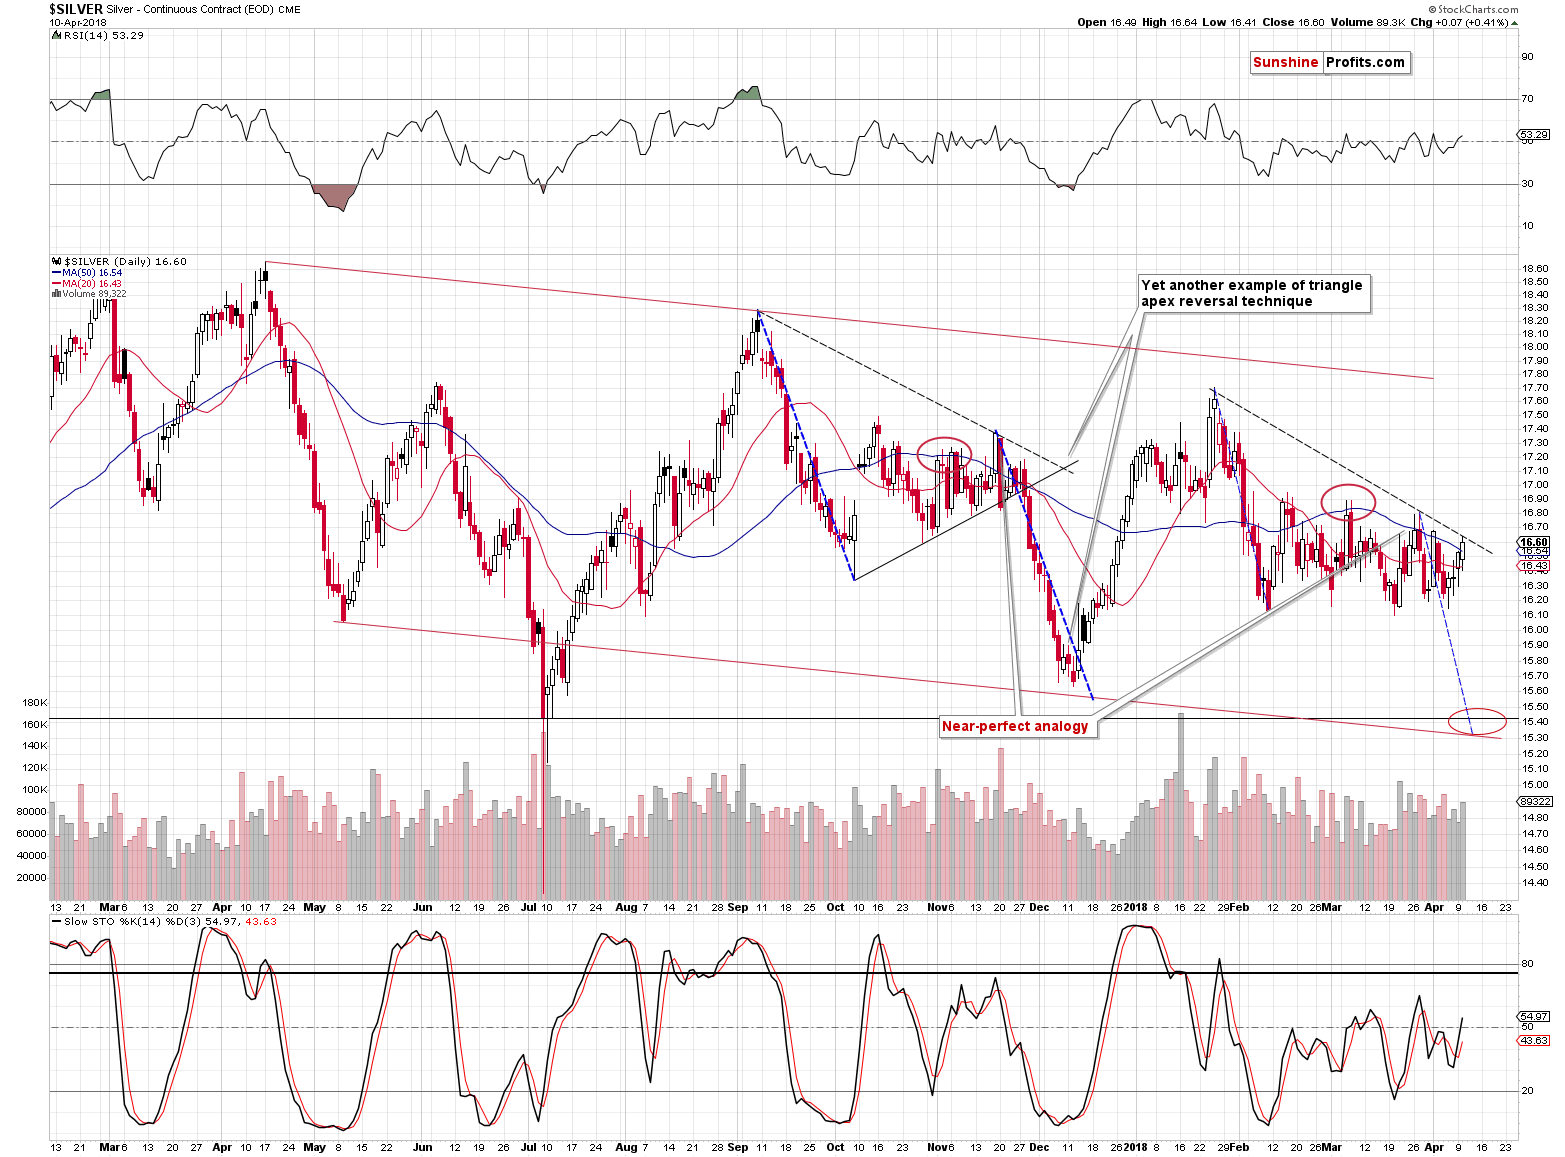
Silver’s performance seems to be now less similar to the September – December pattern as it deviates from the dashed blue line quite visibly. But, that’s not really the case. The consolidation is simply longer this time – the overall shape of both patterns is still remarkably similar. When we finally see the breakdown, the silver price is still likely to move lower in a decisive fashion, just as it moved lower in November and December 2017. When that happens, we’ll simply adjust the declining dashed blue line to the most recent local high in order to get the approximate bottom estimation.
Is silver still likely to form a local bottom later this week? It’s certainly possible – after all, it’s silver and silver is known to do crazy things from time to time (early July 2017). However, it’s also possible that silver moves back and forth with the final intraday top on Thursday or so. Then, the decline would follow.
In other words, we’re likely to substantially profit on the decline in the precious metals market either right away or in a few days. Does it really matter if we have to wait additional several days? Not really.
Secondly, we can say that at this time the scenario in which silver tops tomorrow or close to it (meaning possibly today) is now much more likely than a sudden 2-day decline. The question remains: Why didn’t gold and silver decline but rather move higher instead?
Gold and silver moved higher as they almost had to due to the changes in the forex market.
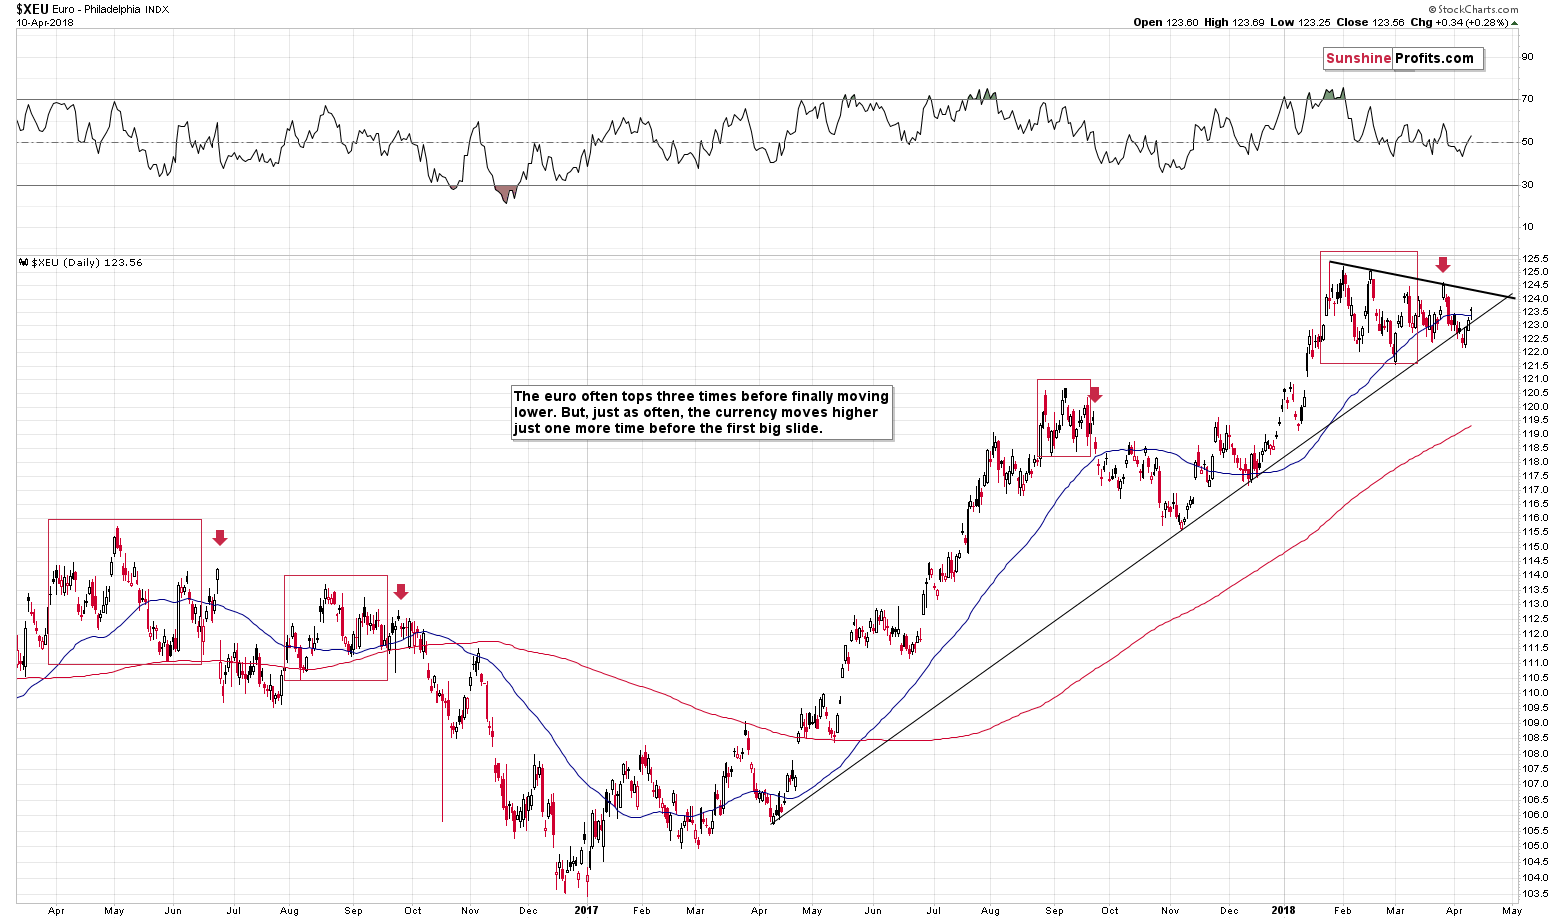
The Euro Index invalidated its breakdown, which improved its short-term outlook. The resistance is quite close (the declining black resistance line) and it seems that most of the rally is already behind us, but still, we could see higher EUR/USD values in the very near term.
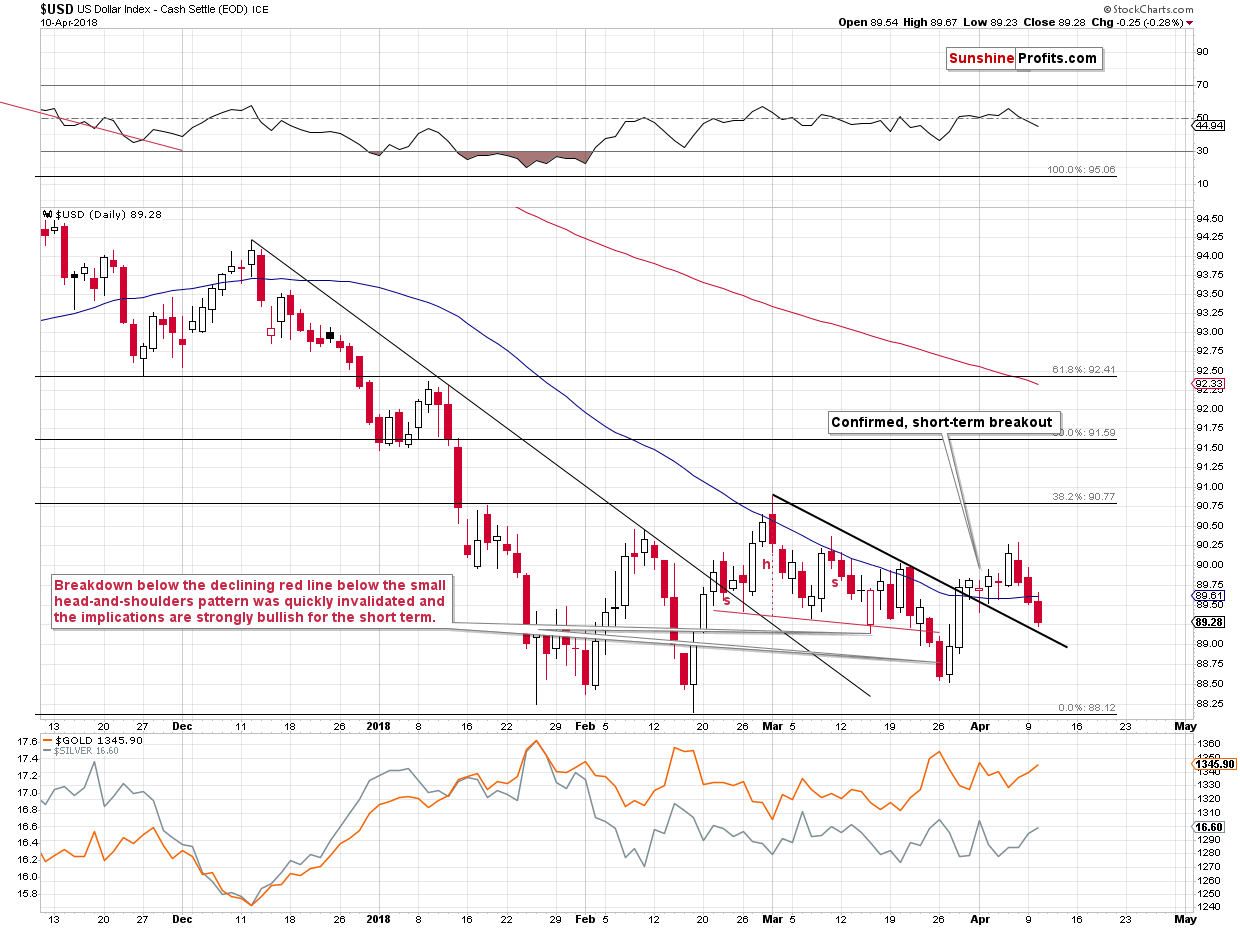
The key word above is “could” – the USD Index is practically at the declining support line, so it might be the case that the move higher in the EUR/USD and the move lower in the USDX is just a verification of the late-March breakout. The move back below the 50-day moving average along with sell signals from the indicators paint a bearish picture, but the mentioned support line could stop the decline.
While the situation in the USD Index is rather unclear for the very short term (it’s bullish for the short, and medium term), the signals are still bearish in the case of the precious metals sector suggesting that even if it doesn’t happen today, PMs are still likely to move lower very soon.
The next question that we received was about option chains: Which ETF has the best option chain? In general, “best” can be understood with regard to the option’s availability and the depth of the market (the amount of options that is traded, which is related to spreads). Long story short, the bigger the market capitalization of a given ETFs and the bigger the volume on it, the more favorable the options on this ETF should be. GLD, SLV and GDX seem to be the most popular ones, so they might be useful with regard to options for gold, silver, and mining stocks, respectively.
The next questions are more complex, so we’ll quote them in their entirety:
Just read predications from Sprott and Goldman Sachs that gold is about to break out to over $1400. Goldman believes that the increasing wealth in Asian economies and the modest fear in the developed world economies will increase gold prices just like they did after the financial crisis. I believe this is a far cry from your technical analysis predications. Why are you so confident that gold will go below $1,000 before year end when fundamentals are starting to work in gold's favor?
As follow-up to my last e-mail, I am reading more and more that gold is beginning its mini-bull market.
From a technical perspective, the GLD chart is showing a bullish inverse head shoulders pattern between Feb 2017 and Feb 2018. All the technicians are saying this is the start of the breakout move up (Citi Group, Raymond James, GS etc.) I certainly believe your analysis is the most thorough, consistent, and unique of all the ones I follow, but the brokerage houses are all beginning to sing the same tune. I still like your contrarian thinking, but what would change your thinking on your bearish PM stance.
Let’s start with the fundamental factors like the increasing wealth in the Asian economies and the modest fear in the developed world economies. The fundamental factors are reasons for gold to move up or down in the long run (say, in years) – they are not factors that will cause gold to break above or below a certain price level or support/resistance line. The final chapter of this month’s Market Overview report provides a fundamental reasoning for applying the technical tools and not classic fundamental ones while making near- and medium-term forecasts for gold.
Also, we don’t agree that fundamentals are starting to work in gold’s favor. We think that in general, the fundamentals hasn’t stopped being positive for the gold market yet – that’s why we expect the price of gold to move well above its 2011 top before the next long-term rally is over. The main reason for which we think that gold is likely to move lower despite its positive fundamental situation is that it was not hated enough in late 2015 and thus the natural cycle that all markets follow was not completed. The markets move from being hated and forgotten to being loved and vice versa. Gold was certainly being loved at the 2011 top, but it didn’t move to the hate stage in late 2015. We saw the results of gold surveys and we know from correspondence with many investors that they didn’t really stop believing in the upcoming rally. That’s the major reason and there are multiple, long-term technical signals that confirm this outlook, gold stocks’ severe underperformance of gold being the most prominent one.
Regarding the existence of the bullish inverse head-and-shoulders pattern in gold (and thus GLD), we discussed that several months ago, when gold was at $1,350. You can read the detailed commentary in the September 11, 2017 Alert, but the long-story-short version is that until the pattern is completed (we see a breakout above the neck level of the pattern) and verified (gold holds above this pattern for at least 3 trading days or confirms the breakout with huge volume), there is absolutely no pattern to speak of – only a possibility of seeing the pattern. If an incomplete pattern had had any implications, it would have already – by itself – become a pattern. In other words, until the pattern is completed and verified, there are no bullish implications thereof and claiming otherwise without providing justification is a logical error.
By the way, if all the brokerage houses are becoming bullish, it may be a contrarian sell signal. Also, we find it hard to trust the analyses and their objectivity. For instance we work for you – our subscribers – and our clients through other trading arrangements, but the analysis is always consistent and the trades that we describe here are the same trades that we’re making. The analytical divisions of brokerages and investment banks, however, may not work in exact tune to each other. In fact, they could work in an entirely different way. Big financial institutions’ analyses often have impact on the market, so the sector in general has motivation to provide investors with false analyses that only aim to generate better entry prices for the trading divisions, which would take the opposite position. This is most likely not done in general, but we can’t rule out that it happens occasionally, before the biggest moves.
As far as what the “would change our mind regarding the PM outlook” question is concerned, we don’t have a direct reply. Well, we have millions of replies as there are multiple combinations of factors that would make the outlook bullish and it’s impossible to list them all. For instance, World War 3, or gold’s sudden rally of $200+. The problem is that it’s usually not just one factor that changes the outlook, but a combination of factors. Would a rally of $50 in gold be a very bullish factor? Some might say yes, but what if at the same time gold stocks declined? It would be a very bearish combination of factors. If gold broke above the key resistance levels, gold stocks would be leading the way higher and all that would take place without the USD’s help – that would be a very bullish scenario. However, at this time we are very far from this situation. Gold is not breaking above the previous highs; gold stocks are underperforming in a quite extreme manner and the declines in the USD Index along with new geopolitical news (trade conflict between the U.S. and China) seem to be the only things that prevent gold from falling. This is exactly the opposite of a situation that would make us become bullish on gold.
Naturally, once gold becomes publicly hated at much lower prices, we’ll move to the bullish camp.
The final question is one about an article with supposedly bullish comments:
hello, please send this article to the author of gold alerts. this is a technical case for a solid bullish case. i think its time he looks at a solid bullish case. https://investinghaven.com/next-big-move/gold-price-breaks-out-bull-market-2018/
In our direct reply, in addition to the text you’ll read below, we asked to clarify what precisely are the solid bullish factors, but we never received a reply. Consequently, we’re discussing what we found.
The suggestion that higher lows point to higher prices is a weak bullish point - it only shows that the medium-term trend was up but it’s not a reason to expect a breakout in gold, especially that gold was unable to break out despite a breakdown in the USDX.
The quote “we anticipate it will be maximum a couple of months, and maybe around summer time in 2018 a new gold bull market may start” doesn’t have bullish implications. “Around summer time” could mean September, with which we actually agree - gold may bottom at that time. There are five more months until September, and if gold is to bottom then, we should be expecting a 5-month decline.
There is also another statement that says the following:
“The weekly gold chart looks great right now. The breakout is a fact, though it must be confirmed. We consider this confirmation is done once gold remains for 3 consecutive weeks above $1375.”
It’s not clear what breakout the author refers to. The chart below this statement doesn’t feature any breakout - it shows gold below a horizontal resistance line. The author writes that 3 consecutive weeks above $1,375 would be required, which implies that gold has broken above this level - that clearly wasn’t the case.
There were also remarks about the CoT report, which we covered in one of the previous analyses.
Summary
Summing up, it seems that we’re about to see a decline in precious metals based on the recent move higher and the triangle-apex-based reversals in gold, gold stocks, and silver. The apex-based-reversals continue to be a very useful tool, but it seems that their reversal dates should be used on a near-to basis instead of being precise targets. The situation in the forex market is not crystal clear regarding the very short term, but in light of multiple bearish signs for the precious metals market that we’ve been seeing in the recent days, it seems that adjusting positions in the PMs or mining stocks is not really justified – the following downswing could be too volatile to try to re-enter the market at better price levels than the current ones. Consequently, the outlook remains bearish even though we could see a counter trend upswing today.
As far as today’s pre-market upswing in gold is concerned, it’s likely yet another geopolitical-news-based rally that’s only visible in gold (silver didn’t move visibly higher). You can read details here, and as far as implications are concerned, please keep in mind that the impact of such news is usually very temporary. Today’s volatility in gold could also be the result of the pre Fed-Minutes tensions, which are likely to subside later today – after the Minutes are released.
As always, we will keep you – our subscribers – informed.
To summarize:
Trading capital (supplementary part of the portfolio; our opinion): Full short positions (200% of the full position) in gold, silver and mining stocks are justified from the risk/reward perspective with the following stop-loss orders and initial target price levels:
- Gold: initial target price: $1,218; stop-loss: $1,382; initial target price for the DGLD ETN: $53.98; stop-loss for the DGLD ETN $37.68
- Silver: initial target price: $14.63; stop-loss: $17.33; initial target price for the DSLV ETN: $33.88; stop-loss for the DSLV ETN $21.48
- Mining stocks (price levels for the GDX ETF): initial target price: $19.22; stop-loss: $23.54; initial target price for the DUST ETF: $39.88; stop-loss for the DUST ETF $21.46
In case one wants to bet on junior mining stocks' prices (we do not suggest doing so – we think senior mining stocks are more predictable in the case of short-term trades – if one wants to do it anyway, we provide the details), here are the stop-loss details and initial target prices:
- GDXJ ETF: initial target price: $27.82; stop-loss: $36.14
- JDST ETF: initial target price: $94.88 stop-loss: $41.86
Long-term capital (core part of the portfolio; our opinion): No positions (in other words: cash)
Insurance capital (core part of the portfolio; our opinion): Full position
Important Details for New Subscribers
Whether you already subscribed or not, we encourage you to find out how to make the most of our alerts and read our replies to the most common alert-and-gold-trading-related-questions.
Please note that the in the trading section we describe the situation for the day that the alert is posted. In other words, it we are writing about a speculative position, it means that it is up-to-date on the day it was posted. We are also featuring the initial target prices, so that you can decide whether keeping a position on a given day is something that is in tune with your approach (some moves are too small for medium-term traders and some might appear too big for day-traders).
Plus, you might want to read why our stop-loss orders are usually relatively far from the current price.
Please note that a full position doesn’t mean using all of the capital for a given trade. You will find details on our thoughts on gold portfolio structuring in the Key Insights section on our website.
As a reminder – “initial target price” means exactly that – an “initial” one, it’s not a price level at which we suggest closing positions. If this becomes the case (like it did in the previous trade) we will refer to these levels as levels of exit orders (exactly as we’ve done previously). Stop-loss levels, however, are naturally not “initial”, but something that, in our opinion, might be entered as an order.
Since it is impossible to synchronize target prices and stop-loss levels for all the ETFs and ETNs with the main markets that we provide these levels for (gold, silver and mining stocks – the GDX ETF), the stop-loss levels and target prices for other ETNs and ETF (among other: UGLD, DGLD, USLV, DSLV, NUGT, DUST, JNUG, JDST) are provided as supplementary, and not as “final”. This means that if a stop-loss or a target level is reached for any of the “additional instruments” (DGLD for instance), but not for the “main instrument” (gold in this case), we will view positions in both gold and DGLD as still open and the stop-loss for DGLD would have to be moved lower. On the other hand, if gold moves to a stop-loss level but DGLD doesn’t, then we will view both positions (in gold and DGLD) as closed. In other words, since it’s not possible to be 100% certain that each related instrument moves to a given level when the underlying instrument does, we can’t provide levels that would be binding. The levels that we do provide are our best estimate of the levels that will correspond to the levels in the underlying assets, but it will be the underlying assets that one will need to focus on regarding the signs pointing to closing a given position or keeping it open. We might adjust the levels in the “additional instruments” without adjusting the levels in the “main instruments”, which will simply mean that we have improved our estimation of these levels, not that we changed our outlook on the markets. We are already working on a tool that would update these levels on a daily basis for the most popular ETFs, ETNs and individual mining stocks.
Our preferred ways to invest in and to trade gold along with the reasoning can be found in the how to buy gold section. Additionally, our preferred ETFs and ETNs can be found in our Gold & Silver ETF Ranking.
As a reminder, Gold & Silver Trading Alerts are posted before or on each trading day (we usually post them before the opening bell, but we don't promise doing that each day). If there's anything urgent, we will send you an additional small alert before posting the main one.
=====
Latest Free Trading Alerts:
Monday’s session was very good for the sellers. Although their opponents took USD/CAD higher, the previously-broken support/resistance line stopped them, triggering a sharp pullback and making currency bears more profitable. Is the worst already behind currency bulls?
USD/CAD – Verification of Breakdown and Its Consequences
=====
Hand-picked precious-metals-related links:
PRECIOUS-Gold rises as risk aversion hurts equities and dollar
Bundesbank Pulls All Stops to Show Germans Their Gold Is Real
=====
In other news:
Global stocks shaky as Syria tensions pound Russia's rouble
European shares rise after China's Xi backs away from trade war
Russia warns any U.S. missiles fired at Syria will be shot down
IMF boss says world trade system in danger of being torn apart
Portugal is set to break away from a 25-year long budget deficit
Copper supply crunch earlier than predicted — experts
New Data on Cryptocurrency Trading Underscores Japan as a Major Hub
Bitcoin Plunges; Bank of America Says Crypto Bubble Is Popping
=====
Thank you.
Sincerely,
Przemyslaw Radomski, CFA
Founder, Editor-in-chief, Gold & Silver Fund Manager
Gold & Silver Trading Alerts
Forex Trading Alerts
Oil Investment Updates
Oil Trading Alerts

