

Briefly: in our opinion, full (300% of the regular position size) speculative short positions in mining stocks are justified from the risk/reward point of view at the moment of publishing this Alert.
Welcome to this week's flagship Gold & Silver Trading Alert. As we promised you previously, in our flagship Alerts, we will be providing you with bigger, more complex analyses (approximately once per week) and it will usually take place on Monday. This week it's a bit different as there was no trading in the U.S. yesterday due to the market holiday.
The outlook that we featured latest, didn't change based on last week's price moves as prices generally moved in tune with our expectations. Consequently, there are parts of the previous analysis that didn't change in the previous days - we will put them in italics.
Before discussing the technical picture, we'd like to write a few words on the recent fundamental developments. This time, we'll focus on the decline in the unemployment rate.
The U.S. labor market improved in August, although headlines paint too rosy a picture. What does it all mean for the gold market?
Great news for the U.S. labor market: according to the BLS, the American economy regained 1.4 million jobs, while the unemployment rate fell below 10 percent for the first time in the pandemic era! To be more precise, the unemployment rate declined from 10.2 percent in July to 8.4 percent in August, as the chart below shows.
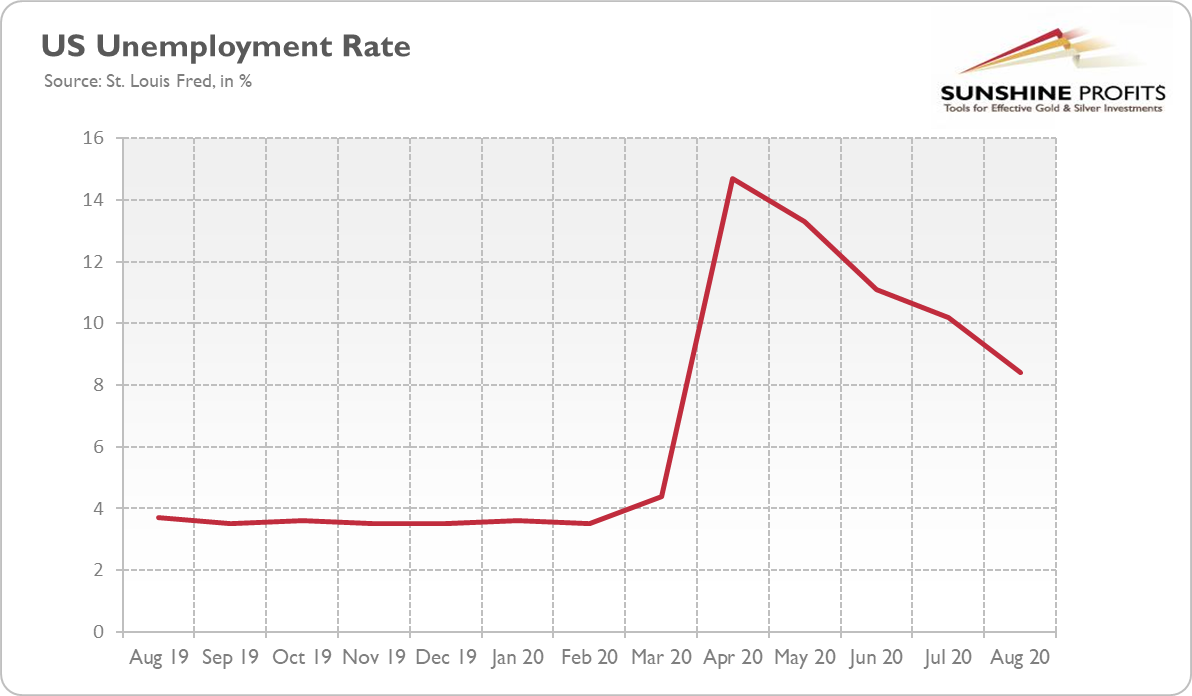
Importantly, the fall in the unemployment rate was bigger than expected - and it was accompanied by an increase in the labor-force participation rate, from 61.4 to 61.7 percent, which makes the decline in the unemployment rate even better.
The headline numbers are, thus, negative for the gold market. They reflect improvements in the labor market and the continued recovery of the economic activity from the coronavirus crisis and the Great Lockdown.
However, when we dig deeper, we will see less rosy picture. First of all, as one can see in the chart below, the pace of the U.S. employment growth has seriously slowed down from gains of 2.7 million, 4.8 million, and 1.8 million in May, June and July, respectively. It indicates that the nonfarm payrolls are clearly losing momentum.
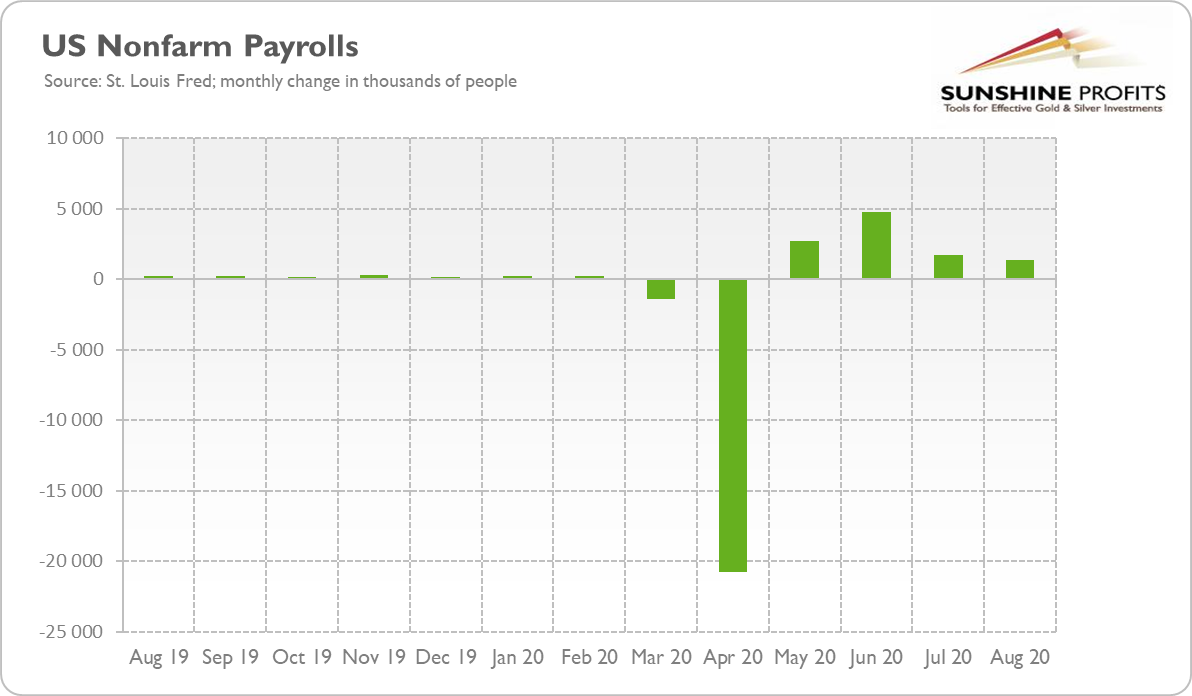
Moreover, the 238,000 jobs were created only temporarily due to the Census 2020. And we cannot forget that the unemployment rate remains relatively high, especially when compared with a 3.5 percent rate before the outbreak of the epidemic. So, there is still a long way to get back to the pre-COVID levels and trajectory.
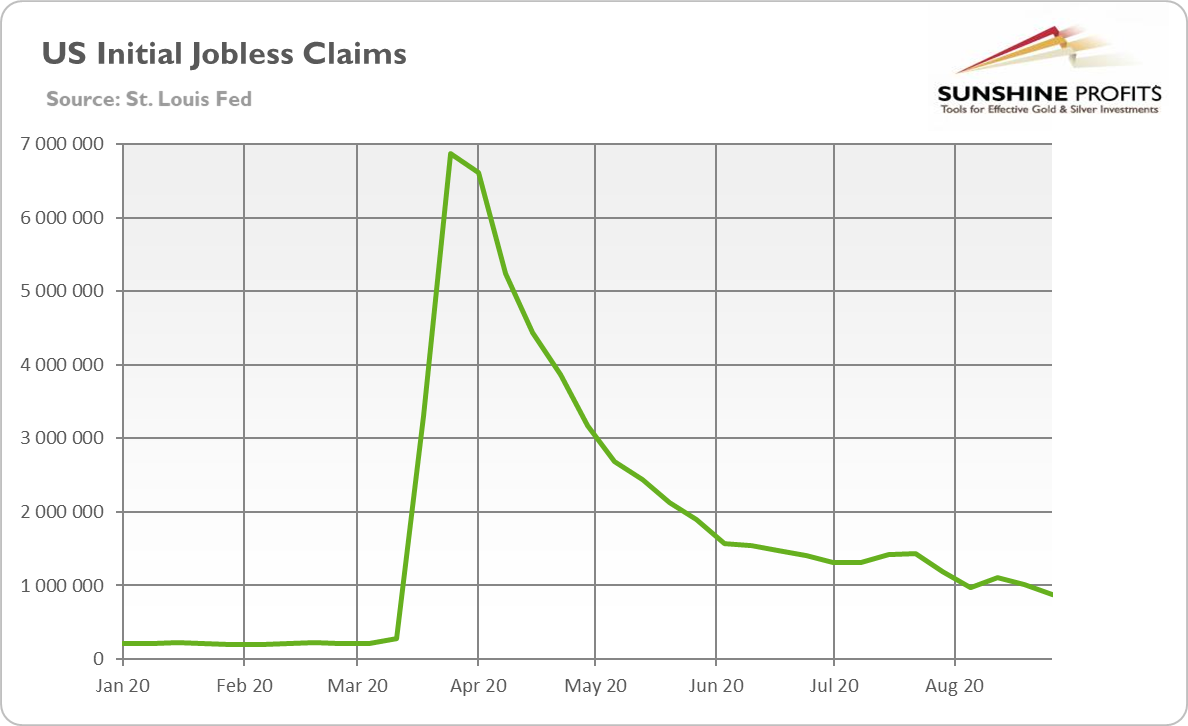
Another example showing that investors should always take headline numbers with a pinch of salt, are the initial jobless claims. They fell sharply by 130,000 to a seasonally adjusted 881,000 in the last week of August (see the chart below), but the decrease was caused by a methodological change in how the data is adjusted to account for seasonal swings in employment.
What does it all imply for the gold market? Well, the decline in the unemployment rate is negative for gold prices, as it could restore the confidence in the vigorous economic rebound. Indeed, the price of gold declined initially in response to the release of the Employment Situation Report.
However, the fact that the U.S. job growth slowed further in August is worrisome. The slowdown shows the fragility of the current economic recovery and puts its stability into question without the new government's financial stimulus package. The uncertainty about the pandemic and economic recovery should maintain the demand for gold as a safe-haven asset and a portfolio diversifier.
So, in the short-term, the correction in the gold market could continue. The inability of gold to rally after the Fed announced its dovish change in the inflation-targeting regime looks bearish and may indicate that gold has already priced in a more inflationary Fed. The improved epidemiological situation and economic recovery could also add some downward pressure on the gold prices.
However, the fundamental outlook for gold remains bullish. The monetary policy remains easy, while the real interest rates will remain ultra low or even negative for years. The fiscal deficits and public debts are ballooning. In such a macroeconomic environment, gold should shine in the long-run.
And do not underestimate the power of the dovish side! After all, last week, the Fed acknowledged that the Philips curve is dead, so it will permit the economy to expand and inflation to increase to a higher level without the need to hike interest rates. In other words, the Fed promised to keep the federal funds rate near zero for a few more years without worrying about inflation. As it has become even clearer that the Fed is more concerned about the weak economy than inflation, we are even more certain that the real interest rates will remain at ultra-low levels for years, which will continue to push investors toward gold.
All in all, there are multiple fundamental reasons due to which gold is likely to soar in the upcoming years, however, even the most profound bull markets can't move up in a straight line and some corrections will take place. After big rallies, we're likely to see big corrections, and one is long-overdue in case of the precious metals market.
Just as it was in March, it seems that the visible worsening in the economic situation might trigger a sell-off.
At this point we would like to quote what we wrote about the aspects of the virus scare and how the market reacts to them. In short, gold (and other markets) reacted when people started to strongly consider the economic implications and this topic was ubiquitous in the media.
The particularly important factor for gold will likely be the economic implications of the second Covid-19 wave. How do we know that? Because we compared what people were searching for (online) with how gold prices shaped. There's a lot more data available on https://searchingcovid19.com/ but we'll focus on the chart that shows when people were getting interested in what aspects of the pandemic and we'll compare them to gold.
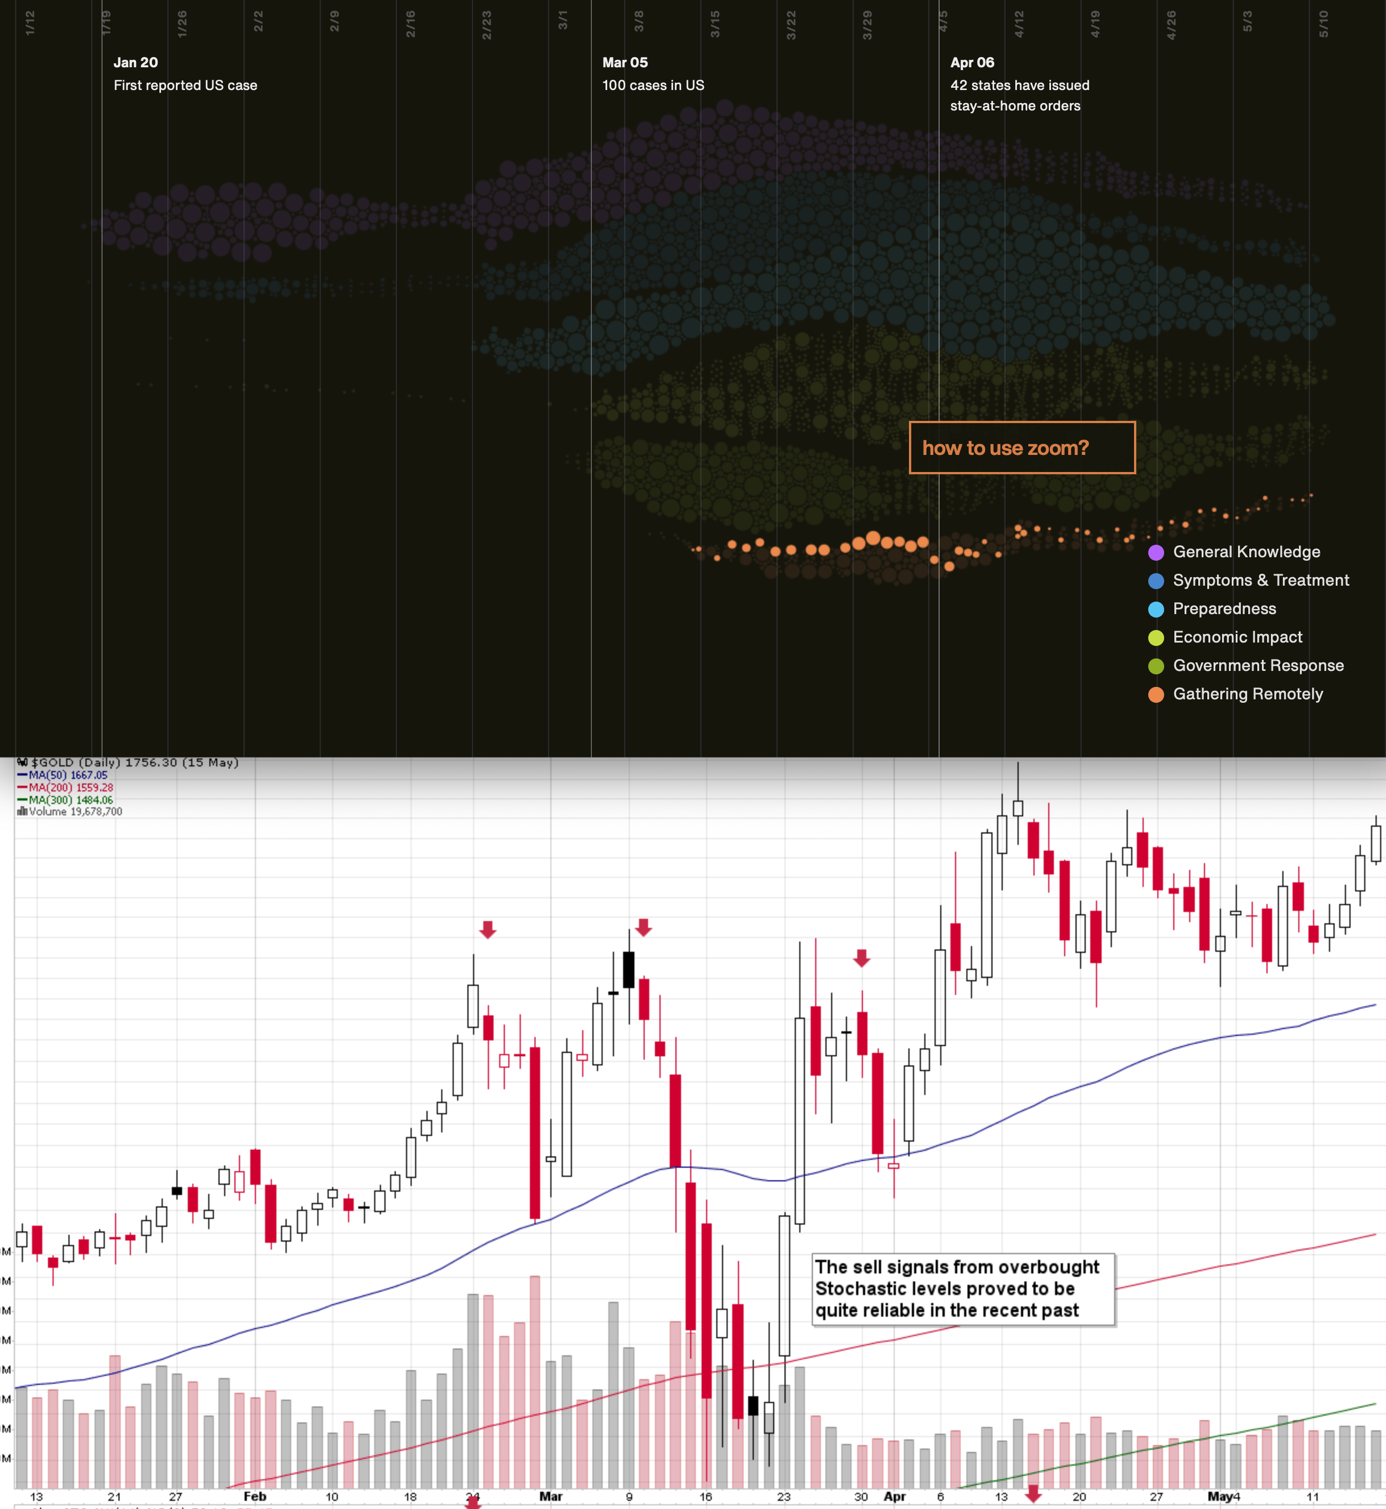
We aligned both charts with regard to time. The chart on the bottom is from Stockcharts.com and it features gold's continuous futures contract. The gold price (and the USD Index value) really started to move once people got particularly interested in the economic impact of the pandemic and in the government's response.
In the recent days (and weeks) the news is dominated by other issues. Once people start considering the economic implications of the second wave of this coronavirus, the prices would be likely to move.
The news coming from the Fed is positive for gold in the long run, but in the short term, they continue to indicate risk for the economy. This risk is likely to translate into lower stock values and initially gold is likely to slide given the above - just like it did in March.
All in all, gold is likely to rally far in the long run, but in the short run it's vulnerable to a sizable decline, when the economic implications of the pandemic's continuation become obvious to investors.
Stocks and the Dollar Weigh In
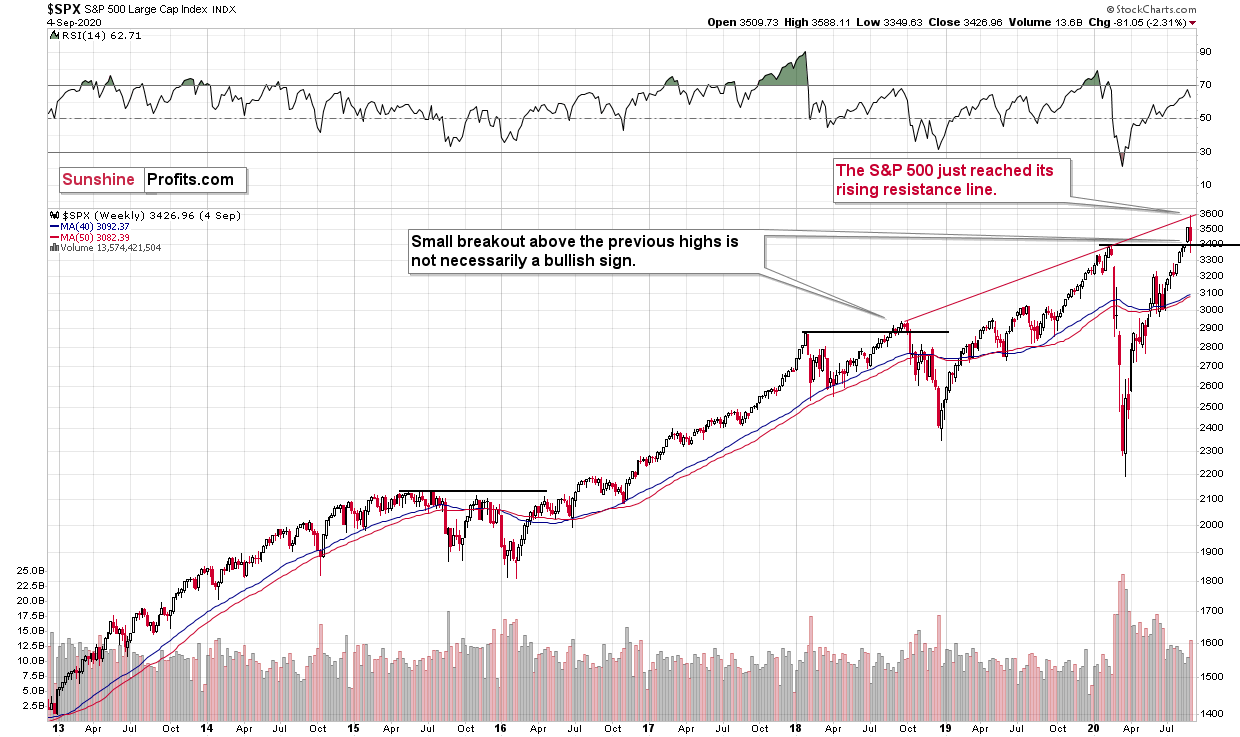
The S&P 500 has just moved sharply above previous 2020 high, but it declined - also sharply - shortly thereafter. Once S&P reached the rising red resistance line, it turned south. Stocks haven't invalidated their move below the previous 2020 high, though, which means that they remain fairly strong.
Given the economic background, I find this performance unfounded. But the markets can stick to a certain emotional trend for longer than many investors can remain logical, which would fit the above picture.
Back in 2018 stocks topped a bit above their previous highs, so the recent breakout is not yet a fully bullish sign. The invalidation of the breakout would, however, be a clear bearish indication. And I think we'll see one soon - quite likely as the USD Index rallies.
Do you remember what happened in February when the S&P 500 lost its upward momentum? Stocks plunged, and that was when tops in mining stocks and silver formed. Gold made another attempt to move higher but ultimately declined profoundly in the following days.
It appears that on one hand, everything that could have gone well for gold on the fundamental front, has already gone well, and it already rallied, and on the other hand, we have many signals pointing to the situation being excessive. This means that as some of the bullish factors ease (perhaps temporarily) and investors get scared about economy's ability to really recover, gold is likely to correct significantly, before continuing its upward march.
Speaking of indications pointing to the situation being excessive, let's take a look at the USD Index.
Remember when in early 2018 we wrote that the USD Index was bottoming due to a very powerful combination of support levels? Practically nobody wanted to read that as everyone "knew" that the USD Index is going to fall below 80. We were notified that people were hating on us in some blog comments for disclosing our opinion - that the USD Index was bottoming, and gold was topping. People were very unhappy with us writing that day after day, even though the USD Index refused to soar, and gold was not declining.
Well, it's the same right now.
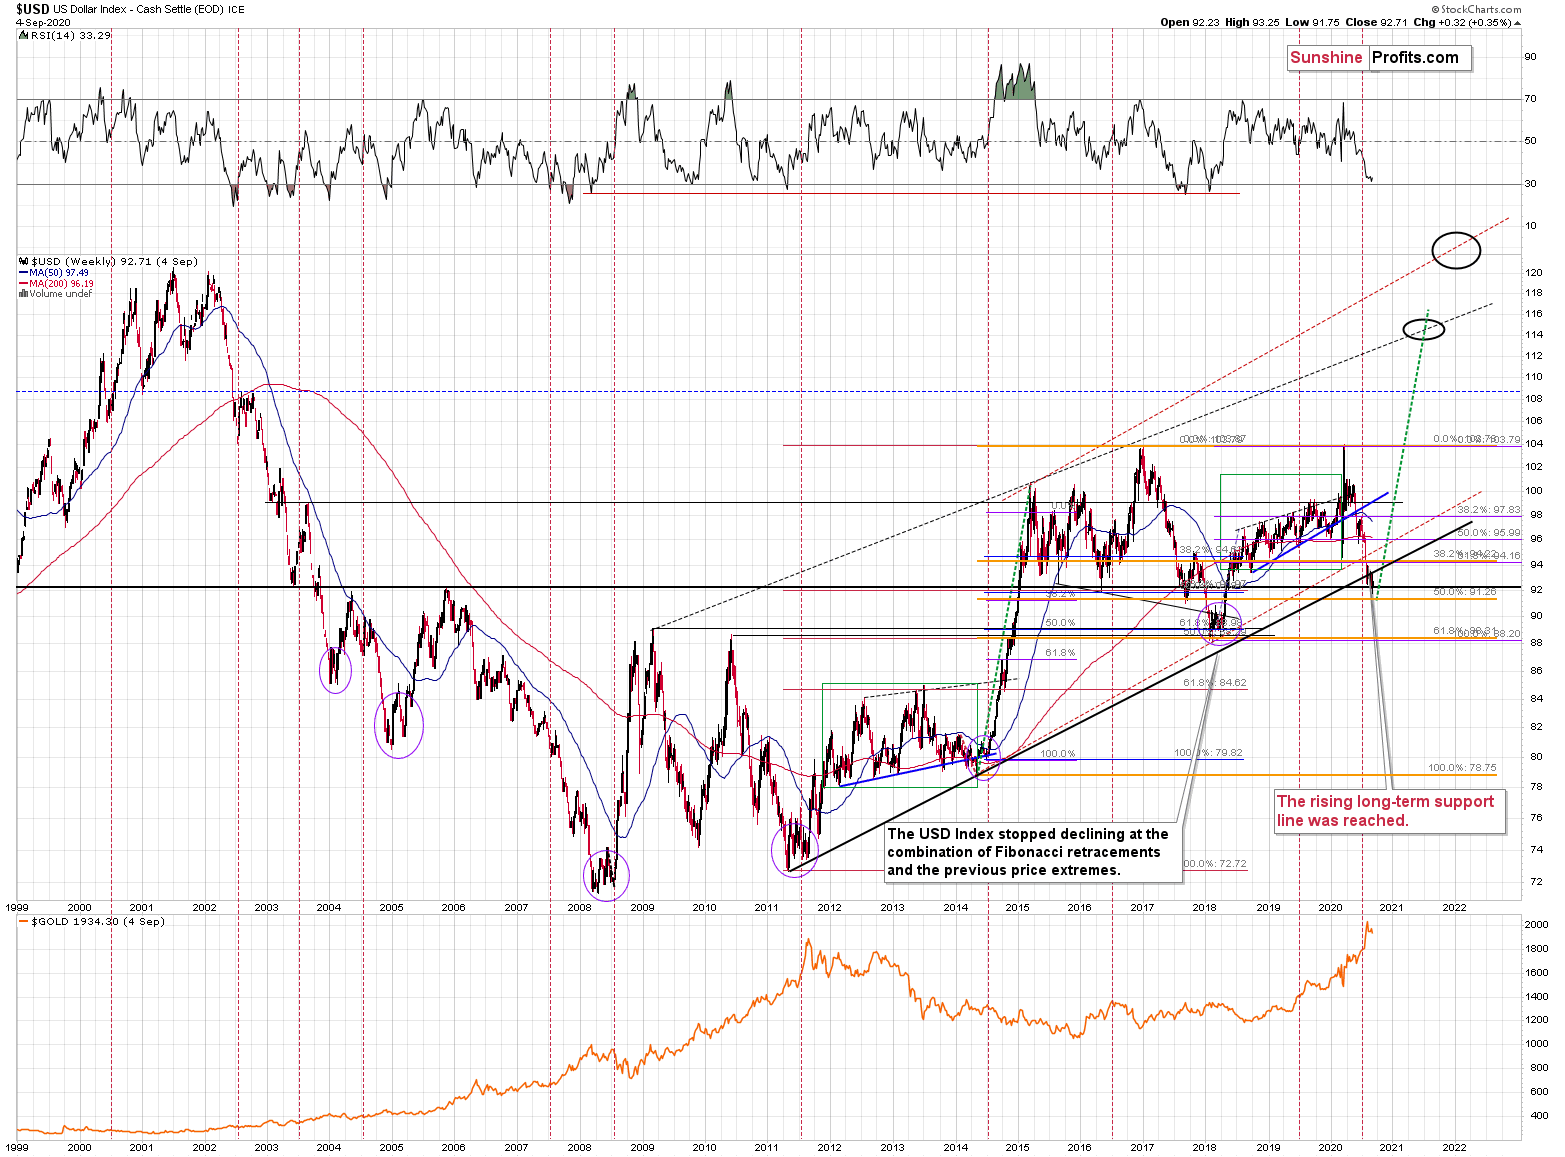
The USD Index is at a powerful combination of support levels. One of them is the rising, long-term, black support line that's based on the 2011 and 2014 bottoms.
The other major, long-term factor is the proximity to the 92 level - that's when gold topped in 2004, 2005, and where it - approximately - bottomed in 2015, and 2016.
The USDX just moved to these profound support levels, and it's very oversold on a short-term basis. It all happened in the middle of the year, which is when the USDX formed major bottoms on many occasions. This makes a short-term rally here very likely.
While it might not be visible at the first sight (you can click on the chart to enlarge it), the USD Index moved briefly below the long-term, black support line and then it invalidated this breakdown before the end of the week. This is a very bullish indication for the next few weeks.
Based on the most recent price moves, the USDX is once again below the above-mentioned strong rising support line, but we doubt that this breakdown would hold. We expect to see an invalidation thereof that is followed by a rally.
Before moving to the short-term chart, please note that the major bottoms in the USD Index that formed in the middle of the previous years often took form of broad bottoms. Consequently, the current back and forth trading is not that surprising. This includes the 2008, 2011, and 2018 bottoms.
In Thursday's analysis, we wrote the following:
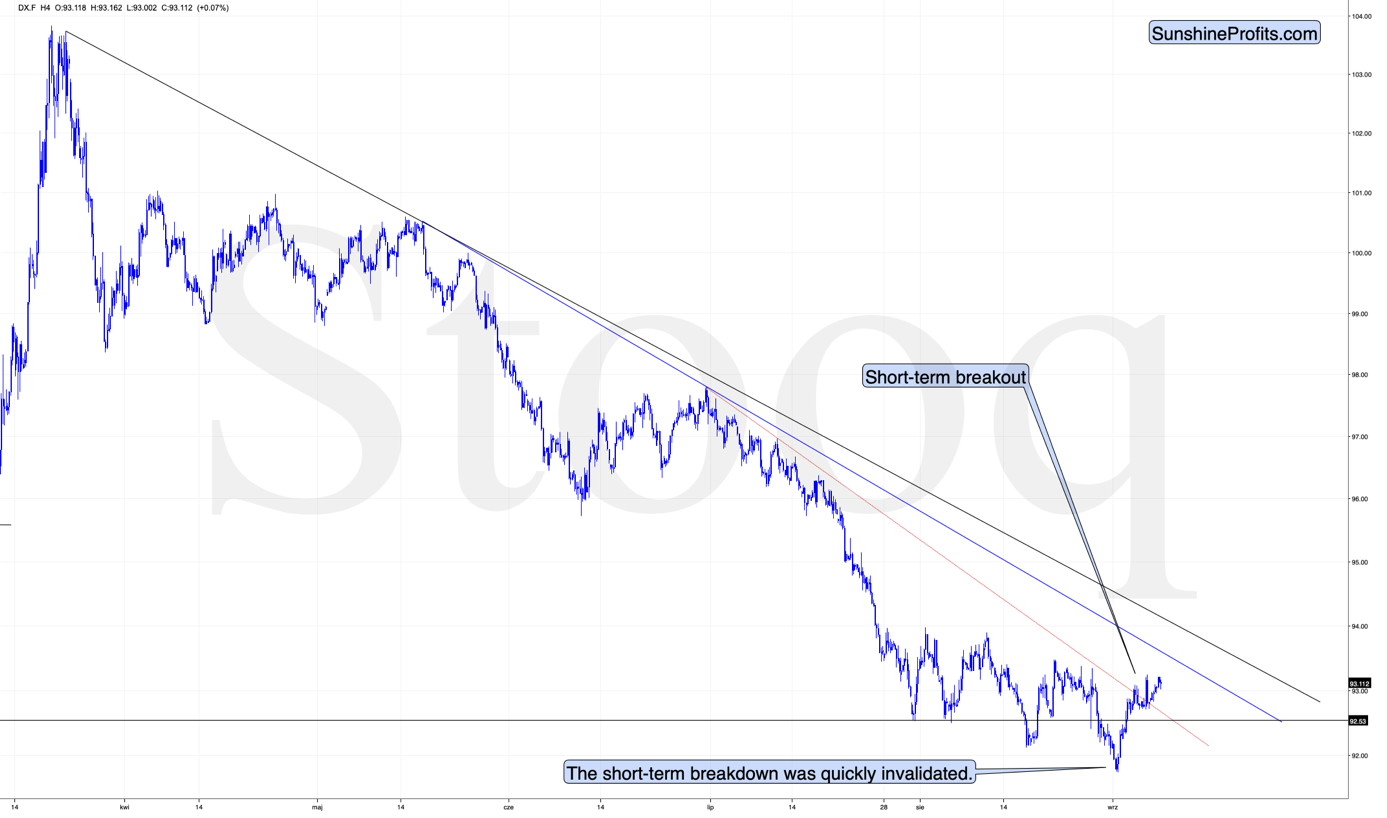
The USDX just broke above its declining medium-term resistance line. This is a big deal, because it already tried to do it in late August and it failed, which resulted in a small breakdown to new lows. This is very bullish not only because of the breakout being a bullish development per se, but because it happened shortly after Fed announced a more dovish approach, which theoretically should have made the USD Index decline. This resilience combined with the technical picture on both: short- and long-term USDX charts is very bullish. And the implications are bearish for the precious metals market.
Unlike what happened during the late-August attempt, this breakout was not invalidated. Instead, the USD Index pulled back a bit, and then moved back up again after reaching the previously broken line. This means that the breakout was just verified. This makes the short-term outlook even more bullish. And it has bearish implications for the precious metals sector.
Back in March, the short-term breakout in the USD Index was the thing that triggered the powerful rally in it, as well as a powerful plunge in the precious metals market. It's generally a good gold trading tip to monitor the USD Index's performance.
Consequently, based on this analogy, the implications for the near term are bearish for the PMs. Especially, when we consider the fact that Gold Miners Bullish Percent Index showed the highest possible overbought reading recently.
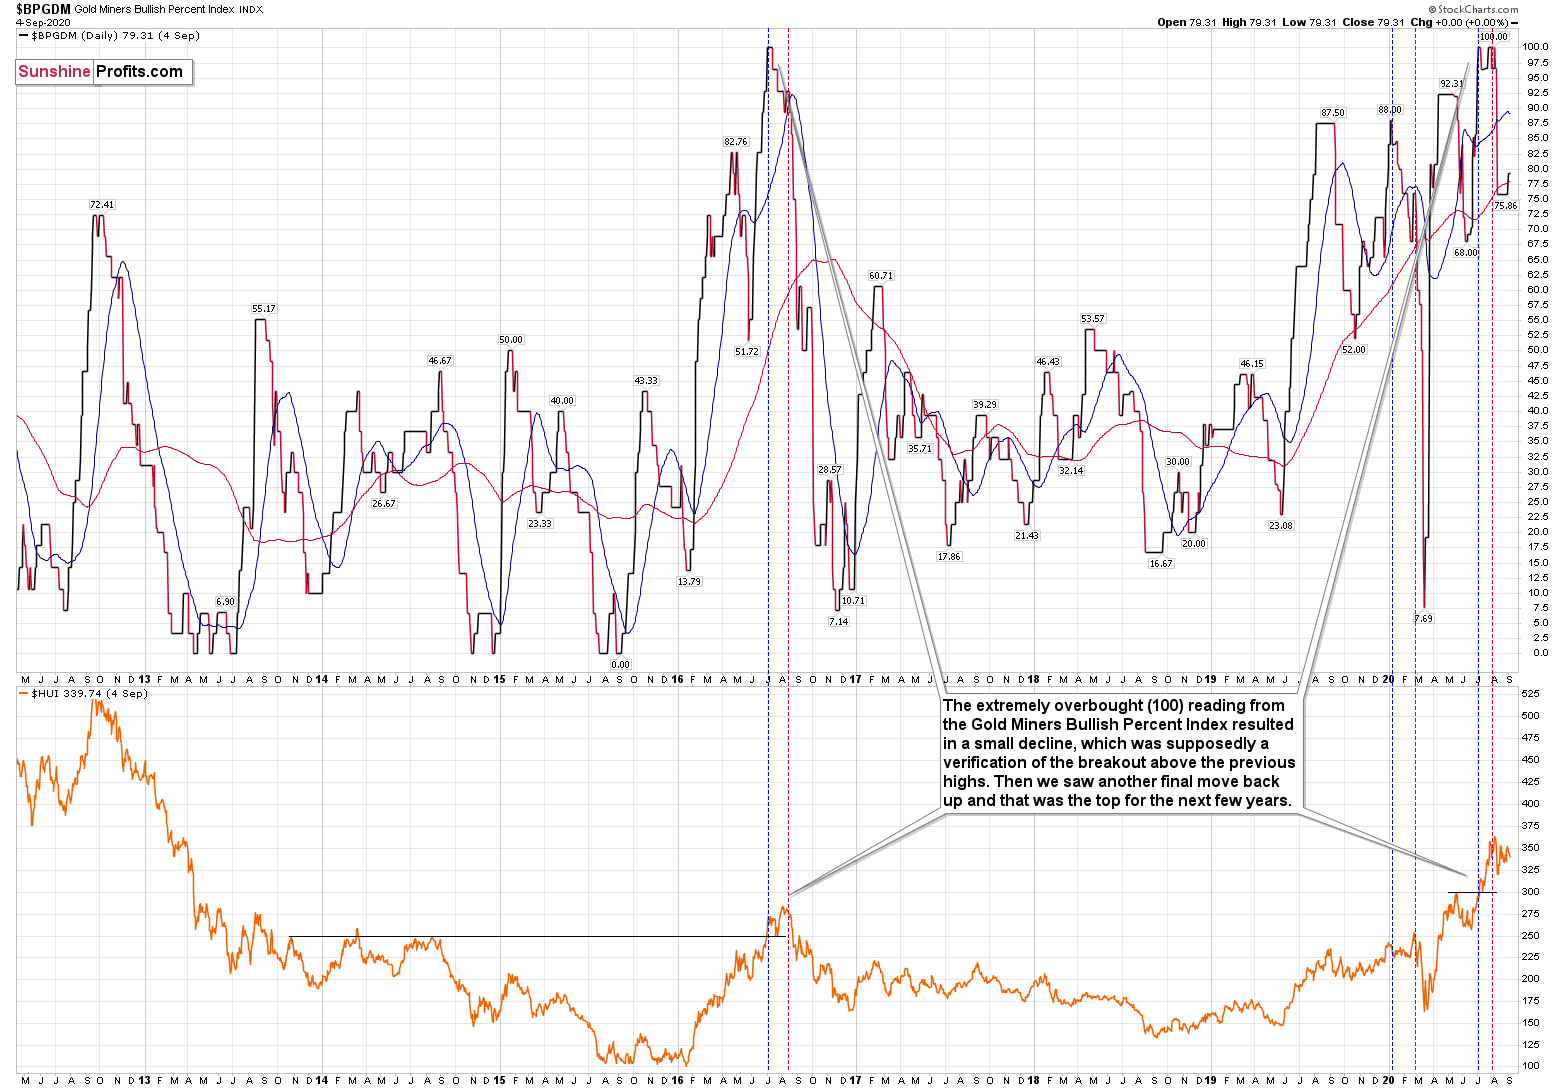
The excessive bullishness was present at the 2016 top as well and it didn't cause the situation to be any less bearish in reality. All markets periodically get ahead of themselves regardless of how bullish the long-term outlook really is. Then, they correct. If the upswing was significant, the correction is also quite often significant.
Please note that back in 2016, there was an additional quick upswing before the slide and this additional upswing has caused the Gold Miners Bullish Percent Index to move up once again for a few days. It then declined once again. We saw something similar also this time. In this case, this move up took the index once again to the 100 level, while in 2016 this wasn't the case. But still, the similarity remains present.
Back in 2016, when we saw this phenomenon, it was already after the top, and right before the big decline. Given the situation in the USD Index, it seems that we're seeing the same thing also this time.
Please note that back in 2016, after the top, the buying opportunity didn't present itself until the Gold Miners Bullish Percent Index was below 10. It's currently above 70, so it seems that miners have a long way to go before they bottom.
Two weeks ago week, we commented on the above chart in the following way:
Now, since the general stock market moved above the previous highs and continues to rally, we might or might not see a sizable decline early this week. Back in March, the slide in miners corresponded to the decline in the general stock market, and this could be repeated, or we could see some sideways trading after the slide resumes, once stocks finally decline.
That's exactly what happened. The general stock market continued to move higher, and mining stocks have been trading sideways instead of declining - or rallying. Before miners' pause (and S&P's breakout) miners were repeating their late-February and early-March performance. The implications of the self-similar pattern were bearish, and they continue to be bearish, only the timing changed.
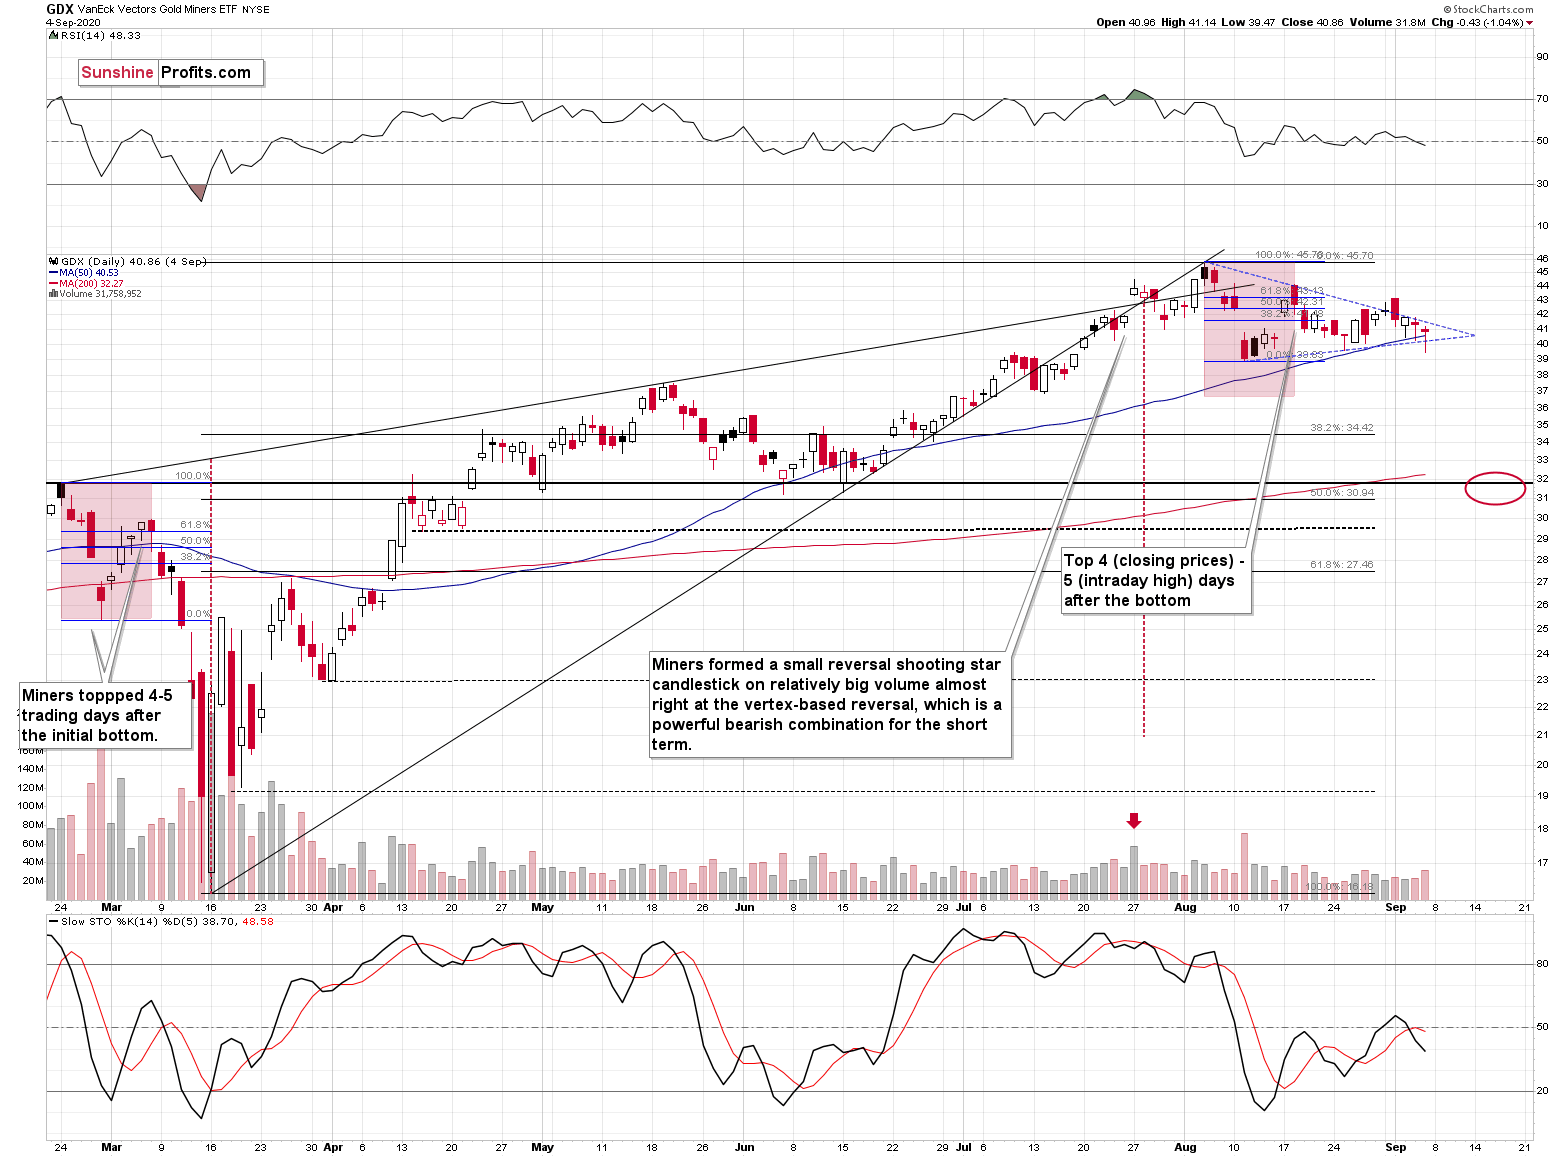
The GDX ETF didn't manage to break below the lower border of the triangle pattern yet, but given the situation in the USD Index and what we're about to show in you case of gold, it's likely that it will move lower shortly.
Based on the triangle (marked with blue lines), we get a vertex at the end of this week or on the upcoming Monday. This means that this this is when we might see some kind of reversal. It could be the case that it will be the next local bottom.
Also, let's not forget that the GDX ETF has recently invalidated the breakout above the 61.8% Fibonacci retracement based on the 2011 - 2016 decline.
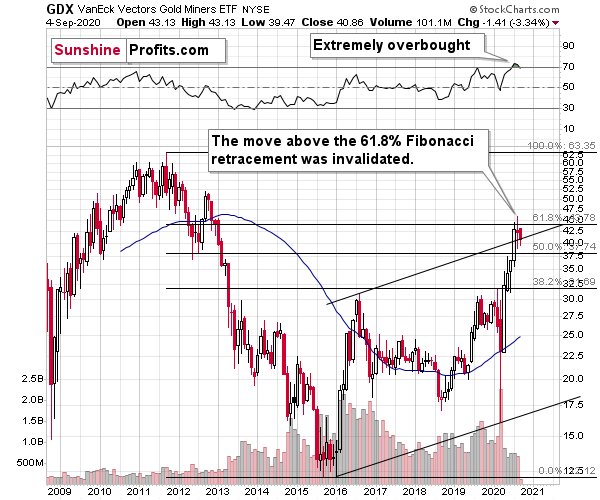
When GDX approached its 38.2% Fibonacci retracement, it declined sharply - it was right after the 2016 top. Are we seeing the 2020 top right now? This is quite possible - PMs are likely to decline after the sharp upswing, and since there are only several months left before the year ends, it might be the case that they move north of the recent highs only in 2021.
Either way, miners' inability to move above the 61.8% Fibonacci retracement level and their invalidation of the tiny breakout is a bearish sign.
Let's turn to metals themselves.
As far as gold is concerned, we previously wrote the following:
After topping at its triangle-vertex-based reversal, gold declined and is now trading at its declining resistance line, which turned into support. This could generate a rebound, especially that at the same time gold finally broke below the rising medium-term support line. This breakdown is a big deal, as all previous attempts were invalidated.
Since this support is so strong, we expect a rebound, quite possibly back to it. Such a verification (if gold doesn't invalidate the breakdown that is) would be very bearish for the short term.
Gold paused after moving below the above-mentioned support line, and the breakdown was verified. This is very bearish for the short term.
Gold moved back and forth at the most recent triangle-vertex-based reversal, which is a bearish sign. Why would this be the case? Because gold had declined previously, which means that it "should have" rallied at the most recent turning point. It didn't, which shows short-term weakness.
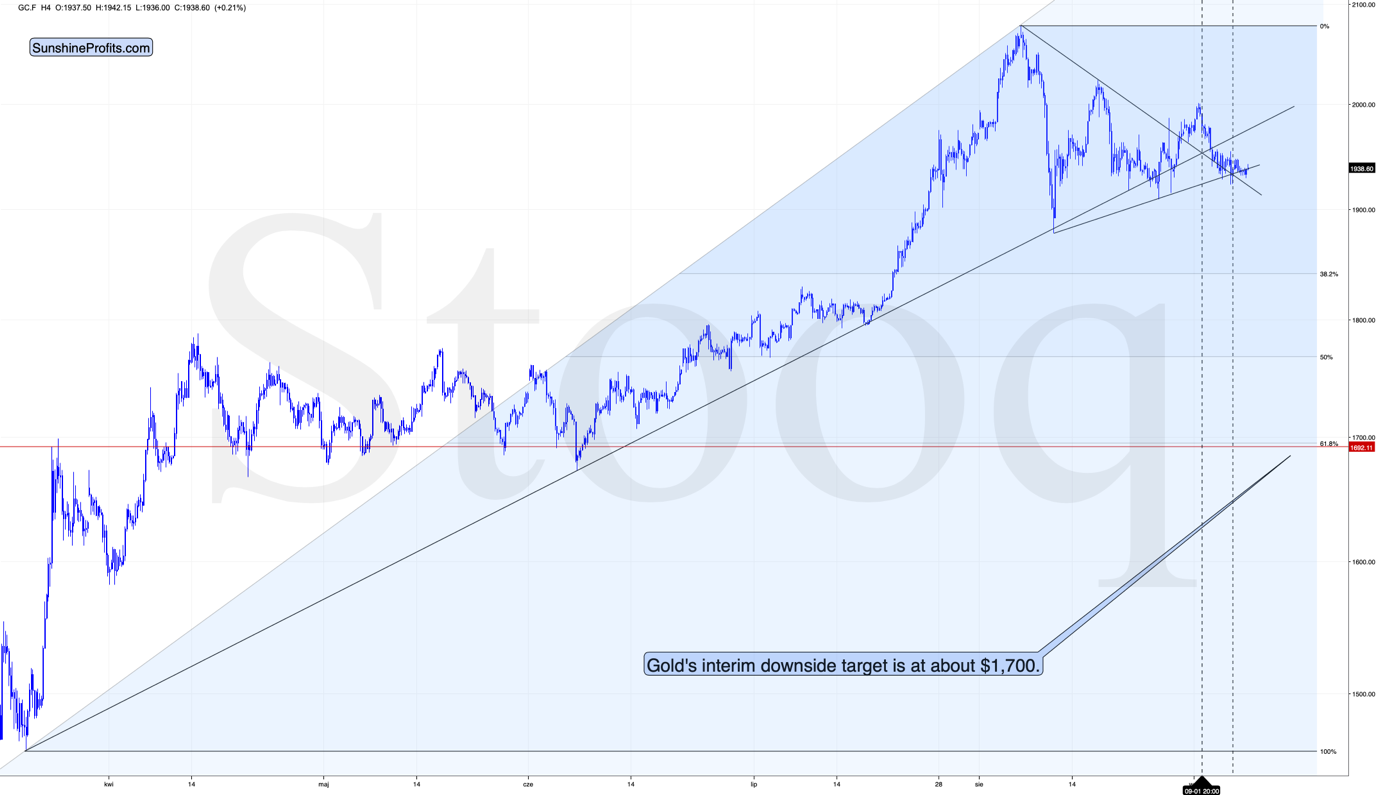
The next support is at $1,700, which is where - approximately - gold topped and bottomed multiple times earlier this year. That's also the 61.8% Fibonacci retracement based on this year's upswing.
The $1,700 level is additionally confirmed by the 38.2% Fibonacci retracement based on the entire 2015 - 2020 rally.
There's also possibility that gold would decline to the $1,500 - $1,600 area or so (50% Fibonacci retracement and the price level to which gold declined initially in 2011), but based on the size of the recent upswing, we no longer think that this scenario is the most likely one.
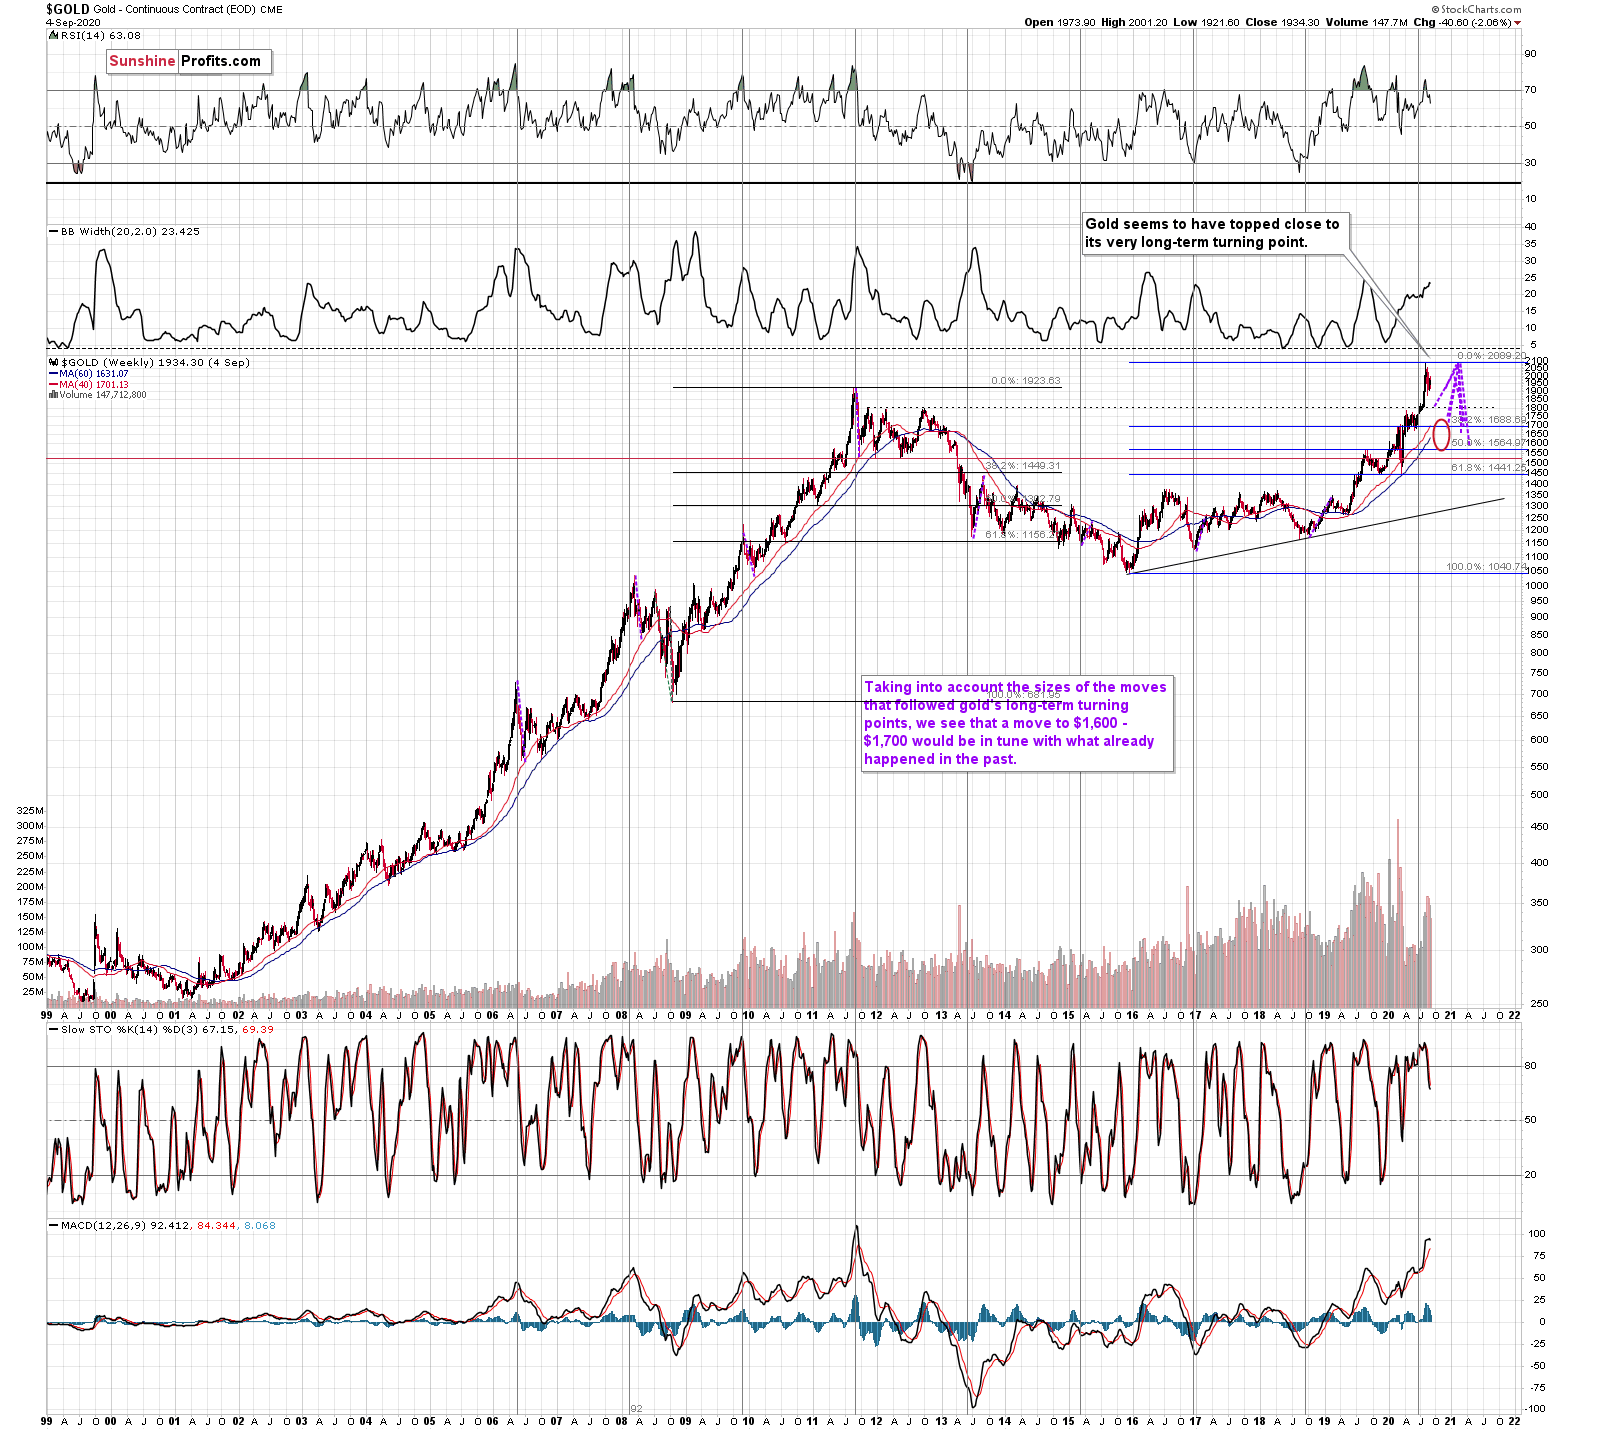
Gold's very long-term turning point is here and since the most recent move has definitely been to the upside, its implications are bearish.
We used the purple lines to mark the previous price moves that followed gold's long-term turning points, and we copied them to the current situation. We copied both the rallies and declines, which is why it seems that some moves would suggest that gold moves back in time - the point is to show how important the turning point is in general.
The big change here is that due to gold's big rally, we moved our downside target for it higher. Based on the information that we have available right now, it seems likely that gold will bottom close to the $1,700 level. That's very much in tune with how much gold moved after the previous long-term turning points.
Also, while we're discussing the long-term charts, please note the most important detail that you can see on the gold, silver, and mining stock charts, is hidden in plain sight. Please note how much silver and miners rallied.
The analogy to the price moves after the previous turning points didn't change, but since the starting point is much higher, the downside target is also higher.
Speaking of upside targets, two weeks ago, we wrote the following:
Based on gold's Fibonacci extensions and the previous major highs and lows (the 2018 high and late-2019 low along with the 2020 low), we get a nearby upside target of $2085. At the moment of writing these words, gold is trading at $2044. Given this week's volatility, it could even be a matter of hours before gold reaches the above-mentioned target and reverses. Taking closing prices into account, gold is up by $35, so if it reverses significantly, we would be likely to see a powerful weekly reversal candlestick and one that causes gold to decline in the following weeks.
That's more or less what happened. Gold topped at $2,089.20. It then declined quite visibly and closed last week at about $1,950.
Before moving to silver, we would like to discuss something very important regarding the most recent rally in gold and the subsequent consolidation.
Do you get the feeling that you have already seen gold perform this way before? Because you did.
The history rhymes, but this time, the similarity is quite shocking.
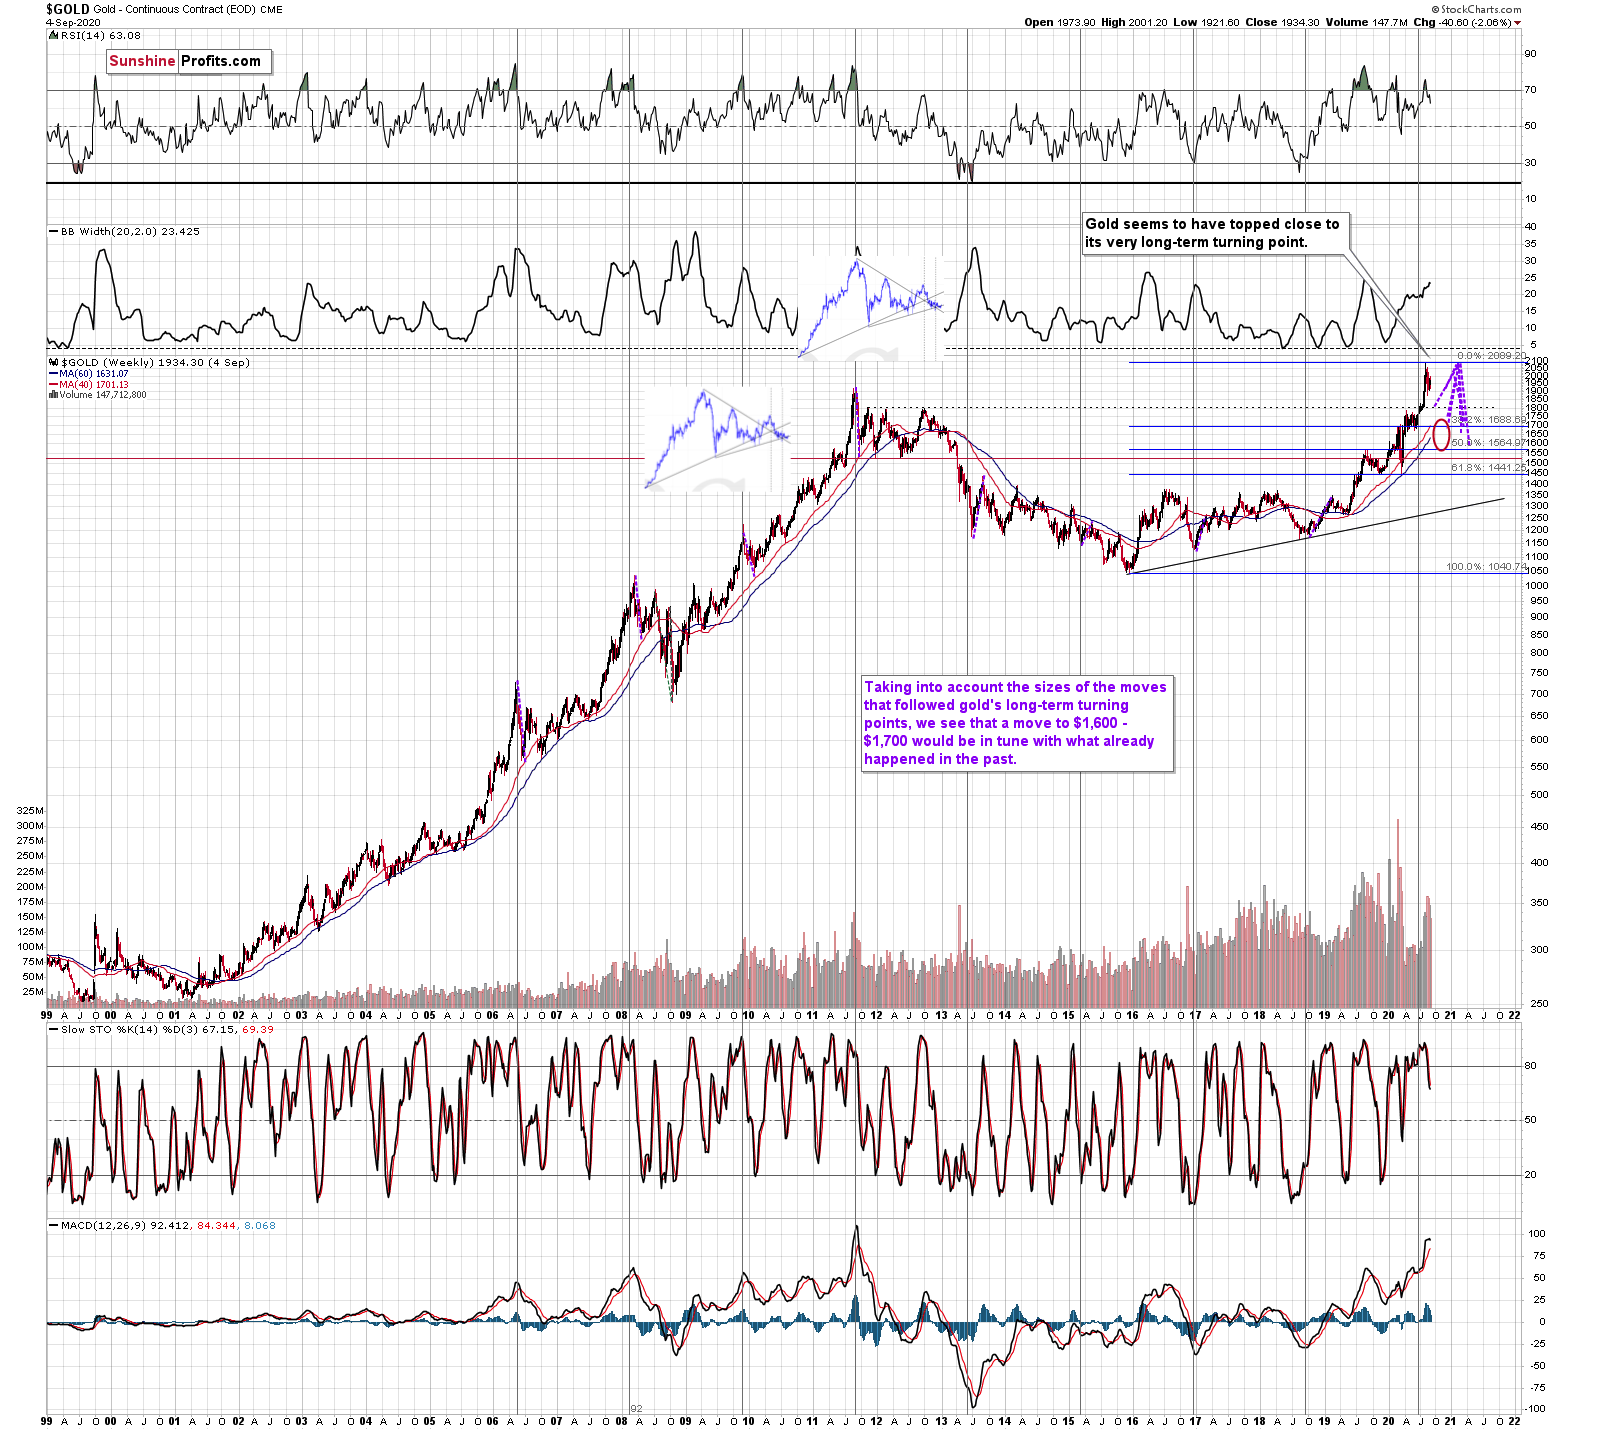
We copied the short-term chart and pasted it on the long-term chart above and next to the 2011 top. We pasted it twice, so that you can easily compare gold's performance in both cases in terms of both: price and time.
They are very similar to say the least. Yes, these patterns happened over different periods, but this doesn't matter. Markets are self-similar, which is why you can see similar short-term trends and long-term trends (with regard to their shapes). Consequently, comparing patterns of similar shape makes sense even if they form over different timeframes.
After a sharp rally, gold declined quickly. Then we saw a rebound, and a move back to the previous low. Then, after a bit longer time, gold moved close to the most recent high and started its final decline. This decline was less volatile than the initial slide. That's what happened when gold topped in 2011 (and in the following years), and that's what happened also this year. Ok, after the initial decline from the 2011 top, we saw two initial reactive rallies and in 2020 there was just one, but it didn't change the similarity with regard to time.
The patterns of this level of similarity are rare, and when they do finally take place, they tend to be remarkably precise with regard to the follow-up action.
What is likely to follow based on this pattern, is that we're likely to see the end of the slower decline, which will be followed by a big and sharp decline - similarly to what we saw in 2013.
How low could gold slide based on this similarity? Back in 2013, gold declined approximately to the 61.8% Fibonacci retracement based on the preceding rally (the one that started in 2008), so that's the natural target also this time.
And we already wrote about this particular retracement - it's approximately at the $1,700 level. This has been our downside target for weeks, and it was just confirmed by this precise self-similar technique.
Another interesting point is that gold made an interim low close to the 50% retracement and the previous lows. Applying this to the current situation suggests that we could see a smaller rebound when gold moves to about $1,760 - $1,800.
This might be the moment to switch from short positions in the miners to short position in silver. It's too early to say for sure at this time, though.
Speaking of silver, please note that from the long-term point of view, silver is not that strong.
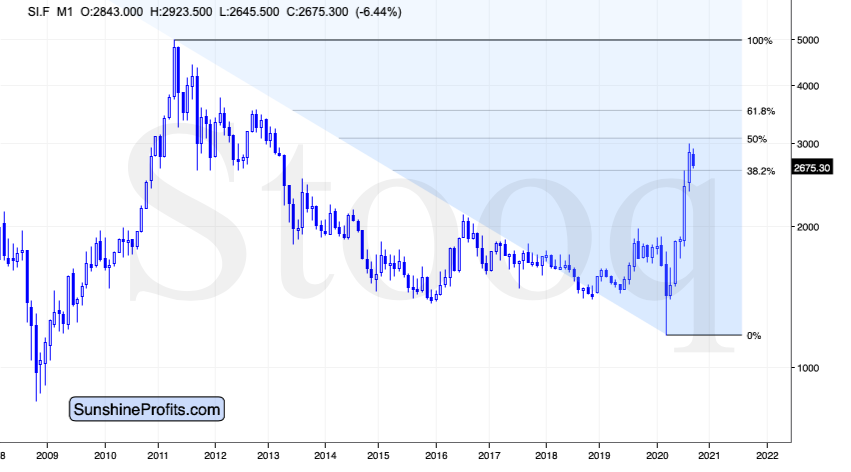
While gold moved to new highs, silver - despite its powerful short-term upswing - didn't manage to correct more than half of its 2011 - 2020 decline.
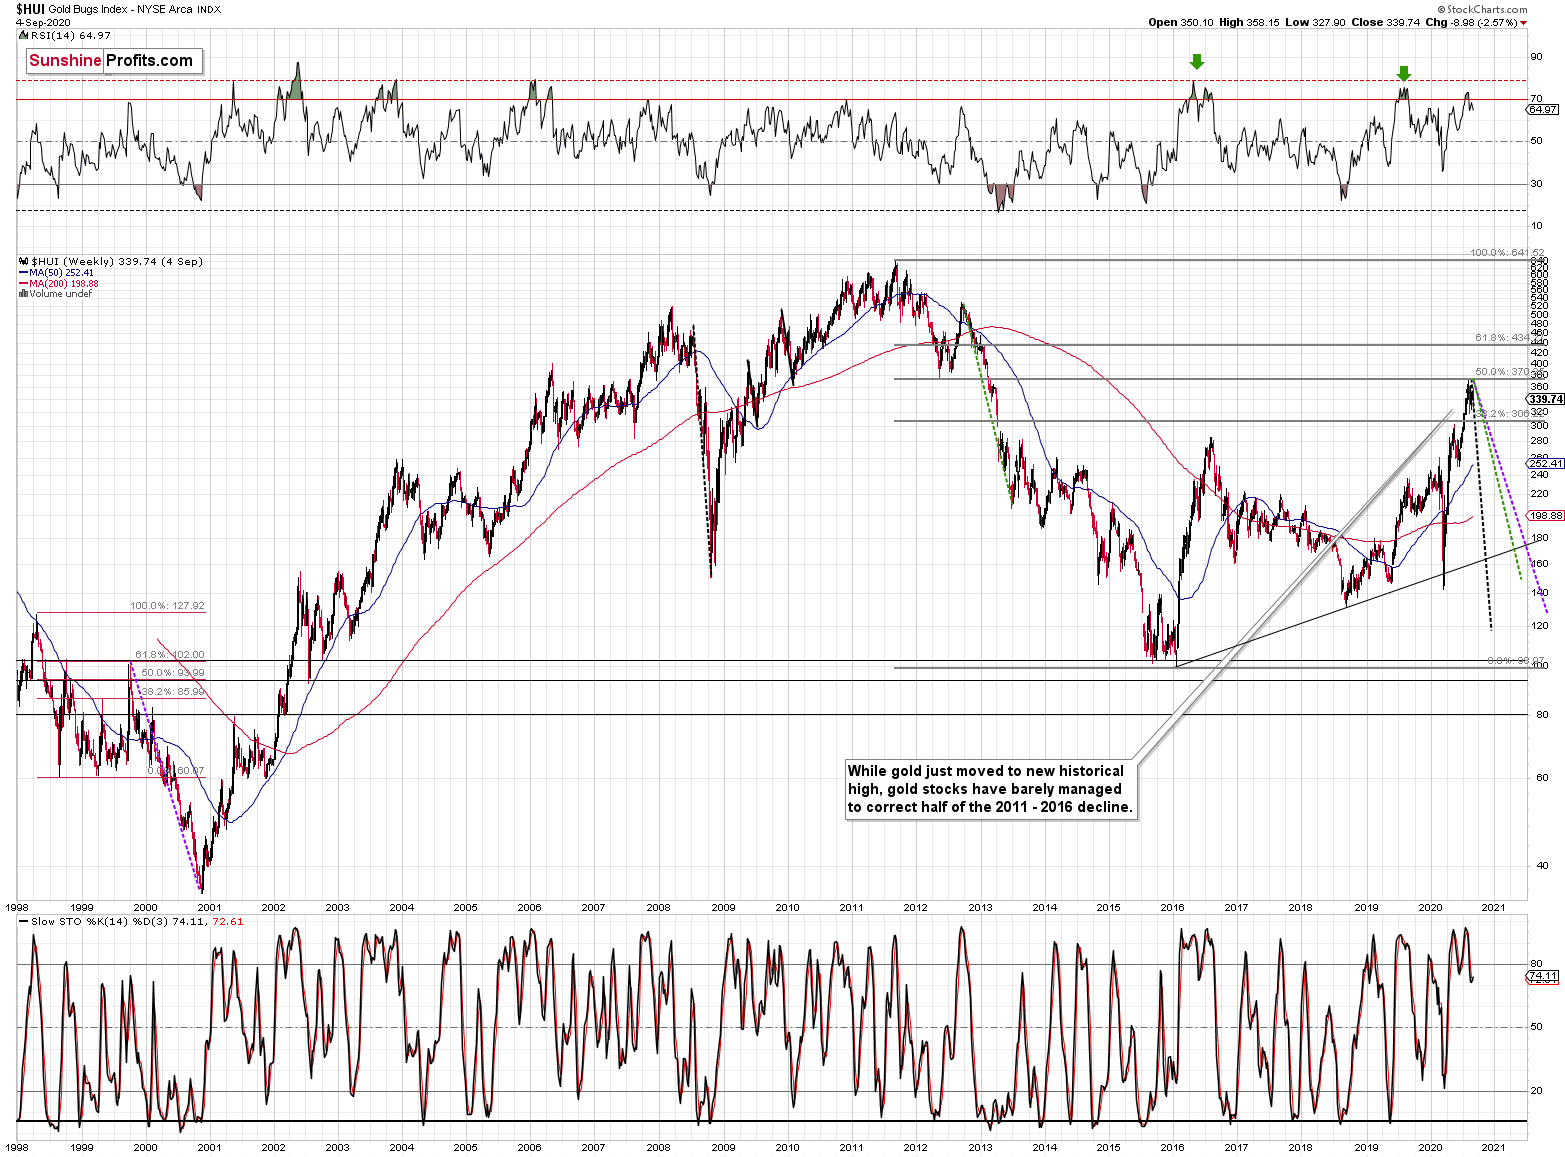
We see something similar in the HUI Index. The latter corrected half of its 2011 - 2016 decline and nothing more, while gold moved well above its 2011 high.
All in all, it's mostly gold that is making the major gains - not the entire precious metals sector.
Overview of the Upcoming Decline
As far as the current overview of the upcoming decline is concerned, I think that it has already begun, at least in case of the mining stocks. It's still relatively unclear if gold makes another attempt to move to new highs before plunging below $1,800, but it now appears more likely that it won't.
During the final part of the slide, we expect silver to decline more than miners. That would be in tune with how the markets initially reacted to the Covid-19 threat.
The impact of all the new rounds of money printing in the U.S. and Europe on the precious metals prices is very positive in the long run, but it doesn't make the short-term decline unlikely. In the very near term, markets can and do get ahead of themselves and then need to decline - sometimes very profoundly - before continuing their upward march.
Summary
Summing up, it seems that after reversing $4 above our upside target, gold has finally topped, and that it formed the second top from the double-top pattern in mid-August. The USD Index appears to be forming a broad bottom, just like it did in 2008, 2011, and 2018. It's worth keeping in mind that while the USDX just moved slightly below its recent lows, gold didn't move to its recent highs. This relative underperformance, along with the specific juncture at which the USD Index currently is, creates a very bearish environment for the precious metals market, especially for the mining stocks. The decline in the latter is likely to accelerate once the general stock market finally declines.
The self-similar pattern in gold makes the outlook even more bearish and it adds to the already bearish outlook for the next several weeks.
Naturally, everyone's trading is their responsibility, but in our opinion, if there ever was a time to either enter a short position in the miners or to increase its size if it wasn't already sizable, it's now. We made money on the March decline and on the March rebound, and it seems that another massive slide is about to start. When everyone is on one side of the boat, it's a good idea to be on the other side, and the Gold Miners Bullish Percent Index literally indicates that this is the case with mining stocks.
After the sell-off (that takes gold to about $1,700 or lower), we expect the precious metals to rally significantly. The final decline might take as little as 1-6 weeks, so it's important to stay alert to any changes.
Most importantly - stay healthy and safe. We made a lot of money on the March decline and the subsequent rebound (its initial part) price moves (and we'll likely make much more in the following weeks and months), but you have to be healthy to really enjoy the results.
As always, we'll keep you - our subscribers - informed.
To summarize:
Trading capital (supplementary part of the portfolio; our opinion): Full speculative short positions (300% of the full position) in mining stocks is justified from the risk to reward point of view with the following binding exit profit-take price levels:
Senior mining stocks (price levels for the GDX ETF): binding profit-take exit price: $32.02; stop-loss: none (the volatility is too big to justify a SL order in case of this particular trade); binding profit-take level for the DUST ETF: $28.73; stop-loss for the DUST ETF: none (the volatility is too big to justify a SL order in case of this particular trade)
Junior mining stocks (price levels for the GDXJ ETF): binding profit-take exit price: $42.72; stop-loss: none (the volatility is too big to justify a SL order in case of this particular trade); binding profit-take level for the JDST ETF: $21.22; stop-loss for the JDST ETF: none (the volatility is too big to justify a SL order in case of this particular trade)
For-your-information targets (our opinion; we continue to think that mining stocks are the preferred way of taking advantage of the upcoming price move, but if for whatever reason one wants / has to use silver or gold for this trade, we are providing the details anyway. In our view, silver has greater potential than gold does):
Silver futures downside profit-take exit price: unclear at this time - initially, it might be a good idea to exit, when gold moves to $1,703.
Gold futures downside profit-take exit price: $1,703
Long-term capital (core part of the portfolio; our opinion): No positions (in other words: cash
Insurance capital (core part of the portfolio; our opinion): Full position
Whether you already subscribed or not, we encourage you to find out how to make the most of our alerts and read our replies to the most common alert-and-gold-trading-related-questions.
Please note that the in the trading section we describe the situation for the day that the alert is posted. In other words, it we are writing about a speculative position, it means that it is up-to-date on the day it was posted. We are also featuring the initial target prices, so that you can decide whether keeping a position on a given day is something that is in tune with your approach (some moves are too small for medium-term traders and some might appear too big for day-traders).
Plus, you might want to read why our stop-loss orders are usually relatively far from the current price.
Please note that a full position doesn't mean using all of the capital for a given trade. You will find details on our thoughts on gold portfolio structuring in the Key Insights section on our website.
As a reminder - "initial target price" means exactly that - an "initial" one, it's not a price level at which we suggest closing positions. If this becomes the case (like it did in the previous trade) we will refer to these levels as levels of exit orders (exactly as we've done previously). Stop-loss levels, however, are naturally not "initial", but something that, in our opinion, might be entered as an order.
Since it is impossible to synchronize target prices and stop-loss levels for all the ETFs and ETNs with the main markets that we provide these levels for (gold, silver and mining stocks - the GDX ETF), the stop-loss levels and target prices for other ETNs and ETF (among other: UGLD, DGLD, USLV, DSLV, NUGT, DUST, JNUG, JDST) are provided as supplementary, and not as "final". This means that if a stop-loss or a target level is reached for any of the "additional instruments" (DGLD for instance), but not for the "main instrument" (gold in this case), we will view positions in both gold and DGLD as still open and the stop-loss for DGLD would have to be moved lower. On the other hand, if gold moves to a stop-loss level but DGLD doesn't, then we will view both positions (in gold and DGLD) as closed. In other words, since it's not possible to be 100% certain that each related instrument moves to a given level when the underlying instrument does, we can't provide levels that would be binding. The levels that we do provide are our best estimate of the levels that will correspond to the levels in the underlying assets, but it will be the underlying assets that one will need to focus on regarding the signs pointing to closing a given position or keeping it open. We might adjust the levels in the "additional instruments" without adjusting the levels in the "main instruments", which will simply mean that we have improved our estimation of these levels, not that we changed our outlook on the markets. We are already working on a tool that would update these levels on a daily basis for the most popular ETFs, ETNs and individual mining stocks.
Our preferred ways to invest in and to trade gold along with the reasoning can be found in the how to buy gold section. Additionally, our preferred ETFs and ETNs can be found in our Gold & Silver ETF Ranking.
As a reminder, Gold & Silver Trading Alerts are posted before or on each trading day (we usually post them before the opening bell, but we don't promise doing that each day). If there's anything urgent, we will send you an additional small alert before posting the main one.
Thank you.
Sincerely,
Przemyslaw Radomski, CFA
Editor-in-chief, Gold & Silver Fund Manager

