

Briefly: in our opinion, full (200% of the regular size of the position) speculative short positions in gold, silver and mining stocks are justified from the risk/reward perspective at the moment of publishing this alert.
In yesterday’s alert, we elaborated on how boring the situation in the precious metals market has been and what implications it has going forward, especially in tune with the True Seasonal tendencies. Yesterday’s performance in the precious metals market serves as a perfect confirmation of what we wrote yesterday, and the details of the session allows us to make even more specific prediction. There was a specific sign in the mining stocks that’s practically invisible to those, whose analysis of the sector doesn’t extend beyond looking at the GDX ETF.
The prediction is that we are likely to see a move lower in the PMs before the end of the week and the reason is that in addition to confirming what we wrote today, we saw a new short-term bearish sign. Let’s take a look at the details.
USD’s Tiny Decline
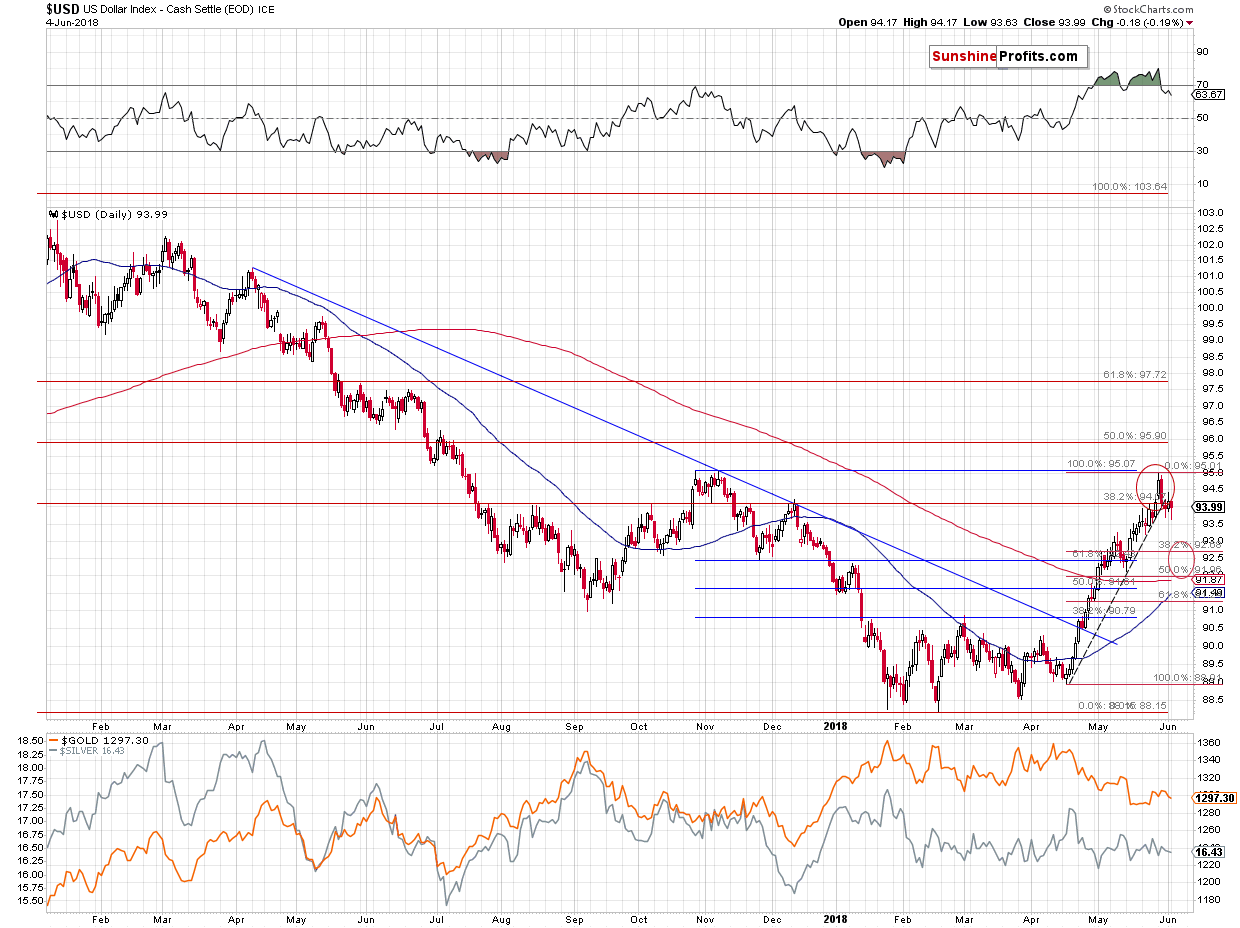
The USD Index declined yesterday and reversed before the end of the session, finally closing the day only a bit lower. The reaction of the metals and – in particular – mining stocks is of greatest importance here as it shows that the bearish outlook remains in place. Gold, silver, and mining stocks should have moved higher in the light of the above action in the USD and end the session with a higher closing price. Yet, there was no important decline and the HUI Index – proxy for gold stocks – even moved visibly lower without moving back up.
This means that the implications are even more bearish than what we described previously, when we wrote the following:
The USD Index moved a bit lower yesterday, and the precious metals sector reacted by… moving lower as well. That’s exactly what we wrote in the last few alerts. Even though gold moves in the opposite direction to the USD Index on a very short-term basis, gold’s declines are relatively bigger, and gold’s rallies are relatively smaller. Overall, gold is not really reacting to USD’s decline, which is a consequence of the reason behind the previous simultaneous rally in gold and USD. The reason was increased risk in the Eurozone and as the geopolitical event’s impact fades away, so does gold’s gleam.
Thursday’s downswing was not big, but it was enough to result in USDX’s breakdown below the short-term, rising support line. The implications were not particularly bearish until the USD Index closed below the above-mentioned line one more time, almost confirming the breakdown. That’s what we saw on Friday. That’s a bearish development and it should theoretically be bullish for precious metals, but it wasn’t. This means that the way in which the gold-USD link currently behaves is still in place. Therefore, even if the USD declines shortly (and we don’t expect the USDX to go below the 92.5 - 92 area), then PMs may not react in a profound manner. The move higher in gold and silver may be small or even nonexistent.
Gold’s Short-term Breakout and Its Invalidation
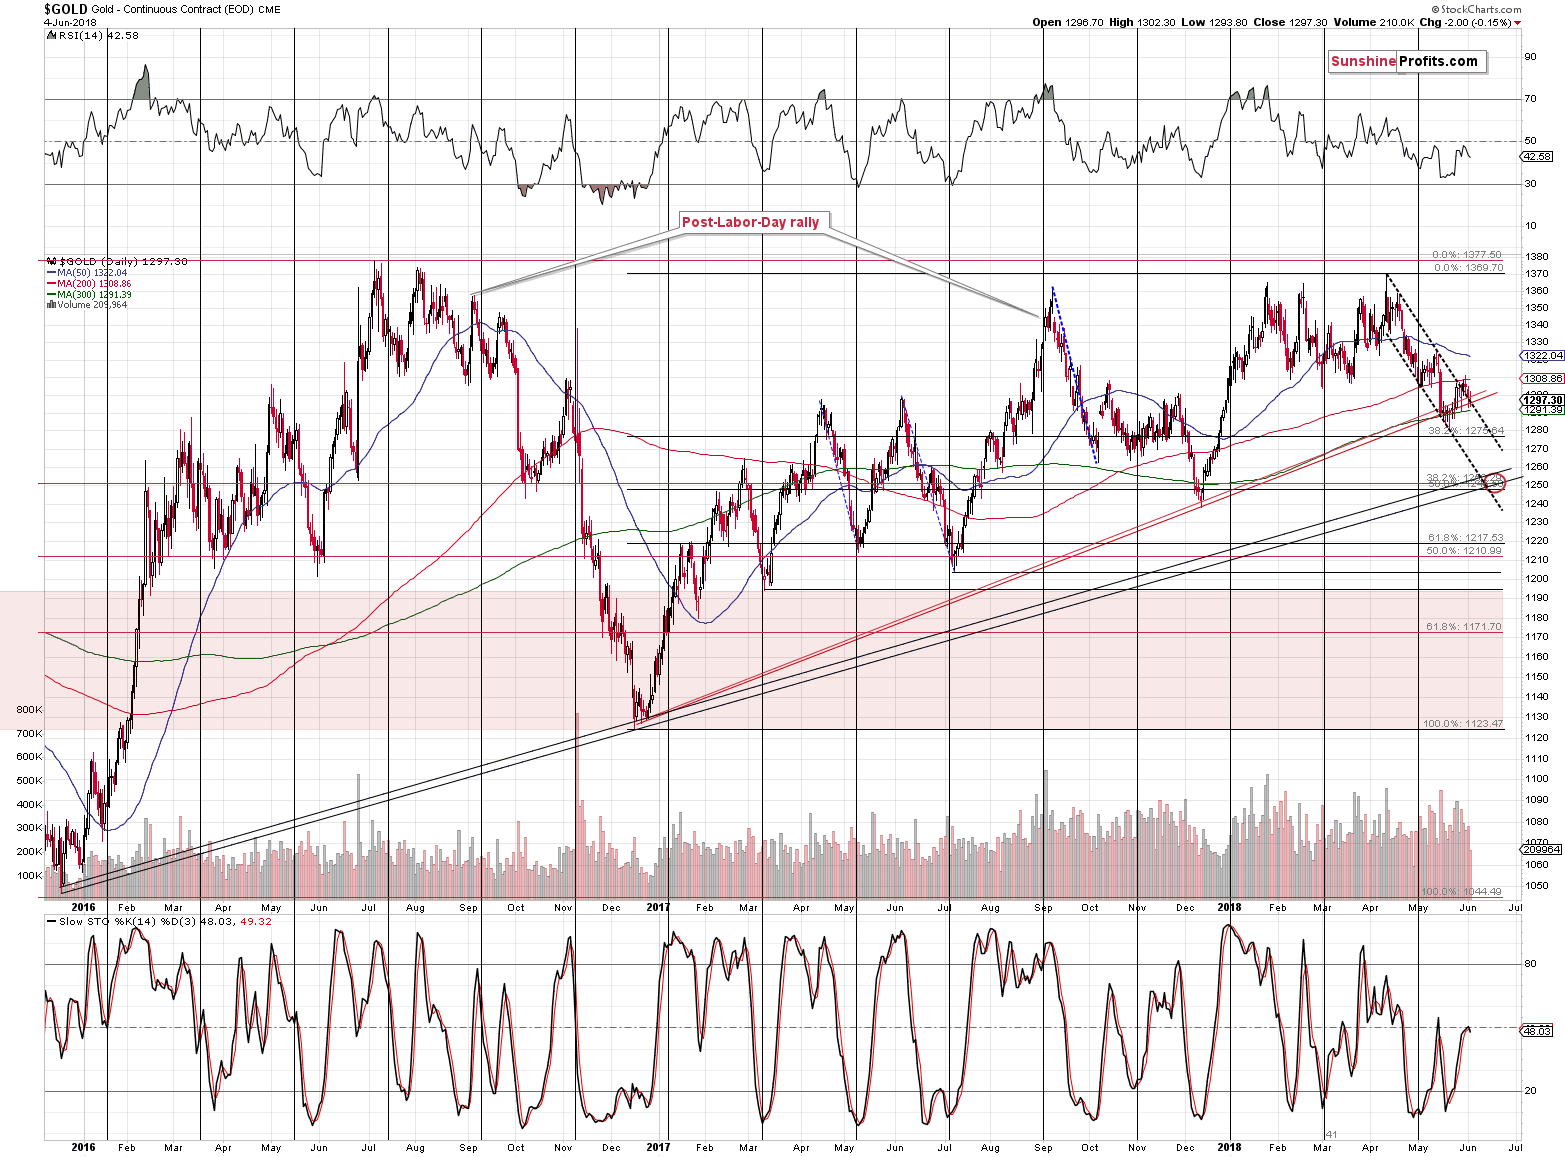
Gold recently moved above the upper border of the declining trend channel, but before the breakout was confirmed, it was already invalidated. Well, it may not be clear based on the above chart, but it is when we consider the data from kitco.com.
On the Stockcharts’ chart it seems that gold ended the session right at the support/resistance line (currently at about $1,295), while it really closed the session about $4 lower, which is back within the trend channel. This means that the breakout was invalidated on Friday and another intraday attempt to move above the resistance line was invalidated yesterday. Implications for invalidations of breakouts are generally bearish and the current case is no exception.
The next downside target is at about $1,250 as that’s where we have combination of two important support lines – the lower border of the declining trend channel and the rising medium-term support line based on the December 2015 and December 2016 lows. That’s also the 50% Fibonacci retracement level based on the December 2016 – April 2018 rally and the 38.2% Fibonacci retracement level based on the December 2015 – April 2018 rally. Quadruple support makes the $1,250 (approximately) a very likely target for the next rebound.
Silver’s Apex-based Reversal
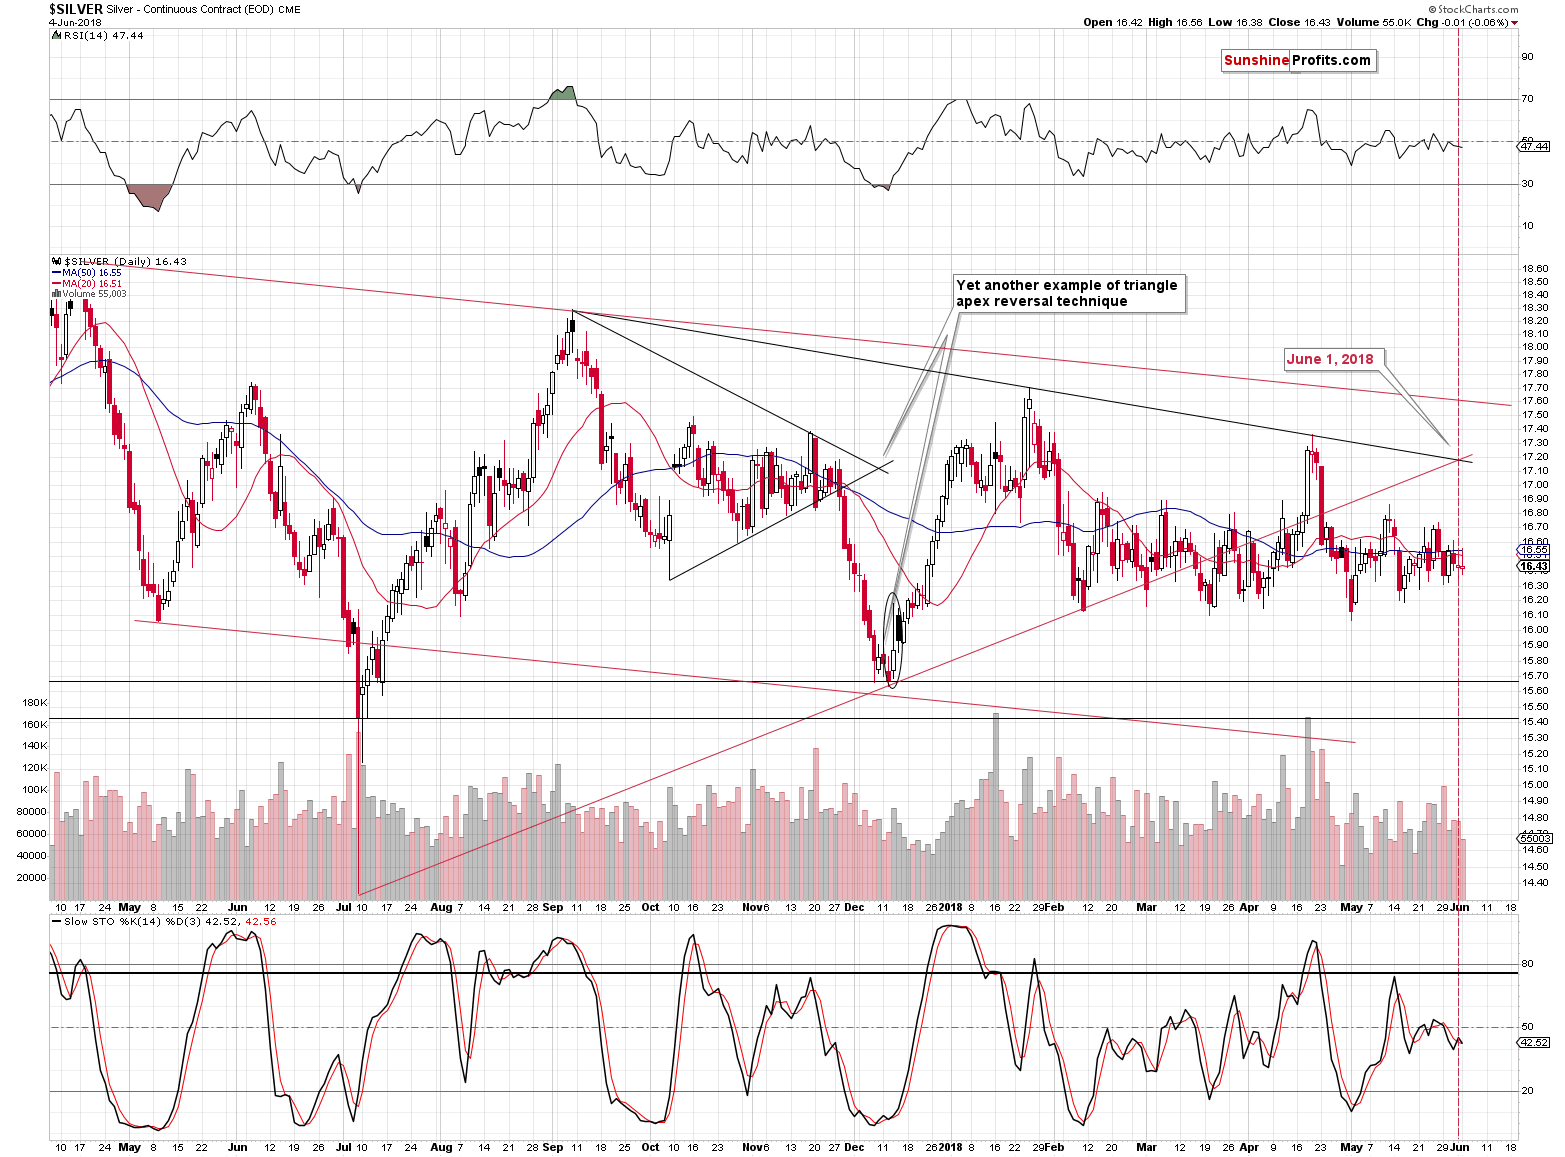
Silver triangle-apex-based turning point is here, and more precisely, we already saw it on Friday. So far there was no spectacular action, but it let’s keep in mind that the tops and bottoms indicated by the reversals don’t have to be particularly volatile. In fact, we may not even recognize them as extremes when they are visible, and it is only clear in hindsight that it was indeed the reversal. That was most likely the case this time, but we won’t know for certain until after a few more days.
For now, it seems that the bottom was indeed formed one day before the apex-based turning point and there are some new confirmations of this theory…
Mining Stocks’ New Signal
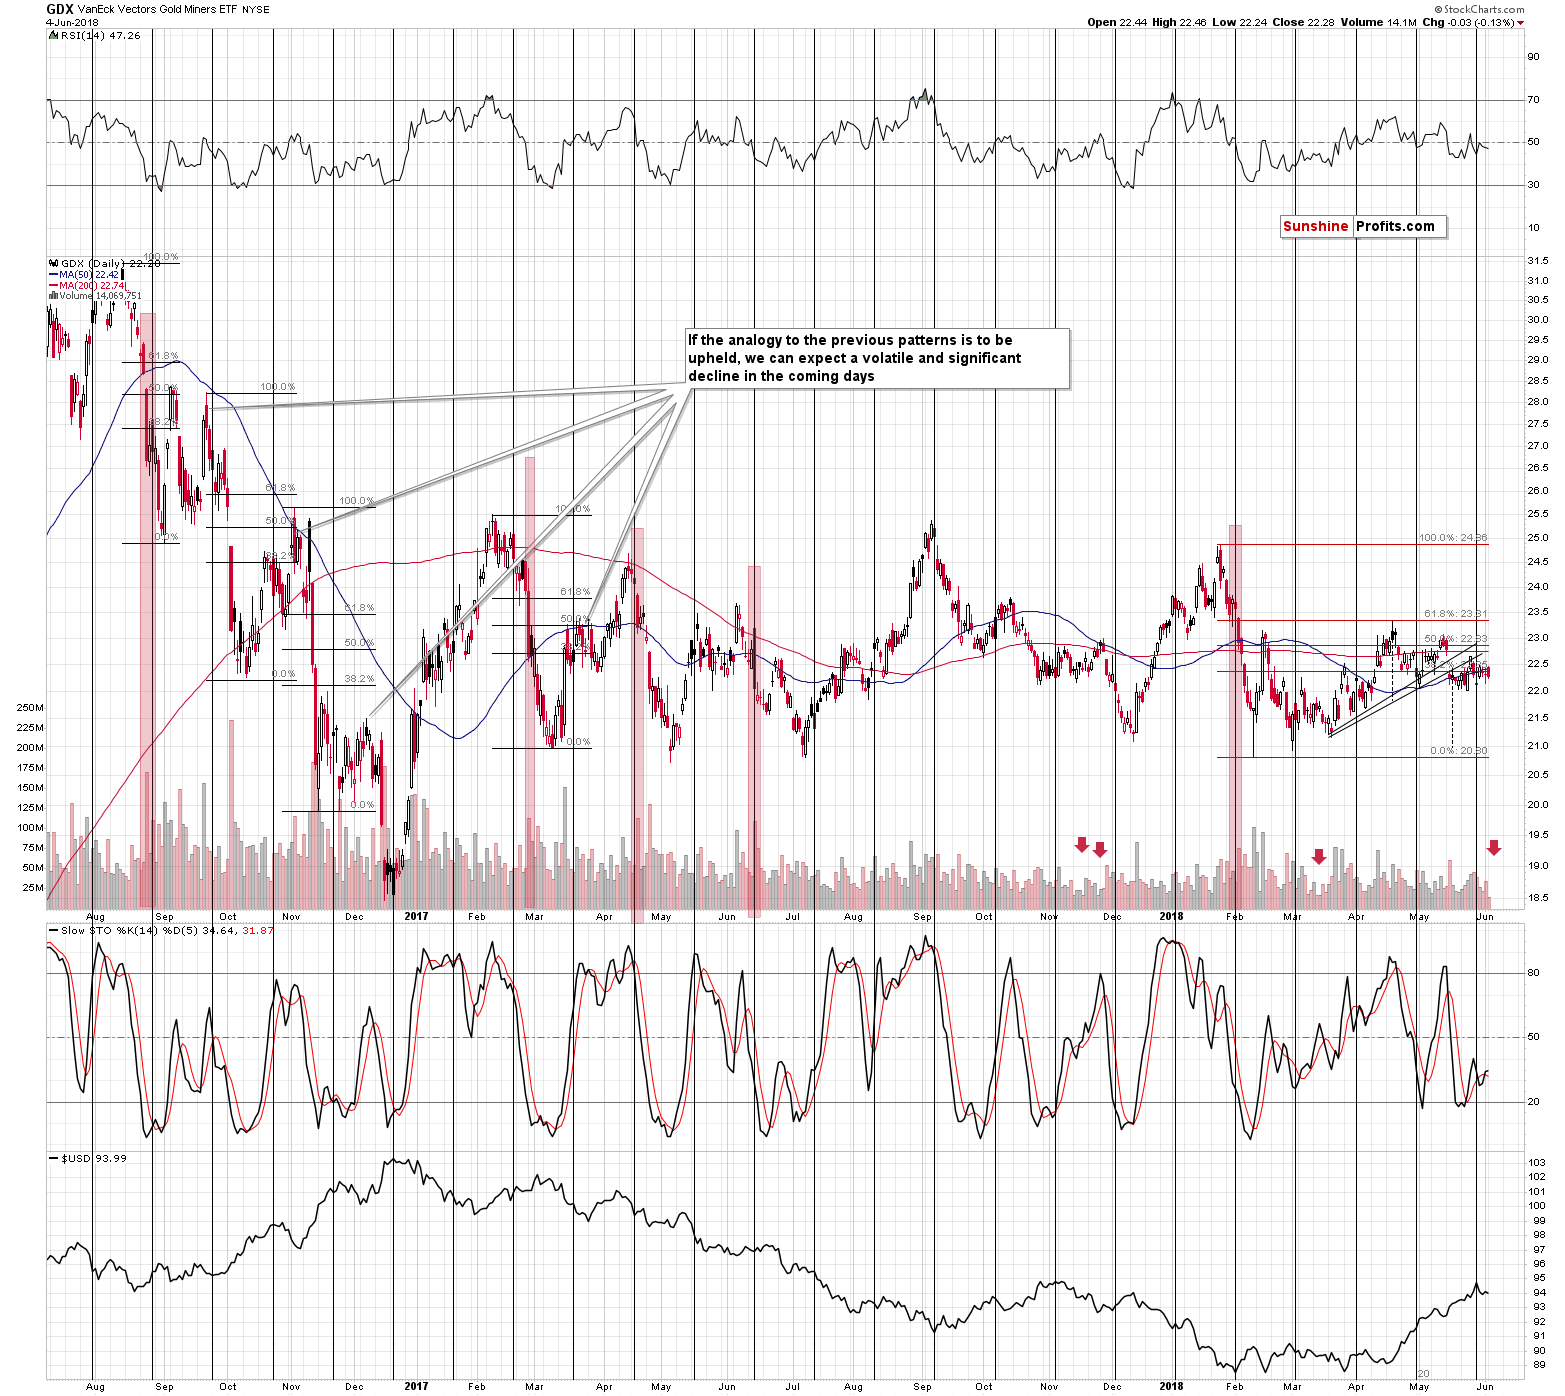
The new signal from the mining stock sector is not really visible on the above GDX chart, but we would like to start with it in order to discuss volume. The volume was extremely low during yesterday’s move lower in the GDX and it was quite low in gold and silver as well. This emphasizes just how boring the session really was and how little is going on in the market. As we discussed yesterday, let’s keep in mind the context (analogy to the 1999 calm before the storm), which makes the current boredom something very promising.
There is no clear direct implication of yesterday’s low volume as there were cases when we saw similar developments before both: rallies and declines. We marked some of the low-volume declines with red arrows on the above chart. The only thing that we can say about this signal is that we are likely at the beginning of a bigger move, but it’s not clear what kind of move it’s going to be.
Naturally, based on many other factors like the True Seasonals that we discussed yesterday, we know that the next move is likely to be to the downside except for perhaps an additional day or two.
Our comments on the likely follow-up action remain up-to-date:
After each short-term downswing that was particularly volatile, GDX moved back up a few times before the decline continued. The early 2018 decline was definitely very volatile, so we shouldn’t be surprised to see this kind of consolidation. It’s longer than the previous ones, but in terms of the prices that were reached, the 2016 price moves and the 2018 ones seem quite similar. The implication here is that once mining stocks break below their previous 2018 low, the following slide is likely to be volatile, just like the declines in 2016 were. In the light of the above, one might expect GDX to reach its late 2016 lows after such breakdown.
On a more short-term note, please note that mining stocks were also trying to break above the rising resistance line based on the March and early May lows, which is also the neck level of the bearish head-and-shoulders formation. Since there was no invalidation, the implications of this formation remain in place. Namely, GDX is likely to move at least to the mid-February 2018 lows rather sooner than later.
All in all, the short-term outlook for the precious metals mining stocks is bearish and it seems that it may become even more bearish later this month, after GDX breaks to the new 2018 lows.
Gold Stocks and Silver Stocks
As we wrote earlier, the key signal didn’t come from the GDX ETF. While it’s usually the most useful proxy for the mining stocks as it provides reliable volume data, it’s not the only one and sometimes looking at the other proxies is more important. Especially, if all the different proxies provide the same signal and GDX is the only exception.
This was the case yesterday as GDX moved lower only insignificantly, while both key precious metals indices: HUI and XAU declined significantly. Even the SIL ETF (proxy for silver stocks) moved visibly lower.
Let’s take a look at the key proxy for the gold mining stocks.
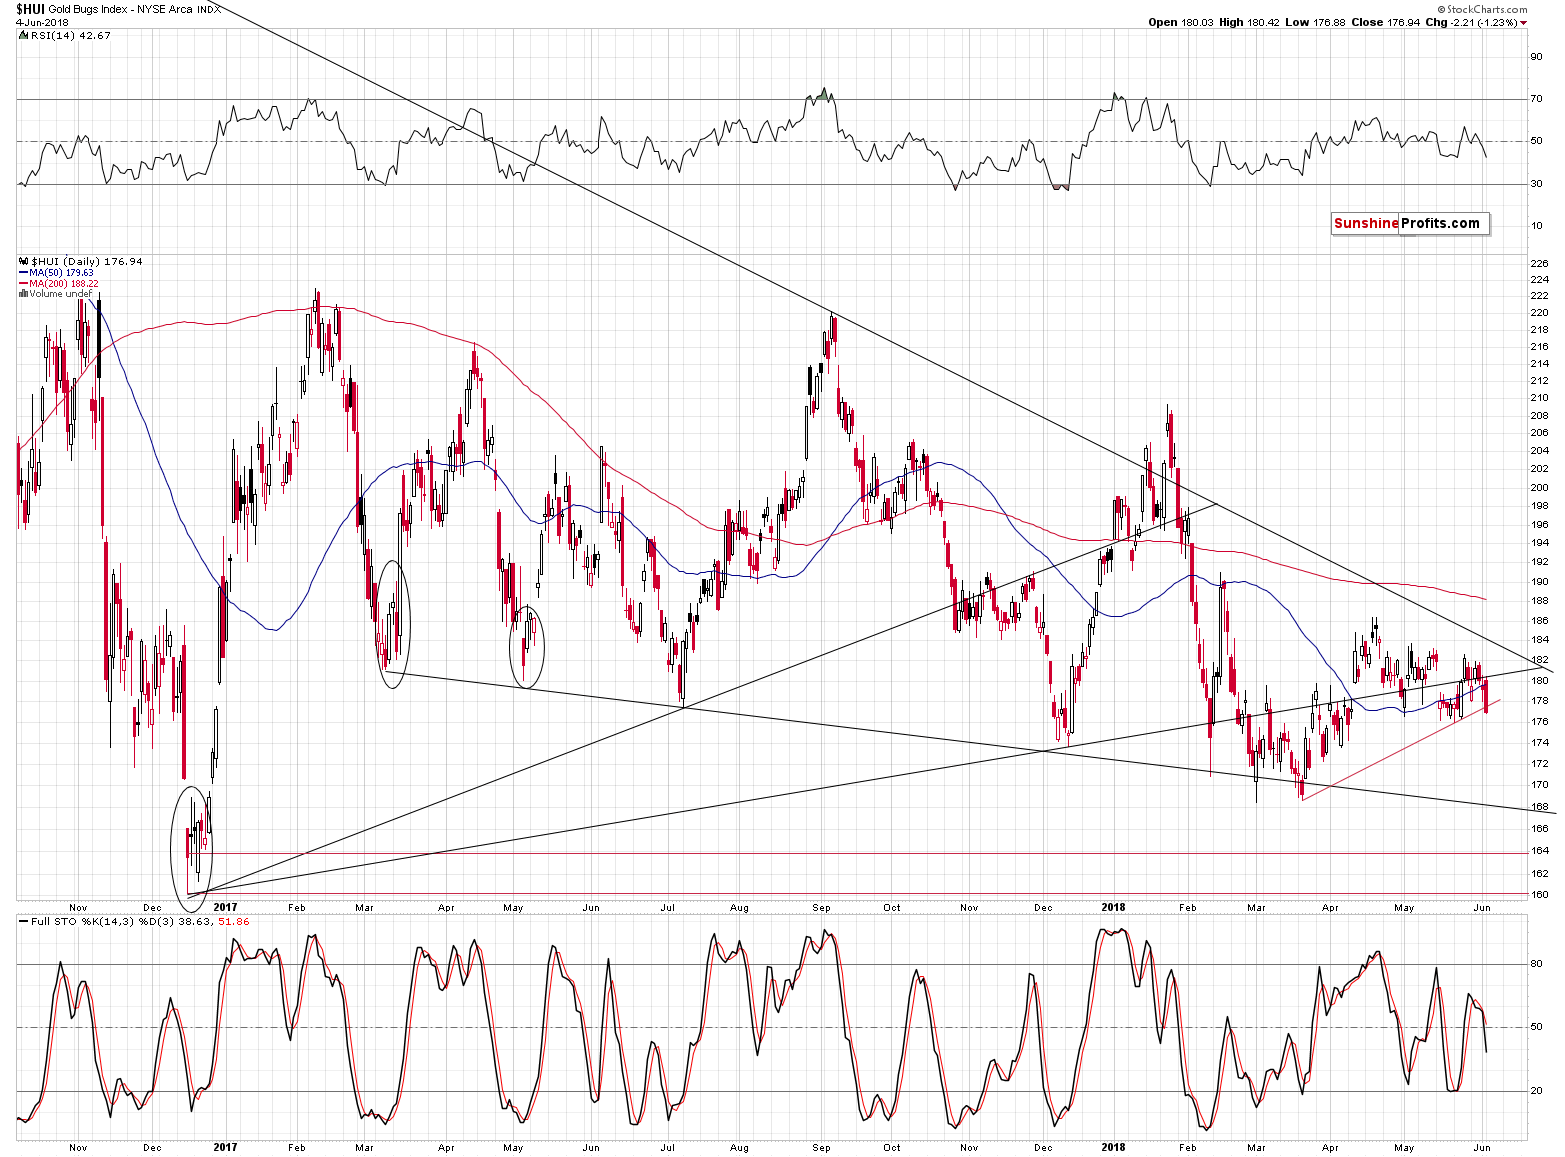
As you can see on the above chart, the HUI Index moved lower yesterday without moving back up before the end of the session. The decline was big and clear. Moreover, the HUI moved and closed below the rising, short-term support line and it was the lowest daily close since early April. Gold moved only a bit lower yesterday, so the above is a clear sign of weakness, which is definitely bearish.
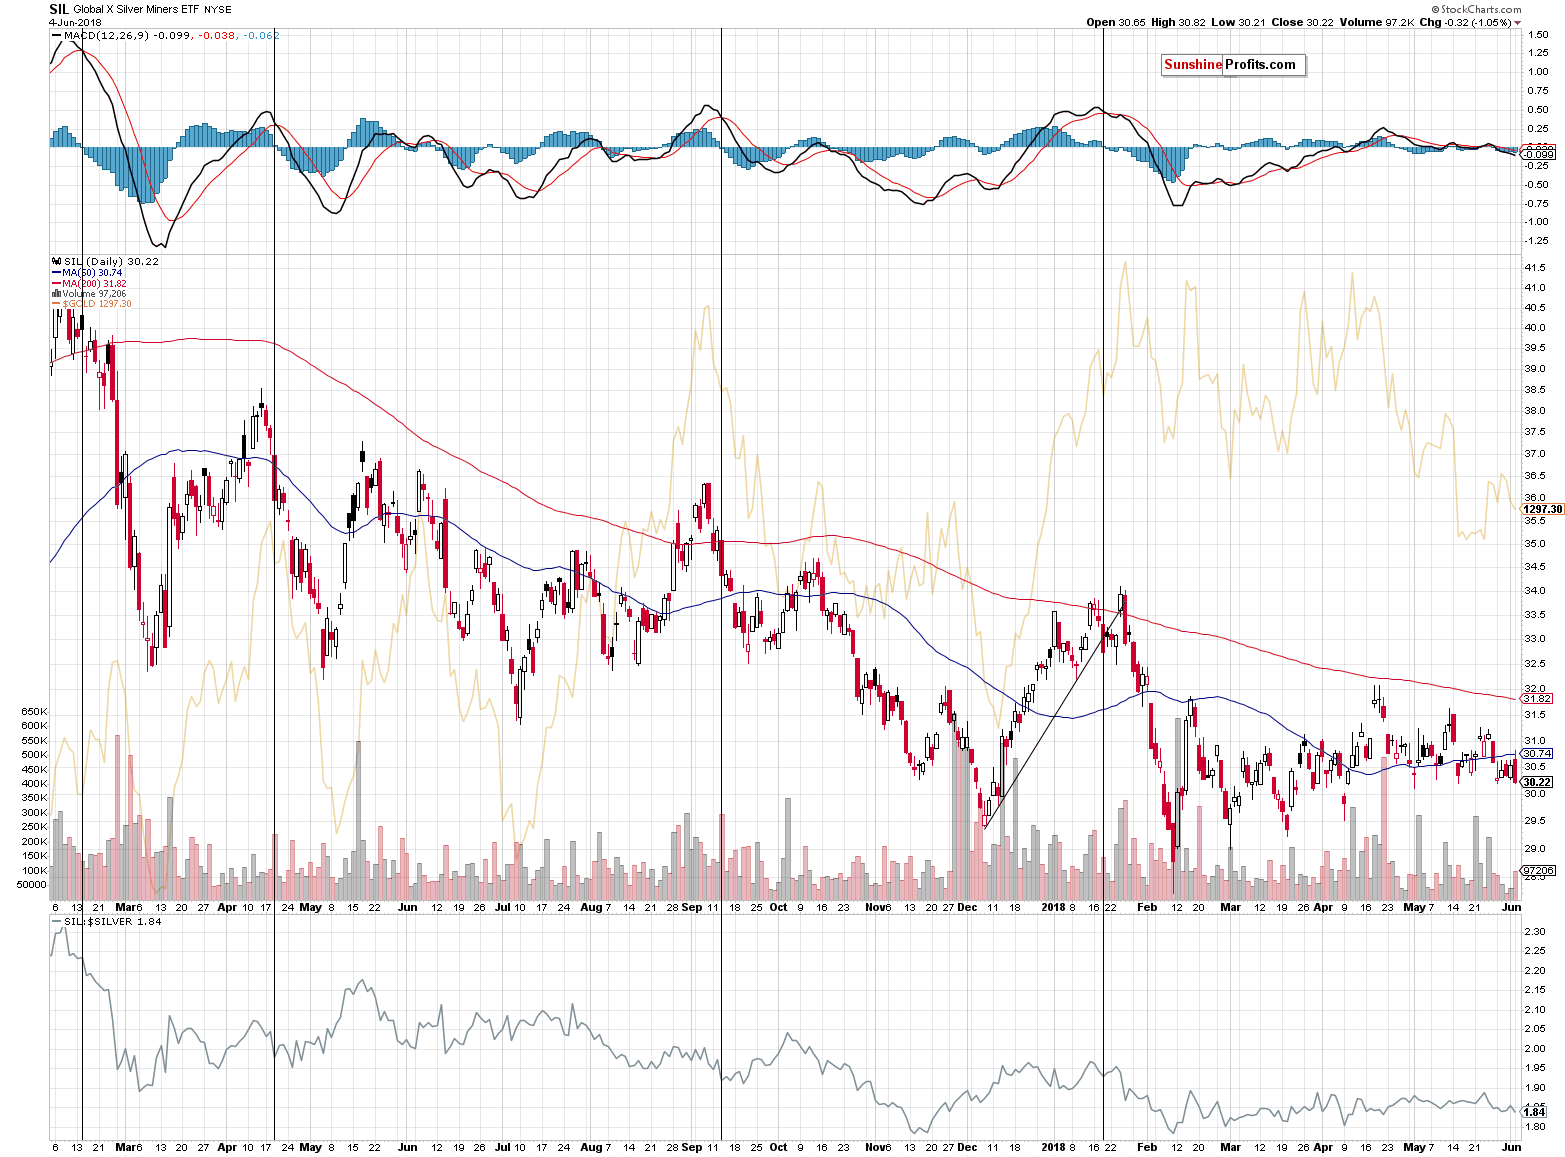
We can say exactly the same thing about silver stocks. Silver did not close yesterday’s session at new monthly low. Yet, the silver miners’ close was lowest not only on a monthly basis, but it was the lowest daily close since early April. Consequently, the signal coming from the HUI Index is confirmed and should be viewed as very important in the short run.
Summary
Summing up, it seems that the next huge downswing in the precious metals market is just around the corner and there are some short-term signs suggesting that it may even begin this week. Yesterday’ session provided us with a bearish confirmation as it showed that PMs are indeed moving in tune with their True Seasonal patterns. At the same time, gold stocks and silver stocks provided us with a bearish confirmation of their own by showing significant weakness. Moreover, let’s keep in mind that the analogies to what happened in gold and silver when the market was as boring as it’s been recently suggested that if we get another very short-term and small move higher, it may be the final one before the move to the final bottom begins. The outlook for the precious metals sector remains bearish.
As always, we’ll keep you – our subscribers – informed.
To summarize:
Trading capital (supplementary part of the portfolio; our opinion): Full short positions (200% of the full position) in gold, silver and mining stocks are justified from the risk/reward perspective with the following stop-loss orders and initial target price levels:
- Gold: initial target price: $1,251; stop-loss: $1,382; initial target price for the DGLD ETN: $48.88; stop-loss for the DGLD ETN $37.48
- Silver: initial target price: $15.73; stop-loss: $18.06; initial target price for the DSLV ETN: $27.58; stop-loss for the DSLV ETN $19.17
- Mining stocks (price levels for the GDX ETF): initial target price: $21.03; stop-loss: $23.54; initial target price for the DUST ETF: $28.88; stop-loss for the DUST ETF $21.16
In case one wants to bet on junior mining stocks' prices (we do not suggest doing so – we think senior mining stocks are more predictable in the case of short-term trades – but if one wants to do it anyway, we provide the details), here are the stop-loss details and initial target prices:
- GDXJ ETF: initial target price: $30.62; stop-loss: $36.14
- JDST ETF: initial target price: $59.68 stop-loss: $40.86
Long-term capital (core part of the portfolio; our opinion): No positions (in other words: cash)
Insurance capital (core part of the portfolio; our opinion): Full position
Plus, you might want to read why our stop-loss orders are usually relatively far from the current price.
Important Details for New Subscribers
Whether you already subscribed or not, we encourage you to find out how to make the most of our alerts and read our replies to the most common alert-and-gold-trading-related-questions.
Please note that the in the trading section we describe the situation for the day that the alert is posted. In other words, it we are writing about a speculative position, it means that it is up-to-date on the day it was posted. We are also featuring the initial target prices, so that you can decide whether keeping a position on a given day is something that is in tune with your approach (some moves are too small for medium-term traders and some might appear too big for day-traders).
Plus, you might want to read why our stop-loss orders are usually relatively far from the current price.
Please note that a full position doesn’t mean using all of the capital for a given trade. You will find details on our thoughts on gold portfolio structuring in the Key Insights section on our website.
As a reminder – “initial target price” means exactly that – an “initial” one, it’s not a price level at which we suggest closing positions. If this becomes the case (like it did in the previous trade) we will refer to these levels as levels of exit orders (exactly as we’ve done previously). Stop-loss levels, however, are naturally not “initial”, but something that, in our opinion, might be entered as an order.
Since it is impossible to synchronize target prices and stop-loss levels for all the ETFs and ETNs with the main markets that we provide these levels for (gold, silver and mining stocks – the GDX ETF), the stop-loss levels and target prices for other ETNs and ETF (among other: UGLD, DGLD, USLV, DSLV, NUGT, DUST, JNUG, JDST) are provided as supplementary, and not as “final”. This means that if a stop-loss or a target level is reached for any of the “additional instruments” (DGLD for instance), but not for the “main instrument” (gold in this case), we will view positions in both gold and DGLD as still open and the stop-loss for DGLD would have to be moved lower. On the other hand, if gold moves to a stop-loss level but DGLD doesn’t, then we will view both positions (in gold and DGLD) as closed. In other words, since it’s not possible to be 100% certain that each related instrument moves to a given level when the underlying instrument does, we can’t provide levels that would be binding. The levels that we do provide are our best estimate of the levels that will correspond to the levels in the underlying assets, but it will be the underlying assets that one will need to focus on regarding the signs pointing to closing a given position or keeping it open. We might adjust the levels in the “additional instruments” without adjusting the levels in the “main instruments”, which will simply mean that we have improved our estimation of these levels, not that we changed our outlook on the markets. We are already working on a tool that would update these levels on a daily basis for the most popular ETFs, ETNs and individual mining stocks.
Our preferred ways to invest in and to trade gold along with the reasoning can be found in the how to buy gold section. Additionally, our preferred ETFs and ETNs can be found in our Gold & Silver ETF Ranking.
As a reminder, Gold & Silver Trading Alerts are posted before or on each trading day (we usually post them before the opening bell, but we don't promise doing that each day). If there's anything urgent, we will send you an additional small alert before posting the main one.
=====
Latest Free Trading Alerts:
The U.S. dollar has recently rallied. Is it only a temporary rebound or the Fed's interest rate hikes are finally working? We invite you to read our today's article about the rapid strengthening of the greenback and find out what does it mean for the gold market.
Sharp Dollar Appreciation and Gold
Stocks were gaining on Friday following monthly jobs data release. Investors' sentiment improved as the market broke above its recent trading range. Is this a new uptrend or just an advance within a few-week-long consolidation? Tech stocks rallied, but the S&P 500 index remained below its resistance level. There are still two possible medium-term scenarios.
=====
Hand-picked precious-metals-related links:
PRECIOUS-Gold steady amid rising risk appetite and U.S. rate-hike prospects
Smart Money Is Moving Into Gold As Volatility Returns
Platinum likely to continue to struggle in June
=====
In other news:
Futures Point to Higher U.S. Open; Crude Declines: Markets Wrap
Wall Street Is Getting More Positive About Emerging Markets
Brent crude tilts lower as investors weigh supply rises
Switzerland is set to vote on a radical 'sovereign money' plan: Here’s what you need to know
U.S. Asks OPEC for 1 Million Barrel a Day Oil Output Hike
=====
Thank you.
Sincerely,
Przemyslaw Radomski, CFA
Founder, Editor-in-chief, Gold & Silver Fund Manager
Gold & Silver Trading Alerts
Forex Trading Alerts
Oil Investment Updates
Oil Trading Alerts

