

Briefly: In our opinion, full (150% of the regular size of the position) speculative short positions in gold, silver and mining stocks are justified from the risk/reward perspective at the moment of publishing this alert.
Time is more important than price. That’s what we – investors – are often made to believe regarding the future price movement. And rightfully so. Price could reach a bottom several dollars ahead of the predicted price target or it could break through it, leaving investors wondering if there was a breakdown and thus they should expect to see another big downswing shortly. With time, things are clearer. The time for a given move is up and the price reverses. When is gold likely to finally bottom?
Between August and October 2018. That’s the most up-to-date estimate based on the data that we have right now. Here’s why (chart courtesy of http://stockcharts.com).
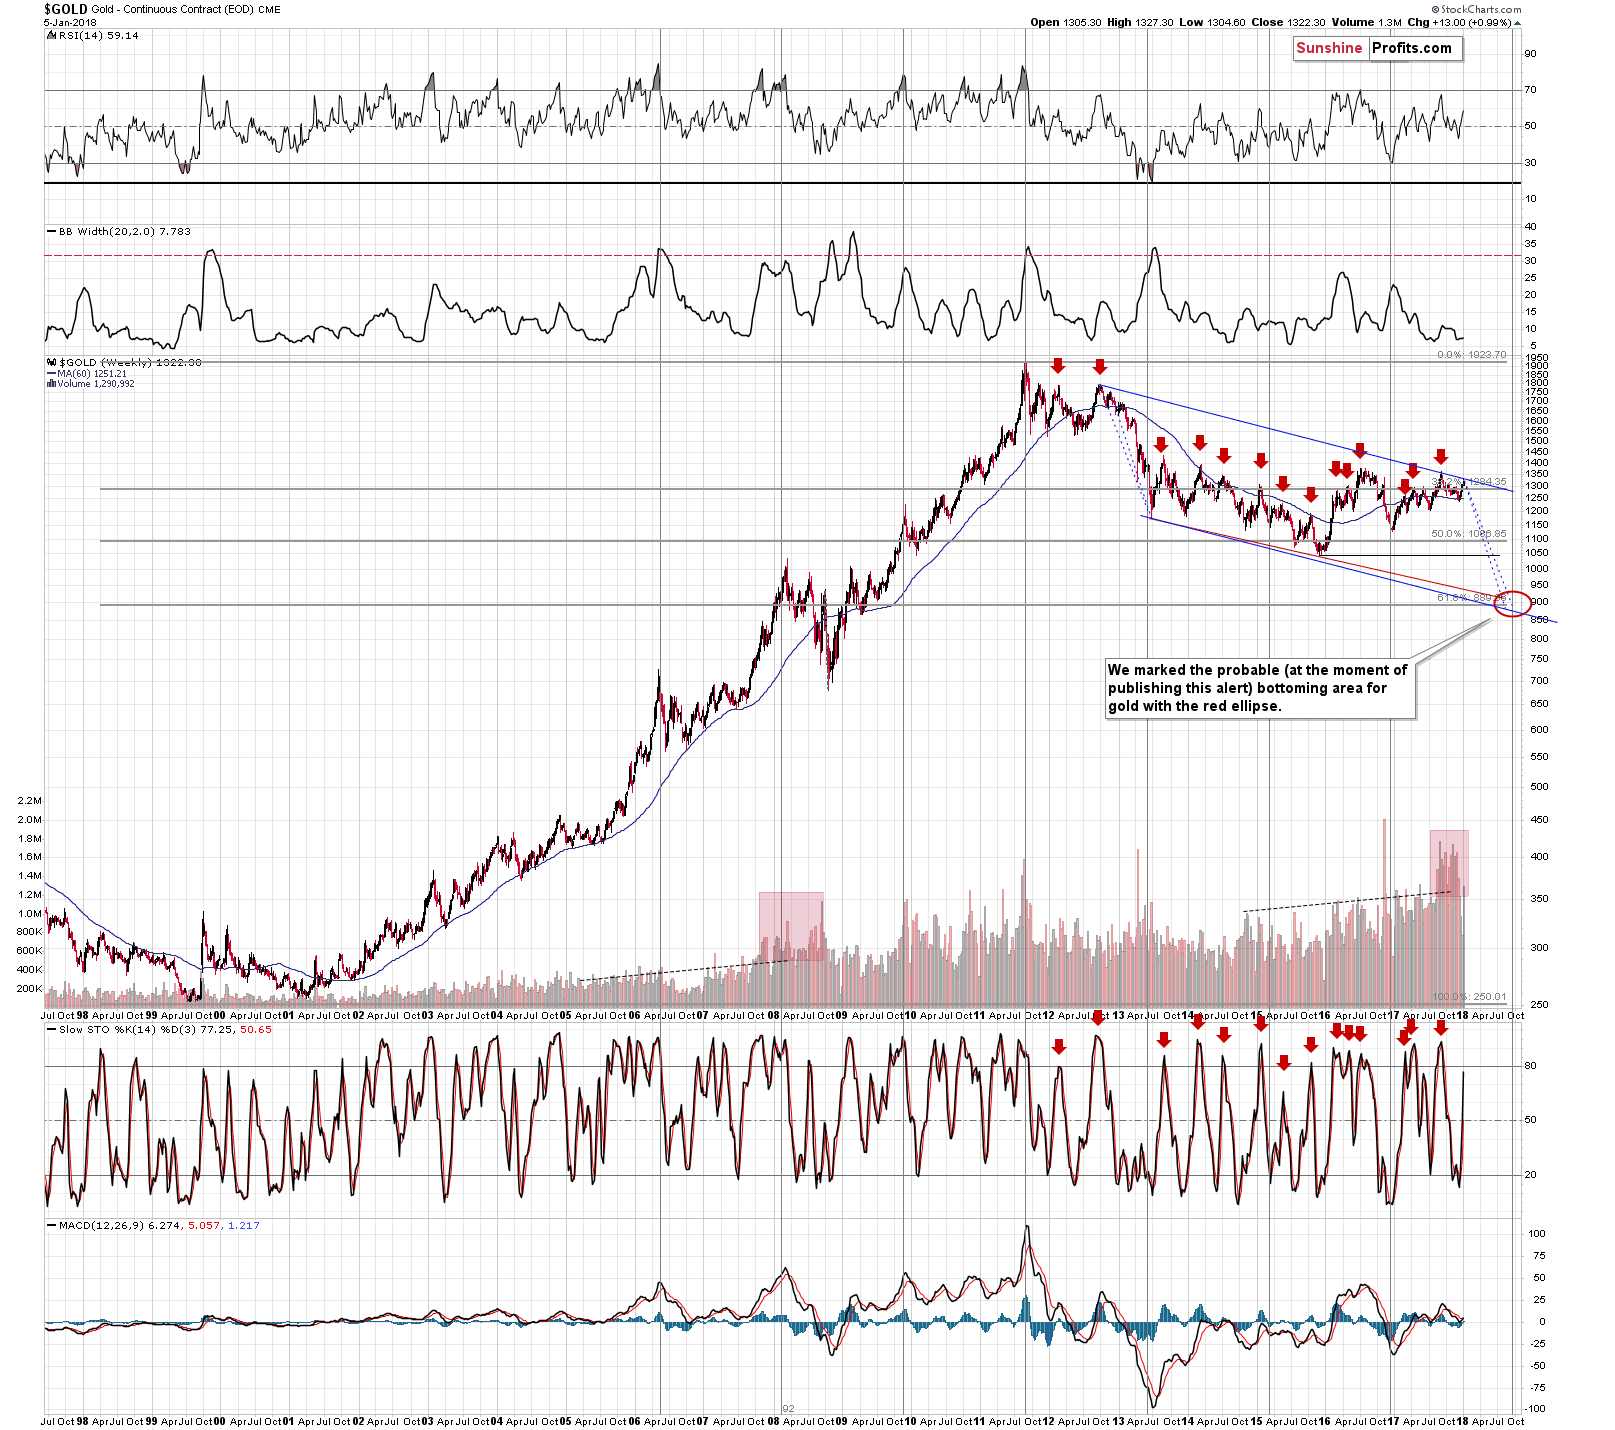
In the previous weeks and months, we wrote on multiple occasions why the current situation is similar to the 2012-2013 top and subsequent decline, so we don’t want to go into details once again today. Instead, we want to focus on the size of the follow-up action in terms of price and time.
When gold topped above $1,350 in early September 2017, it seemed that the decline might have started. This might have indeed been the case, but the pace at which gold has moved lower up to today is different. It was sharper in 2012. Consequently, perhaps looking at the decline from the late-2012 top to the 2013 bottom and applying it to the September 2017 top in order to estimate the time and price of the upcoming bottom is not the best approach.
It might be better to start the analogy with the second top of the decline – the November 2012 top. At the same time, we should take into account the scenario in which gold follows the entire 2012-2013 decline, but the current starting point should be the current top, not the September 2017 one.
Both mentioned analogies are visible on the above chart in the form of the blue dashed lines. They point to a bottom in August or in late September (perhaps early October).
The latter is more probable because of another important factor that points to this time frame. The long-term cyclical turning point.
Until the 2011 top, all long-term turning points in gold marked major interim highs and after that all of them marked interim bottoms. This also includes the 2013 bottom.
The next of the long-term turning points is to be seen in late September 2017, which perfectly fits the mentioned analogies.
Let’s move back to the shape of the declines and their size in terms of price. The price that gold is likely to reach in the second half of this year is a bit below $900 – which is in tune with the 61.8% Fibonacci retracement level and the lower border of the declining trend channel.
Speaking of the trend channel, please note that gold is almost at its upper border. Consequently, gold likely has very little room to move higher in the short term.
Before moving further, we would like to once again emphasize that the current situation is not only similar to the 2012-2013 performance, but also to the 2008 one. You can see the similarity for instance in the increase in the level of volume. This was the kind of performance that preceded one of the sharpest of gold’s declines in the past few decades.
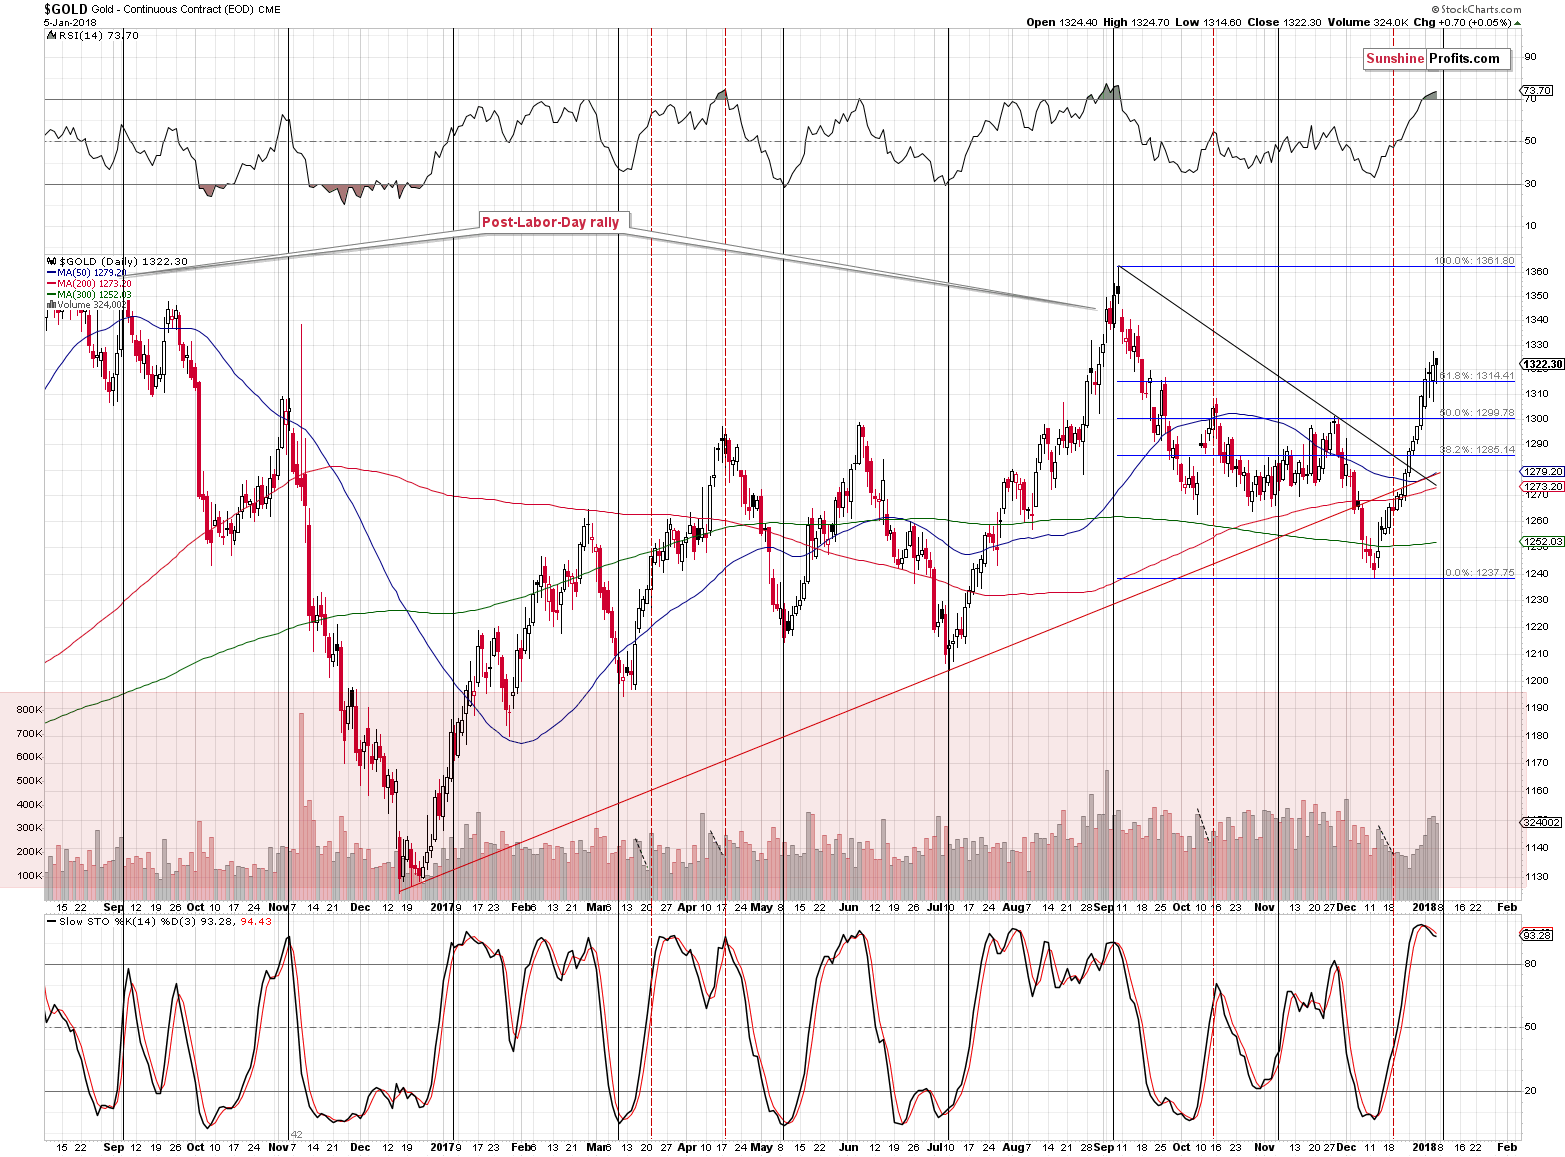
On the above chart, we see that gold is almost at its short-term turning point. This has bearish implications as the preceding move has definitely been up. Both useful indicators, the RSI and Stochastic, point to lower gold prices in the upcoming weeks.
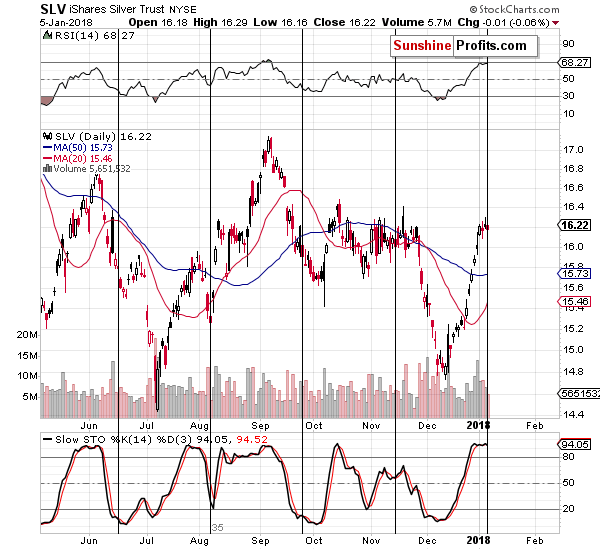
Interestingly, silver’s turning point is here as well and the indicators also point to lower prices.
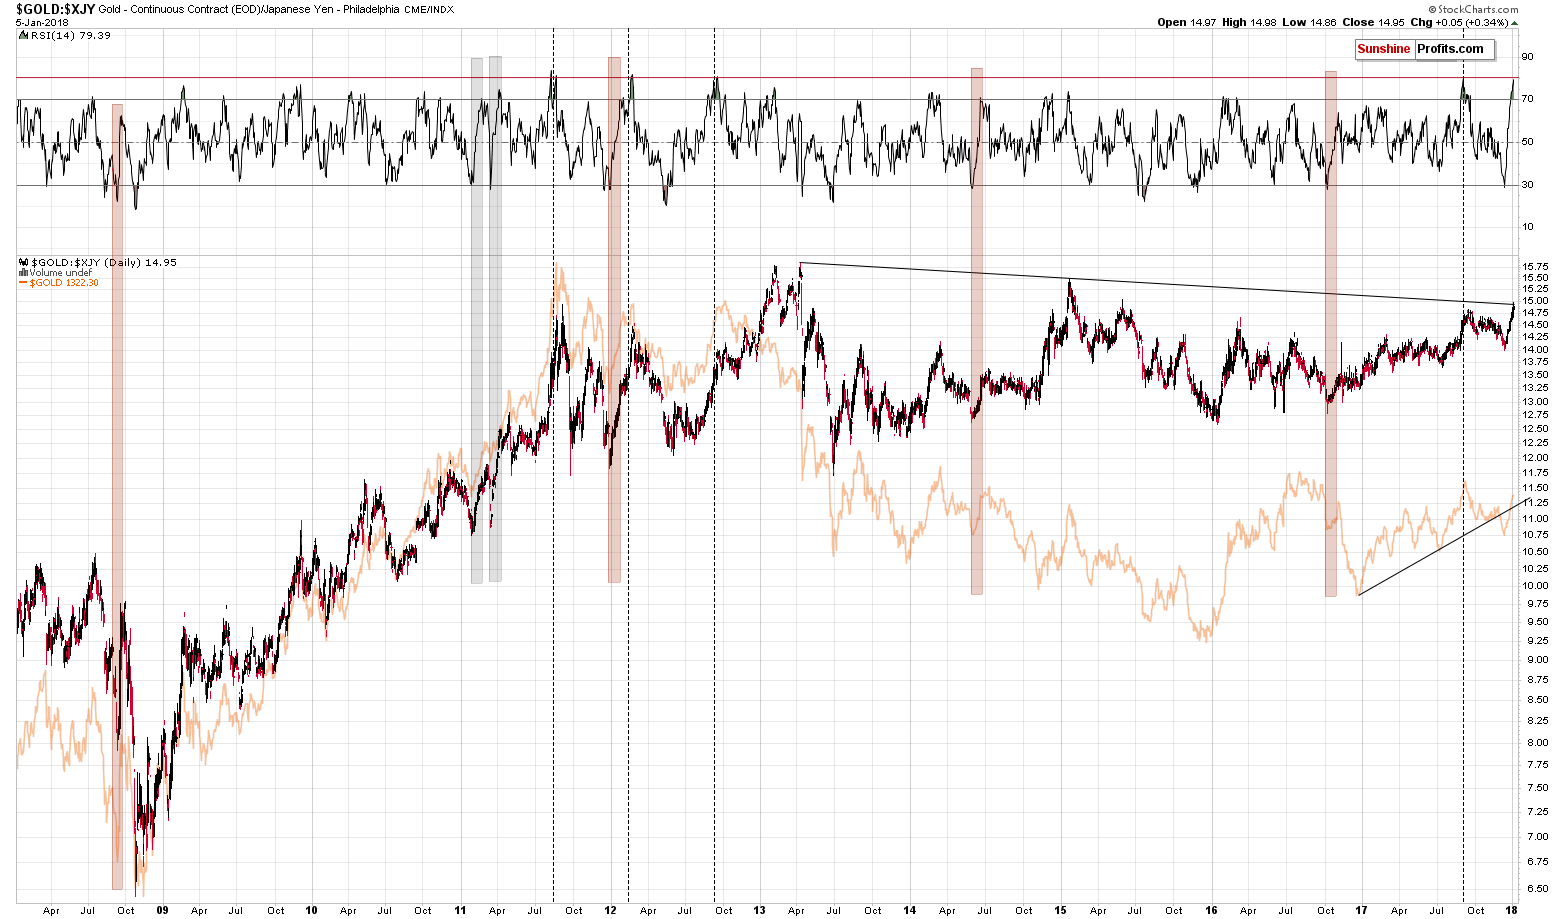
Moving back to gold, in the previous alert, we discussed the critical situation in gold in terms of the Japanese yen, so in today’s analysis, we simply want to remind that it’s still critical and the implications are still bearish.
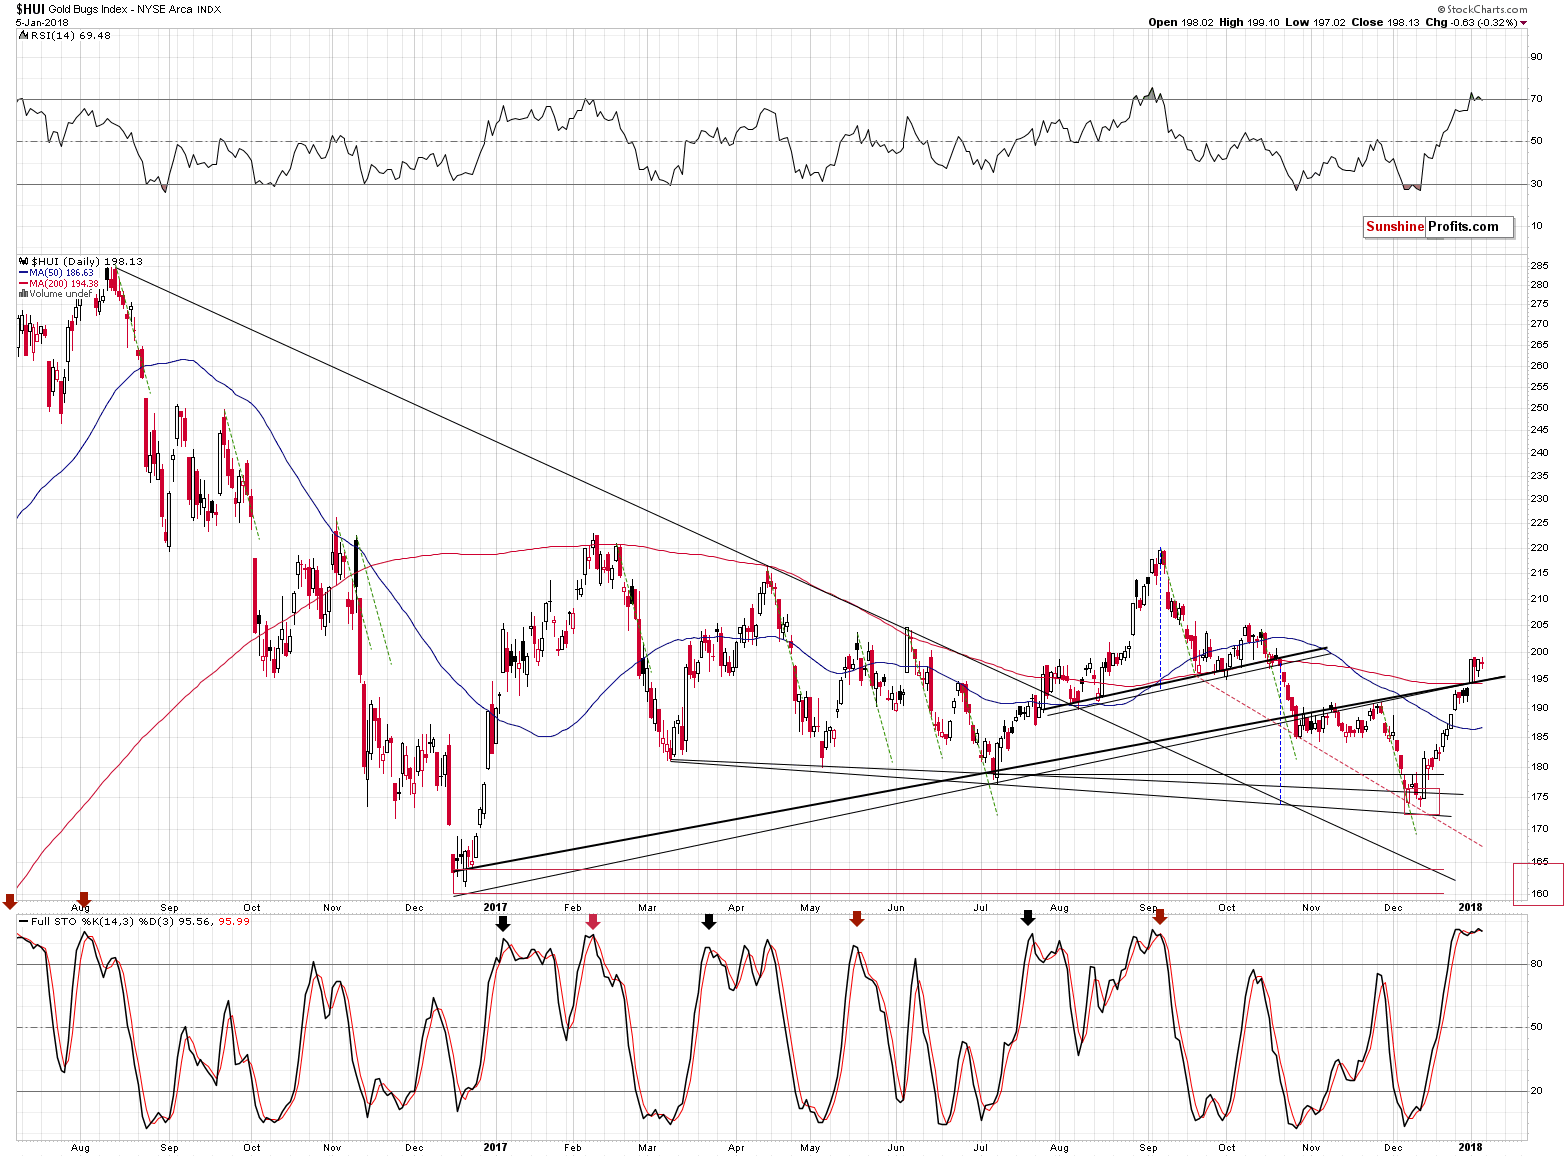
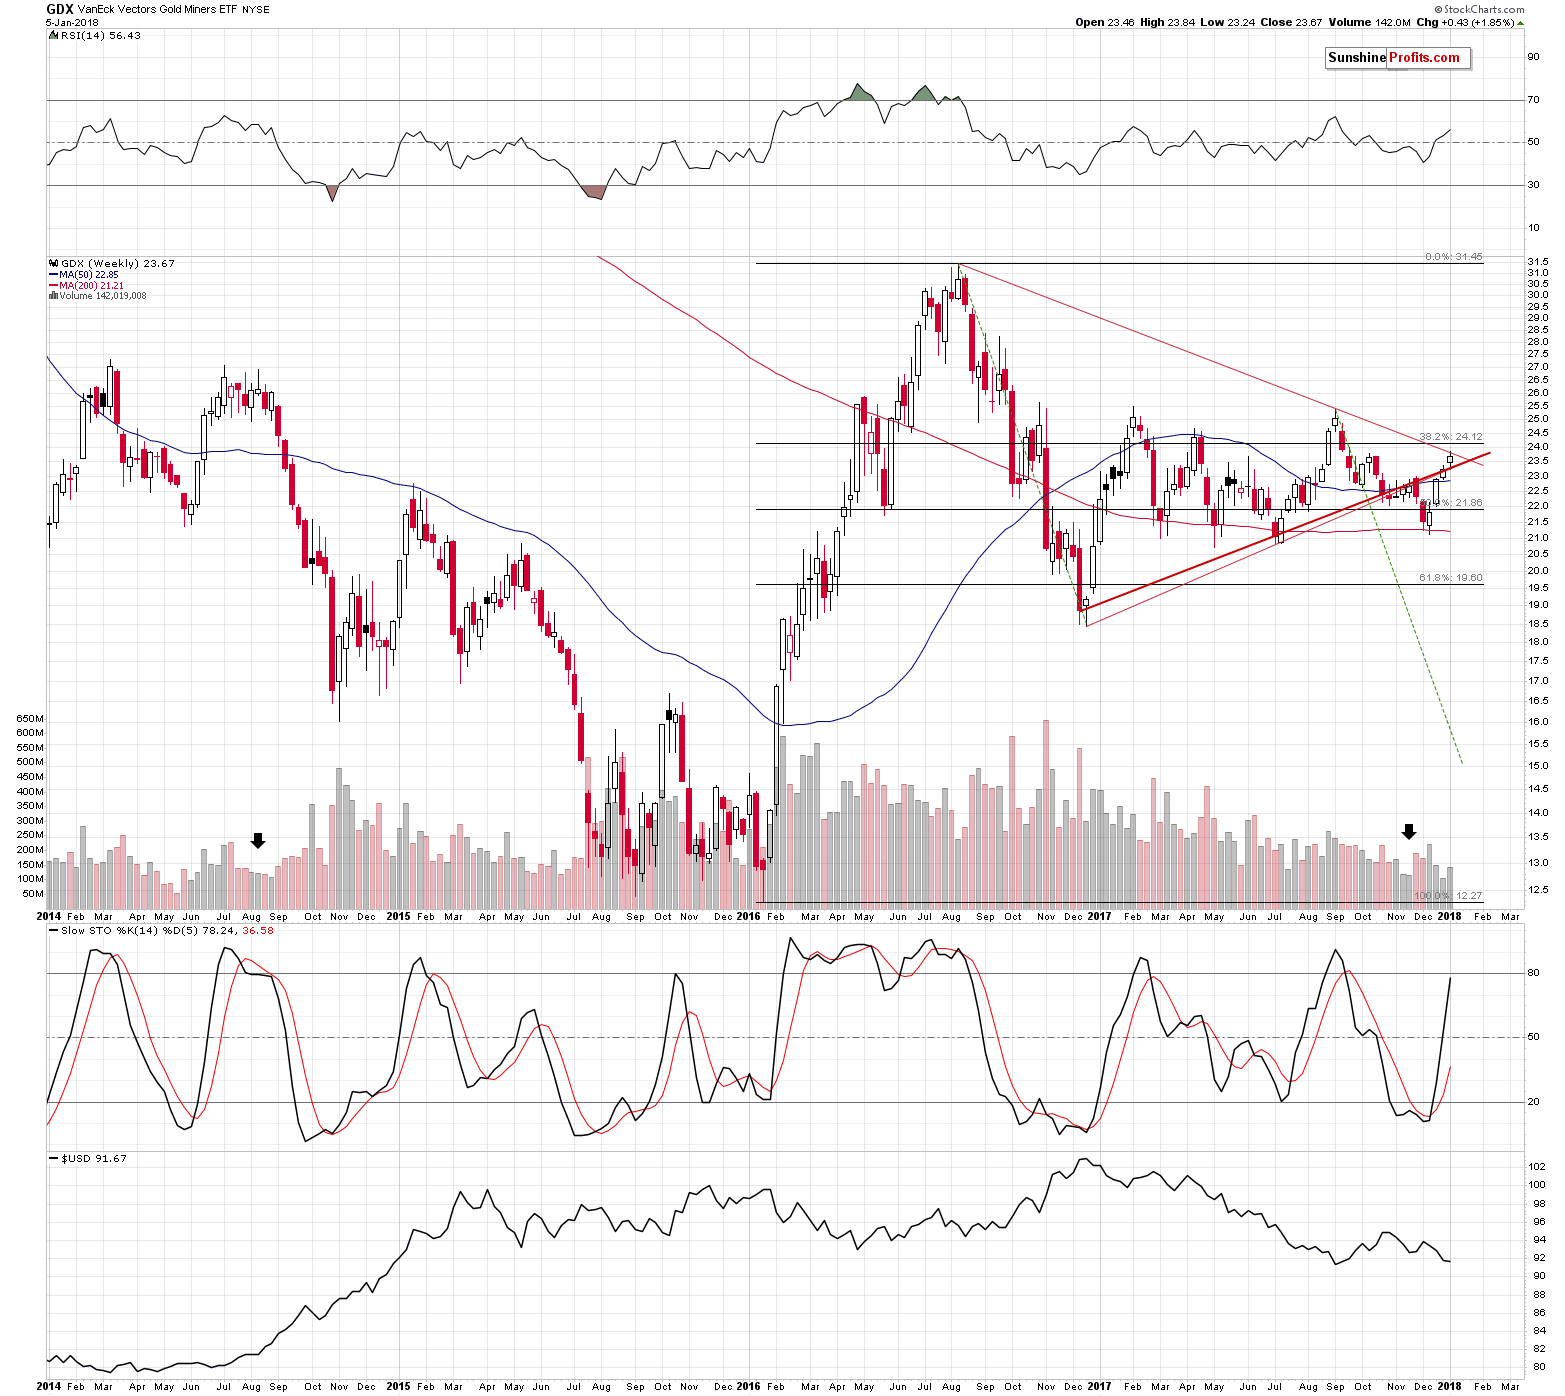
The situation didn’t change in the case of the mining stocks either. The declining, long-term resistance line was not breached and from the weekly perspective, the current situation looks like another short-term top in the making – not a major breakout. On a short-term basis, we saw a small daily decline, which, together with a small upswing in gold, serves as a bearish sign.
We previously commented on the euro’s short-term chart in the following way:
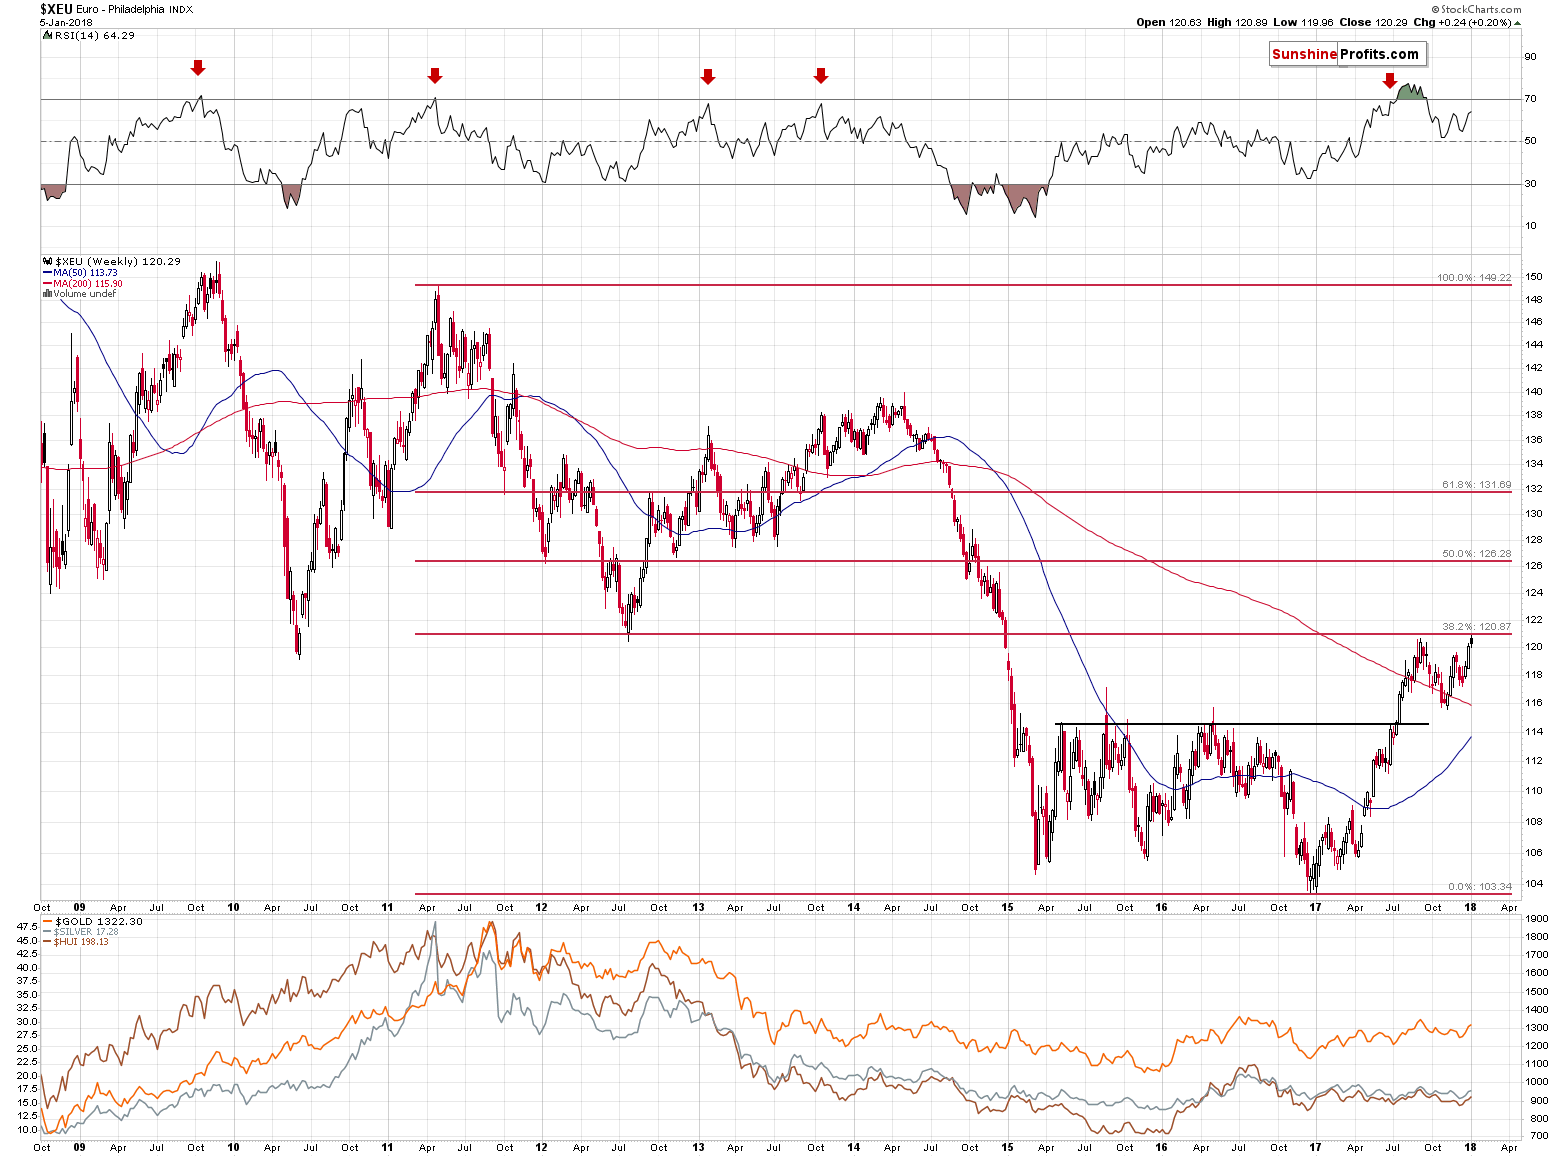
The double top in the Euro Index is also something that could trigger a reversal in the price of the yellow metal. After all, a yearly high is a very important resistance, especially if reaching it is combined with RSI’s move to the 70 level. Please note that the latter indicator was useful not only in case of the precious metals, but also in case of the Euro Index.
Today, we can add that in terms of the weekly price performance we saw a specific kind of reversal. The Euro Index had opened the week higher than the previous close and higher than it closed the week. This specific situation is marked with black candlesticks. Interestingly, we saw only one similar situation in the past years. By “similar”, we mean the above kind of candlestick that takes place after a visible rally. The similar week started on September 26th, 2016. That was the week that was followed by substantial declines in the EUR/USD and in the precious metals sector. In fact, higher prices of silver and mining stocks were never seen (gold moved a bit higher in September 2017, but the move was only temporary). The implications for PMs are bearish for the following weeks.
Before summarizing, we would like to discuss the very little-known chart featuring the junior mining stocks to senior mining stocks ratio. The reason that we’re following it, is that juniors tend to outperform seniors, further magnifying gold’s gains and consequently, the ratio moves in tune with gold. This gives us the opportunity to check for divergences and to use the ratio to confirm gold’s direction.
The link between the price of gold and the ratio is far from being clear, which is probably why it’s something that’s under the radar of most investors and analysts. However, the link being unclear doesn’t mean that we can’t use it. Applying the RSI indicator allows us to detect the particularly important price movements.
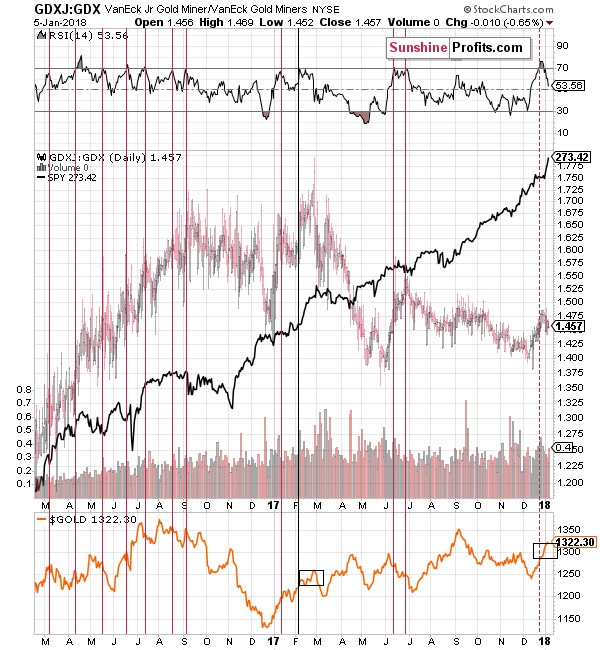
We previously featured the above chart in late 2017 and we wrote that in the majority of cases a move to the 70 level in the RSI was followed by a decline and thus the above chart had bearish implications. Even very likely doesn’t mean imminent and this time, the less likely outcome transpired. Gold moved higher, just like it was the case in one out of the 11 previous cases.
Why are we bringing this back today? In order to check if gold is performing in tune with the single session that turned out to be similar to the current performance.
It is. Back in February 2017, gold moved less than $40 higher after the signal (the RSI moving to 70) and we currently see something alike. The rally is a bit bigger right now, but very much in line with the past case. If the only similar session was followed by a rally that’s similar to the current one, then this rally might be over or about to be over.
There’s another way to look at similarities on the above chart. Instead of focusing on the RSI at 70, let’s check when was the last time thhe RSI moved to about 80, and what happened then. After all, that’s also what we saw recently. The above chart features only one similar case – April 2016. Interestingly, back then, gold moved higher by about $40+ before topping. If history is to repeat itself, gold has either topped or is about to form a top shortly.
Summing up, the medium-term outlook for the precious metals market remains bearish as confirmed by multiple factors, and based on the most recent short-term factors, it seems that the corrective upswing in gold, silver and mining stocks is either over or close to being over. Gold’s critical performance in terms of the Japanese yen, situation in the Euro Index, and both key precious metals’ turning points support the above.
Moreover, we are moving the stop-loss level for gold higher.
As always, we will keep you – our subscribers – informed.
To summarize:
Trading capital (supplementary part of the portfolio; our opinion): Full short positions (150% of the full position) in gold, silver and mining stocks are justified from the risk/reward perspective with the following stop-loss orders and initial target price levels:
- Gold: initial target price: $1,218; stop-loss: $1,343; initial target price for the DGLD ETN: $53.98; stop-loss for the DGLD ETN $40.28
- Silver: initial target price: $14.63; stop-loss: $17.62; initial target price for the DSLV ETN: $33.88; stop-loss for the DSLV ETN $21.78
- Mining stocks (price levels for the GDX ETF): initial target price: $19.22; stop-loss: $26.14; initial target price for the DUST ETF: $39.88; stop-loss for the DUST ETF $19.78
In case one wants to bet on junior mining stocks' prices (we do not suggest doing so – we think senior mining stocks are more predictable in the case of short-term trades – if one wants to do it anyway, we provide the details), here are the stop-loss details and initial target prices:
- GDXJ ETF: initial target price: $27.82; stop-loss: $38.22
- JDST ETF: initial target price: $94.88 stop-loss: $37.78
Long-term capital (core part of the portfolio; our opinion): No positions (in other words: cash)
Insurance capital (core part of the portfolio; our opinion): Full position
Important Details for New Subscribers
Whether you already subscribed or not, we encourage you to find out how to make the most of our alerts and read our replies to the most common alert-and-gold-trading-related-questions.
Please note that the in the trading section we describe the situation for the day that the alert is posted. In other words, it we are writing about a speculative position, it means that it is up-to-date on the day it was posted. We are also featuring the initial target prices, so that you can decide whether keeping a position on a given day is something that is in tune with your approach (some moves are too small for medium-term traders and some might appear too big for day-traders).
Plus, you might want to read why our stop-loss orders are usually relatively far from the current price.
Please note that a full position doesn’t mean using all of the capital for a given trade. You will find details on our thoughts on gold portfolio structuring in the Key Insights section on our website.
As a reminder – “initial target price” means exactly that – an “initial” one, it’s not a price level at which we suggest closing positions. If this becomes the case (like it did in the previous trade) we will refer to these levels as levels of exit orders (exactly as we’ve done previously). Stop-loss levels, however, are naturally not “initial”, but something that, in our opinion, might be entered as an order.
Since it is impossible to synchronize target prices and stop-loss levels for all the ETFs and ETNs with the main markets that we provide these levels for (gold, silver and mining stocks – the GDX ETF), the stop-loss levels and target prices for other ETNs and ETF (among other: UGLD, DGLD, USLV, DSLV, NUGT, DUST, JNUG, JDST) are provided as supplementary, and not as “final”. This means that if a stop-loss or a target level is reached for any of the “additional instruments” (DGLD for instance), but not for the “main instrument” (gold in this case), we will view positions in both gold and DGLD as still open and the stop-loss for DGLD would have to be moved lower. On the other hand, if gold moves to a stop-loss level but DGLD doesn’t, then we will view both positions (in gold and DGLD) as closed. In other words, since it’s not possible to be 100% certain that each related instrument moves to a given level when the underlying instrument does, we can’t provide levels that would be binding. The levels that we do provide are our best estimate of the levels that will correspond to the levels in the underlying assets, but it will be the underlying assets that one will need to focus on regarding the signs pointing to closing a given position or keeping it open. We might adjust the levels in the “additional instruments” without adjusting the levels in the “main instruments”, which will simply mean that we have improved our estimation of these levels, not that we changed our outlook on the markets. We are already working on a tool that would update these levels on a daily basis for the most popular ETFs, ETNs and individual mining stocks.
Our preferred ways to invest in and to trade gold along with the reasoning can be found in the how to buy gold section. Additionally, our preferred ETFs and ETNs can be found in our Gold & Silver ETF Ranking.
As a reminder, Gold & Silver Trading Alerts are posted before or on each trading day (we usually post them before the opening bell, but we don't promise doing that each day). If there's anything urgent, we will send you an additional small alert before posting the main one.
=====
Hand-picked precious-metals-related links:
Gold rate today: Gold, silver down in early trade
Crude Oil Prices Stall at 2.5-Year Highs, Gold Eyes Fed-Speak
=====
In other news:
Lithuania urges Canada to join long-term investment drive for Ukraine
China isn't just a manufacturing hub anymore, UBS says
=====
Thank you.
Sincerely,
Przemyslaw Radomski, CFA
Founder, Editor-in-chief, Gold & Silver Fund Manager
Gold & Silver Trading Alerts
Forex Trading Alerts
Oil Investment Updates
Oil Trading Alerts

