

Briefly: in our opinion, full (300% of the regular position size) speculative short positions in junior mining stocks are justified from the risk/reward point of view at the moment of publishing this Alert.
The general stock market moved higher by 1.42% yesterday, and one would have thought that it would trigger a rally in mining stocks as well – after all, the latter are “soooo oversold” right now, right?
Well, no.
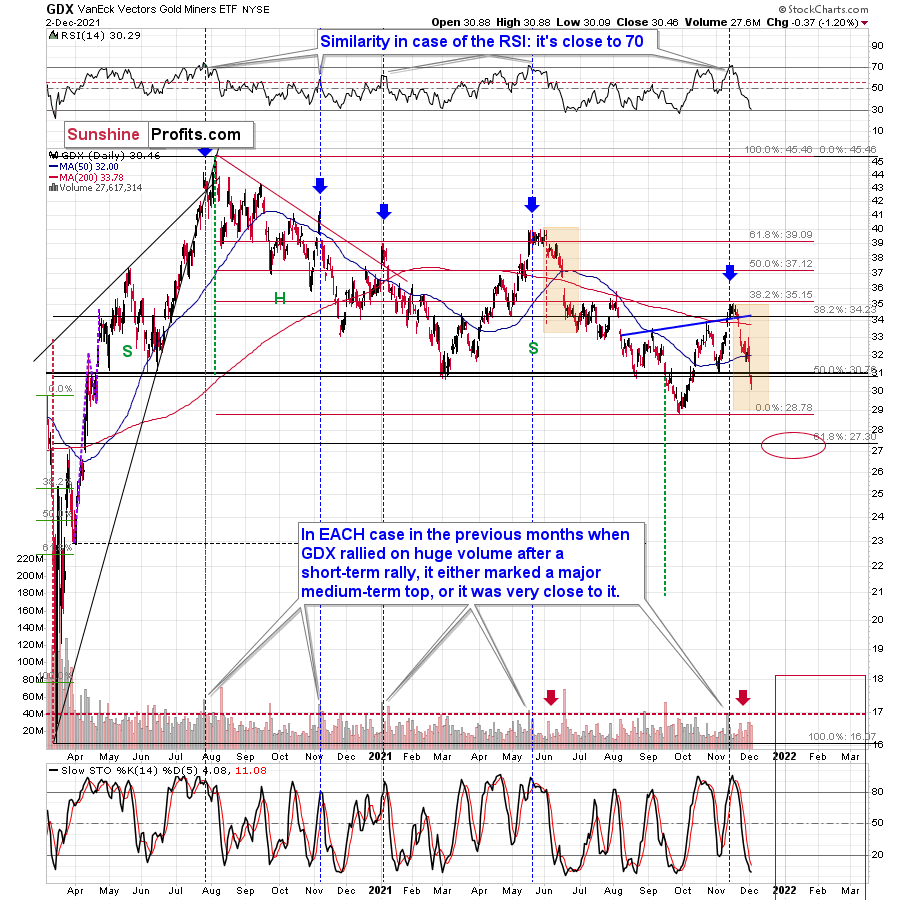
The GDX ETF declined by 1.20% yesterday, and there were actually just 12 sessions this year when the GDX closed the day at lower levels.
On Wednesday, gold was up, while stocks (S&P 500) were down significantly, and the GDX declined significantly.
Yesterday (on Thursday), gold was down, while stocks (S&P 500) were up significantly, and the GDX declined visibly anyway.
If we take the last two trading days into account, the GLD is down by a mere $0.26 (0.16%), while the SPY ETF (a proxy for stocks) is up by 1.84 (0.4%). Since gold miners are mostly influenced by gold, but also – temporarily – by stocks, one could have expected the GDX to be more or less flat over the last 2 days.
The GDX ETF declined by $1.34, which is 4.4%, and the GDXJ ETF declined by $2.09, which is 5.15%.
So much for the bullish narrative for 2021.
Is a rebound coming?
Well, the RSI at about 30 would suggest so, but please note that this could mean just a slight pause, and not necessarily a rebound that is big enough to be worth trading. We saw something like that in June, for example. The RSI moved below 30, but the GDX itself moved only slightly higher and then the decline continued.
So, a rebound might be coming, but it might as well not be coming, at least not right now. A meaningful rebound might not be here until gold reaches its previous 2021 lows. Why would it be the case (other than the fact that I’ve been writing about that for many weeks and emphasized the reasoning behind it in multiple flagship Gold & Silver Trading Alerts)?
To clarify, my reasons (that I’ve been going over and over again) are what’s likely to initially make gold slide to its previous lows. Afterwards, we might (!) see a corrective upswing and then another – huge – wave down.
But why would one think that the slide to the previous 2021 lows is about to start now or shortly?
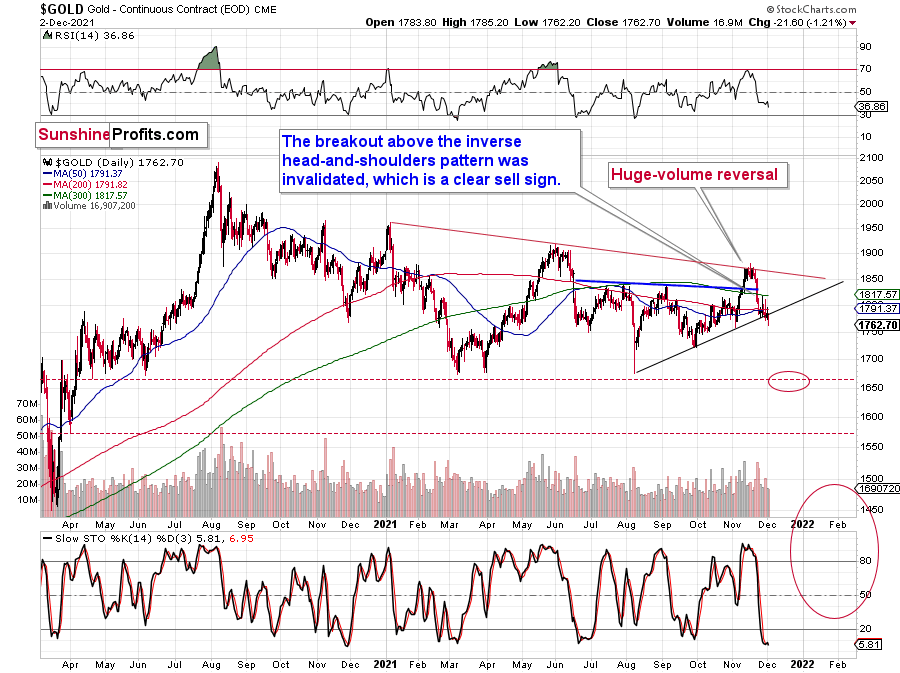
Because of gold’s breakdown!
The gold price declined by $21.60 yesterday, and it closed visibly below the rising support line. The breakdown is not confirmed yet, but since gold broke lower without any meaningful movement in the USD Index, it’s likely that the breakdown was a true one, and that it will indeed be confirmed.
Also, let’s keep in mind the extremely bearish situation in world stocks.
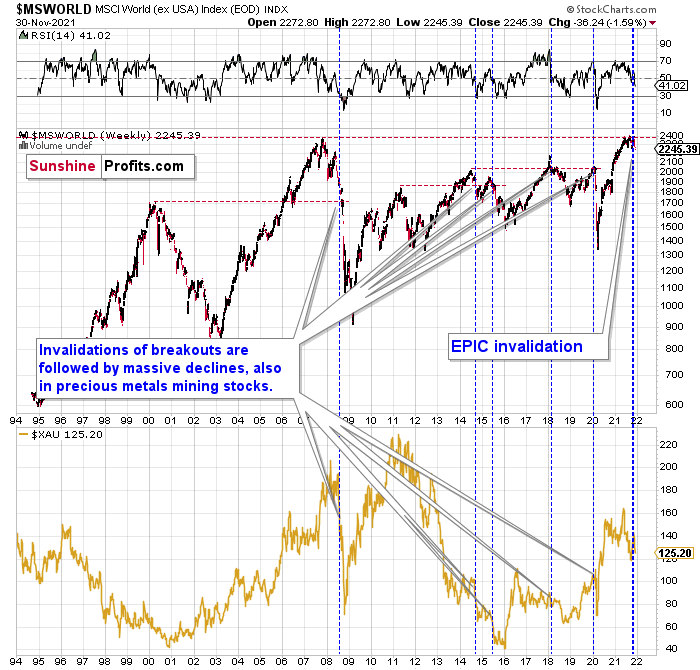
My Tuesday’s comments on the above chart remain up-to-date:
Something truly epic is happening in this chart. Namely, world stocks tried to soar above their 2007 high, they managed to do so and… they failed to hold the ground. Despite a few attempts, the breakout was invalidated. Given that there were a few attempts and that the previous high was the all-time high (so it doesn’t get more important than that), the invalidation is a truly critical development.
It's a strong sell signal for the medium- and quite possibly for the long term.
From our – precious metals investors’ and traders’ – point of view, this is also of critical importance. All previous important invalidations of breakouts in world stocks were followed by massive declines in the mining stocks (represented by the XAU Index).
Two of the four similar cases are the 2008 and 2020 declines. In all cases, the declines were huge, and the only reason why they appear “moderate” in the lower part of the above chart is that it has a “linear” and not “logarithmic” scale. You probably still remember how significant and painful (if you were long that is) the decline at the beginning of 2020 was.
Now, all those invalidations triggered big declines in the mining stocks, and we have “the mother of all stock market invalidations” at the moment, so the implications are not only bearish, but extremely bearish.
What does it mean? It means that it is time when being out of the short position in mining stocks to get a few extra dollars from immediate-term trades might be risky. The possibility that the omicron variant of Covid makes vaccination ineffective is too big to be ignored as well. If that happens, we might see 2020 all over again – to some extent. In this environment, it looks like the situation is “pennies to the upside and dollars to the downside” for mining stocks. Perhaps tens of dollars to the downside… You have been warned.
Having said that, let’s take a look at the situation from a more fundamental angle.
All Aboard
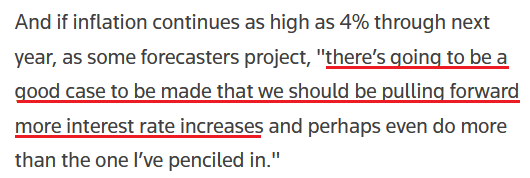
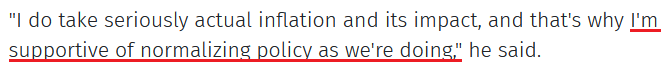
First, it was Clarida, and then it was Waller. Then it was Bostic, and then it was Powell. And with more and more Fed officials lining up to voice their hawkish concerns on Dec. 2, the PMs’ foundation of sand is starting to crumble.
Speaking at the Reuters Next conference on Dec. 2, Atlanta Fed President Raphael Bostic reiterated that “I think having this [taper] finished some time before the end of the first quarter would be in our interest.”
More importantly, though, with an accelerated taper only one piece of the hawkish puzzle, suddenly, rate hikes have entered his vocabulary:
 Source: Reuters
Likewise, San Francisco Fed President Mary Daly (a major dove) said on Dec. 2 that “if we didn't have higher inflation readings, you might let the economy go a little bit more to see if we can get through COVID and have those individuals come back.”
However:
“Right now, we're dealing with inflation that's above our target and inconsistent in its current readings with our longer-run views on price stability. We have to deal with that.”
And how should the FOMC “deal with that?”
 Source: Reuters
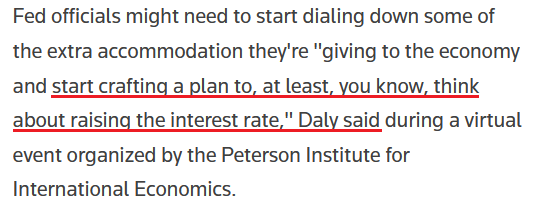
Making three of a kind, Richmond Fed President Thomas Barkin also voiced his hawkish concerns on Dec. 2. Speaking at a virtual event organized by the Peterson Institute for International Economics, Barkin followed his peers down the new hawkish road:
 Source: Reuters
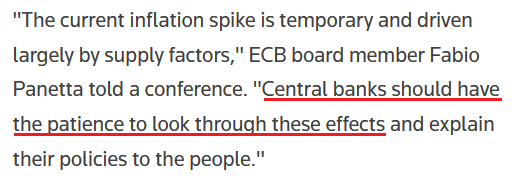
In stark contrast, I mentioned on Dec. 1 that elevated Eurozone inflation runs the risk of awakening the ECB. However, with the dove-hawk gap between the ECB and the Fed widening once again, ECB board member Fabio Panetta said the following on Dec. 2:
“I do recognize that the micro experience of our citizens at the fuel pump is quite a difference from the macro reading of economists and central bankers…. Still, in our view, Euro Area inflation is mostly transitory... even if some of its components will probably prevail longer over the next year than previously expected.”
As a result:
 Source: Reuters
Thus, as the Fed and the ECB move in opposite directions, the development is extremely bullish for the USD Index. For context, the EUR/USD accounts for nearly 58% of the movement of the USD Index, and the currency pair is the basket's largest component.
To that point, with the PMs' bullish binges now morphing into profound headaches, their prior willingness to ignore the U.S. dollar's ascent has left them with major hangovers. Moreover, while nearly every other asset class rallied on Dec. 2, gold, the GDX ETF and the GDXJ ETF all declined by more than 1%. As a result, even the S&P 500's spike on Dec. 2 wasn't enough to uplift the precious metals.
And with more downside likely on the horizon, the Fed and U.S. President Joe Biden's inflationary conundrum continues to intensify. To explain, I warned that the political ramifications of high inflation make tightening monetary policy the lesser of two evils. In a nutshell: letting inflation run hot will likely do more harm to the U.S. economy than raising interest rates. And with Fed officials realizing that they're behind the curve and Biden encouraging them to play catch-up, the 2021 theme of 'USD Index up, PMs down' likely has more room to run.
For example, the NFIB released its labor market update on Dec. 2. And with wage inflation a hot topic, the report revealed:
“Small business owners continue to struggle to increase their workforce with 29% of owners reporting labor quality as their top business problem in November, a 48-year record high.”
“Seasonally adjusted, a net 44% reported raising compensation, unchanged from October and a 48-year record high reading. A net 32% plan to raise compensation in the next three months, unchanged from October’s record high reading.”
Moreover, NFIB Chief Economist Bill Dunkelberg provided the following context:
“Unfortunately, the tight labor market has not eased for small business owners. Unfilled positions and labor quality remain the biggest challenges for small business owners as they work to get back to pre-crisis levels. Owners have been increasing compensation to record-high levels to attract the right employees to their business.”
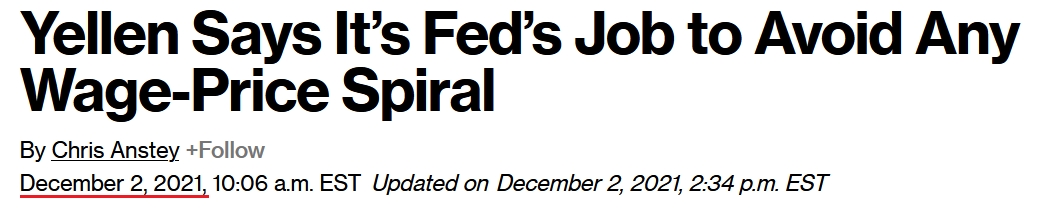
And what a coincidence: with inflationary anxiety rising within the U.S. government, U.S. Treasury Secretary Janet Yellen has already started the blame game:
 Source: Bloomberg
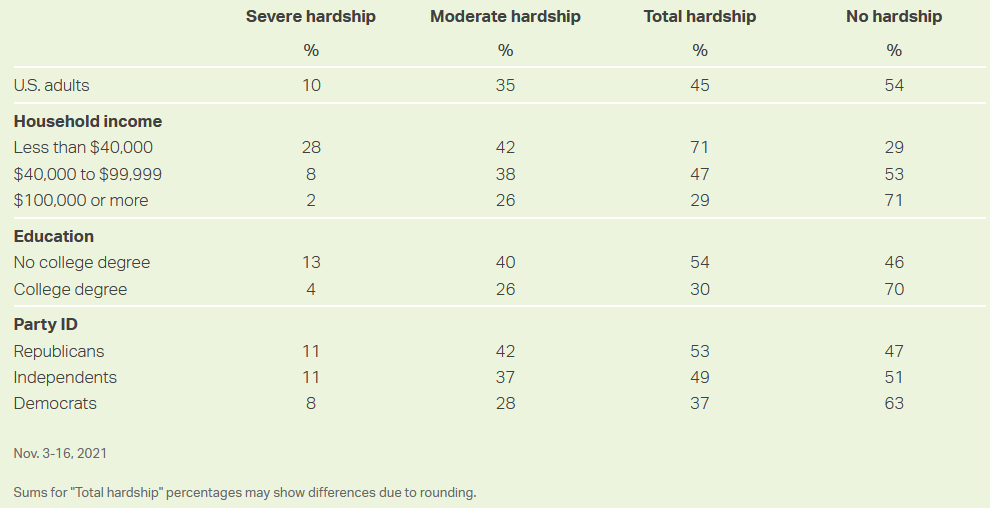
As further evidence, Gallup released the results of its “Nov. 3-16 probability-based web panel survey” on Dec. 2. And with inflation the main topic, Gallup found that “45% of American households report that recent price increases are causing their family some degree of financial hardship.”
In addition:
“Lower-income households are most likely to have experienced financial hardship due to price increases. Seventy-one percent of those living in households making less than $40,000 a year say that recent price hikes have caused their family financial hardship. That compares with 47% of those in middle-income households and 29% in upper-income households.
“Moreover, 28% of lower-income Americans describe the hardship they are experiencing as severe and affecting their ability to maintain their current standard of living.”
Please see below:
 Source: Gallup
The bottom line? Inflationary concerns have officially gone mainstream. As a result, inflation is no longer a ‘financial market problem’ that can be rationalized as “transitory.” Moreover, politicians act when voters voice their displeasure (usually to preserve their own survival).
Thus, it’s no surprise that Biden has waged a war on inflation. It’s also no surprise that Powell and all of the other Fed officials are following him into battle. As such, with the PMs' fundamental uprisings often driven by a weaker U.S. dollar and lower interest rates, the state of play over the next few months should be the exact opposite.
In conclusion, the PMs declined again on Dec. 2, and their once wild optimism has withered away. And with Biden, Powell, and his entire crew of Fed officials amplifying the hawkish rhetoric, the PMs’ pathway to higher prices remains extremely treacherous. As a result, their medium-term outlooks still remain bearish, and lower lows will likely materialize over the next few months.
Overview of the Upcoming Part of the Decline
- It seems to me that the current corrective upswing in gold is about to be over soon, and the next short-term move lower is about to begin. Since it appears to be another short-term move more than a continuation of the bigger decline, I think that junior miners are likely to (at least initially) decline more than silver.
- It seems that the first stop for gold will be close to its previous 2021 lows, slightly below $1,700. Then it will likely correct a bit, but it’s unclear if I want to exit or reverse the current short position based on that – it depends on the number and the nature of the bullish indications that we get at that time.
- After the above-mentioned correction, we’re likely to see a powerful slide, perhaps close to the 2020 low ($1,450 - $1,500).
- If we see a situation where miners slide in a meaningful and volatile way while silver doesn’t (it just declines moderately), I plan to – once again – switch from short positions in miners to short positions in silver. At this time, it’s too early to say at what price levels this could take place, and if we get this kind of opportunity at all – perhaps with gold close to $1,600.
- I plan to exit all remaining short positions once gold shows substantial strength relative to the USD Index while the latter is still rallying. This may be the case with gold close to $1,350 - $1,400. I expect silver to fall the hardest in the final part of the move. This moment (when gold performs very strongly against the rallying USD and miners are strong relative to gold after its substantial decline) is likely to be the best entry point for long-term investments, in my view. This can also happen with gold close to $1,375, but at the moment it’s too early to say with certainty. I expect the final bottom to take place near the end of the year, perhaps in mid-December. It is not set in stone that PMs have to bottom at that time. If not then, then early 2022 would become a likely time target.
- As a confirmation for the above, I will use the (upcoming or perhaps we have already seen it?) top in the general stock market as the starting point for the three-month countdown. The reason is that after the 1929 top, gold miners declined for about three months after the general stock market started to slide. We also saw some confirmations of this theory based on the analogy to 2008. All in all, the precious metals sector is likely to bottom about three months after the general stock market tops. The additional confirmation will come from the tapering schedule, as markets are likely to move on the rumor and reverse on the fact as they tend to do in general.
- The above is based on the information available today, and it might change in the following days/weeks.
You will find my general overview of the outlook for gold on the chart below:
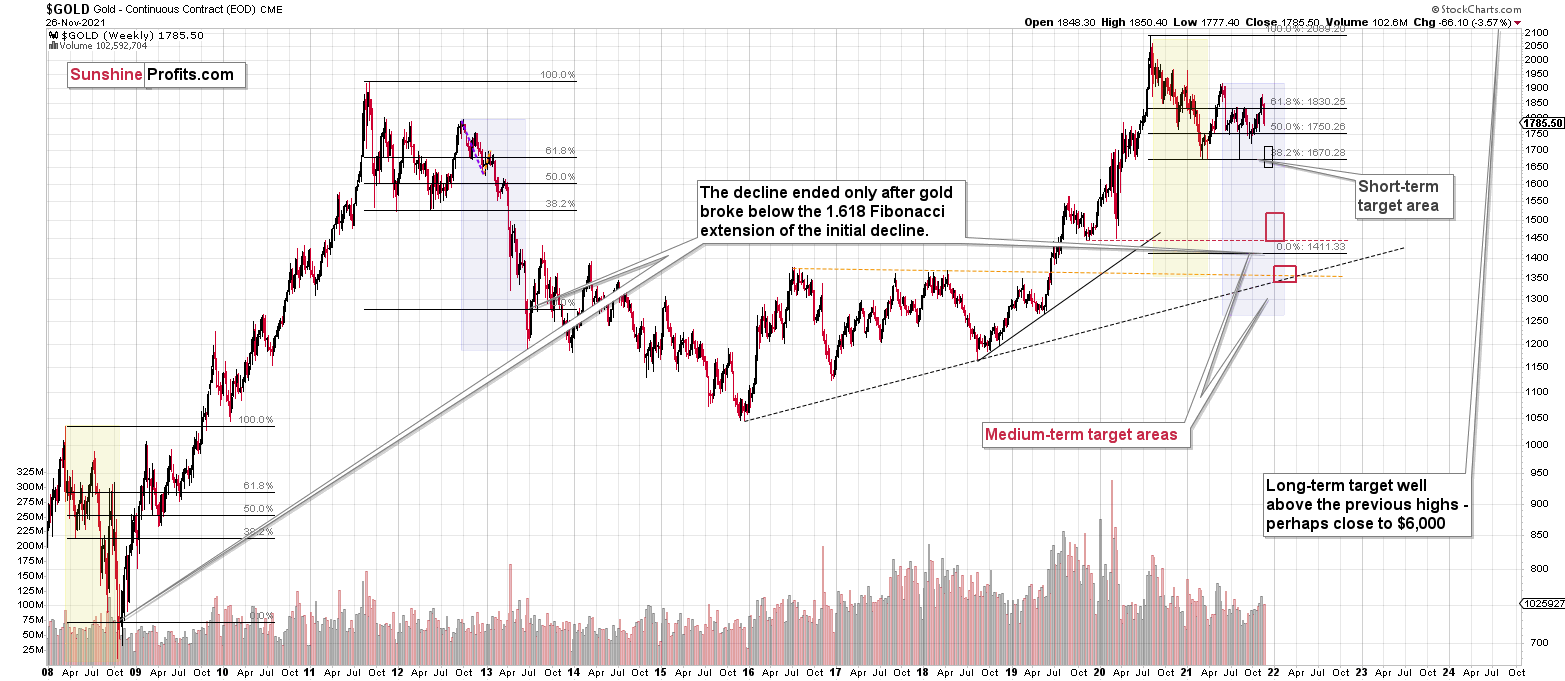
Please note that the above timing details are relatively broad and “for general overview only” – so that you know more or less what I think and how volatile I think the moves are likely to be – on an approximate basis. These time targets are not binding or clear enough for me to think that they should be used for purchasing options, warrants or similar instruments.
Letters to the Editor
Q: Well done folks on calling the current moves almost perfectly in the PMs.
A small price question:
You are calling a short-term bottom around the year’s low of about $1683 for gold, and that is your indicative current take-profit level.
However, in Silver and the GDXJ, your current take-profit levels seem to be below this year's lows. I have Silver (trading CFDs) low at $21.41 versus your take-profit level of $19.12. I understand that the instrument may be slightly different. However, the GDXJ lows this year are of $37.12 versus your lower take-profit level of $35.73.
Is there any particular reason for both silver and the GDXJ take-profit levels to be set below the year’s lows? I realize that I am talking about the very short term and not your bigger move down, which I guess is more like $23 for the GDXJ and $13 for silver.
A: Thanks! Yes, the reason for the downside targets being lower in the case of miners and silver than in the case of gold is that mining stocks’ and silver’s underperformance of gold is a part of the forecast. Also, please note that the GDX, the GDXJ, and silver are all closer to their 2021 lows than to their November high, while gold is trading more or less halfway between the above-mentioned extremes.
Another way to look at it: if gold doubles its recent decline, it will approximately reach its 2021 lows. If miners and silver double their recent decline, they will decline below their 2021 lows.
If the general stock market declines (which seems likely), then miners and silver are likely to be more affected than gold, which would also fit the above narrative.
Q: I found one tool to short junior miners so far, the JDST (Direction Daily Junior Gold Miners Index Bear 2x Shares). Have you ever used it? If not, what other tool (or tools) do you use?
A: Yes, for example, I’m using the JDST right now. Please note that it’s a leveraged instrument (2x), and leverage might be dangerous for less-experienced traders/investors. Simply shorting the GDXJ is an unleveraged alternative. This is not investment advice, just my opinion/information.
Summary
Summing up, gold declined in tune with my long-term-based indications, and the medium-term downtrend appears to have resumed. Based on the analogy to 2013 and other factors, a bigger decline in gold appears to be just around the corner (regardless of what happens in the very near term).
If the new Covid-19 variant makes the vaccine rather useless, we might be in for very wild price moves in most markets. In the case of the precious metals sector, the initial move should be to the downside, but at the same time, it makes the long-term outlook even more bullish.
It seems that we might see a short-term bottom close to the middle of December, and perhaps that’s when gold will move to its previous 2021 lows. However, I don’t think that it would be the final bottom. Conversely, it seems that the final bottom would form lower after a short-term correction (from the above-mentioned December lows).
From the medium-term point of view, the key two long-term factors remain the analogy to 2013 in gold and the broad head and shoulders pattern in the HUI Index. They both suggest much lower prices ahead.
It seems that our profits from the short positions are going to become truly epic in the following months.
After the sell-off (that takes gold to about $1,350 - $1,500), I expect the precious metals to rally significantly. The final part of the decline might take as little as 1-5 weeks, so it's important to stay alert to any changes.
Most importantly, please stay healthy and safe. We made a lot of money last March and this March, and it seems that we’re about to make much more on the upcoming decline, but you have to be healthy to enjoy the results.
As always, we'll keep you - our subscribers - informed.
By the way, we’re currently providing you with the possibility to extend your subscription by a year, two years or even three years with a special 20% discount. This discount can be applied right away, without the need to wait for your next renewal – if you choose to secure your premium access and complete the payment upfront. The boring time in the PMs is definitely over, and the time to pay close attention to the market is here. Naturally, it’s your capital, and the choice is up to you, but it seems that it might be a good idea to secure more premium access now while saving 20% at the same time. Our support team will be happy to assist you in the above-described upgrade at preferential terms – if you’d like to proceed, please contact us.
To summarize:
Trading capital (supplementary part of the portfolio; our opinion): Full speculative short positions (300% of the full position) in junior mining stocks are justified from the risk to reward point of view with the following binding exit profit-take price levels:
Mining stocks (price levels for the GDXJ ETF): binding profit-take exit price: $35.73; stop-loss: none (the volatility is too big to justify a stop-loss order in case of this particular trade)
Alternatively, if one seeks leverage, we’re providing the binding profit-take levels for the JDST (2x leveraged) and GDXD (3x leveraged – which is not suggested for most traders/investors due to the significant leverage). The binding profit-take level for the JDST: $16.18; stop-loss for the JDST: none (the volatility is too big to justify a SL order in case of this particular trade); binding profit-take level for the GDXD: $32.08; stop-loss for the GDXD: none (the volatility is too big to justify a SL order in case of this particular trade).
For-your-information targets (our opinion; we continue to think that mining stocks are the preferred way of taking advantage of the upcoming price move, but if for whatever reason one wants / has to use silver or gold for this trade, we are providing the details anyway.):
Silver futures downside profit-take exit price: $19.12
SLV profit-take exit price: $17.72
ZSL profit-take exit price: $41.38
Gold futures downside profit-take exit price: $1,683
HGD.TO – alternative (Canadian) inverse 2x leveraged gold stocks ETF – the upside profit-take exit price: $12.48
HZD.TO – alternative (Canadian) inverse 2x leveraged silver ETF – the upside profit-take exit price: $30.48
Long-term capital (core part of the portfolio; our opinion): No positions (in other words: cash
Insurance capital (core part of the portfolio; our opinion): Full position
Whether you already subscribed or not, we encourage you to find out how to make the most of our alerts and read our replies to the most common alert-and-gold-trading-related-questions.
Please note that we describe the situation for the day that the alert is posted in the trading section. In other words, if we are writing about a speculative position, it means that it is up-to-date on the day it was posted. We are also featuring the initial target prices to decide whether keeping a position on a given day is in tune with your approach (some moves are too small for medium-term traders, and some might appear too big for day-traders).
Additionally, you might want to read why our stop-loss orders are usually relatively far from the current price.
Please note that a full position doesn't mean using all of the capital for a given trade. You will find details on our thoughts on gold portfolio structuring in the Key Insights section on our website.
As a reminder - "initial target price" means exactly that - an "initial" one. It's not a price level at which we suggest closing positions. If this becomes the case (like it did in the previous trade), we will refer to these levels as levels of exit orders (exactly as we've done previously). Stop-loss levels, however, are naturally not "initial", but something that, in our opinion, might be entered as an order.
Since it is impossible to synchronize target prices and stop-loss levels for all the ETFs and ETNs with the main markets that we provide these levels for (gold, silver, and mining stocks - the GDX ETF), the stop-loss levels and target prices for other ETNs and ETF (among other: UGL, GLL, AGQ, ZSL, NUGT, DUST, JNUG, JDST) are provided as supplementary, and not as "final". This means that if a stop-loss or a target level is reached for any of the "additional instruments" (GLL for instance), but not for the "main instrument" (gold in this case), we will view positions in both gold and GLL as still open and the stop-loss for GLL would have to be moved lower. On the other hand, if gold moves to a stop-loss level but GLL doesn't, then we will view both positions (in gold and GLL) as closed. In other words, since it's not possible to be 100% certain that each related instrument moves to a given level when the underlying instrument does, we can't provide levels that would be binding. The levels that we do provide are our best estimate of the levels that will correspond to the levels in the underlying assets, but it will be the underlying assets that one will need to focus on regarding the signs pointing to closing a given position or keeping it open. We might adjust the levels in the "additional instruments" without adjusting the levels in the "main instruments", which will simply mean that we have improved our estimation of these levels, not that we changed our outlook on the markets. We are already working on a tool that would update these levels daily for the most popular ETFs, ETNs and individual mining stocks.
Our preferred ways to invest in and to trade gold along with the reasoning can be found in the how to buy gold section. Furthermore, our preferred ETFs and ETNs can be found in our Gold & Silver ETF Ranking.
As a reminder, Gold & Silver Trading Alerts are posted before or on each trading day (we usually post them before the opening bell, but we don't promise doing that each day). If there's anything urgent, we will send you an additional small alert before posting the main one.
Thank you.
Przemyslaw Radomski, CFA
Founder, Editor-in-chief

