

Briefly: In our opinion, full (200% of the regular size of the position) speculative short positions in gold, silver and mining stocks are justified from the risk/reward perspective at the moment of publishing this alert.
Taking on the biggest short position ever based on the Jan 26th session certainly proved to be a good and profitable idea, especially in the case of silver and mining stocks. However, it doesn’t mean that the precious metals sector is going to decline indefinitely – there will be a major bottom and even before it is seen, there will be corrective upswings along the way. Some of them will be very tradable opportunities to increase the profits. Where’s the best nearby opportunity to switch from short to long positions?
As you might expect, the answer to this question is not that simple as there are many factors that are involved. Let’s start with the thing that could trigger a rally in gold.
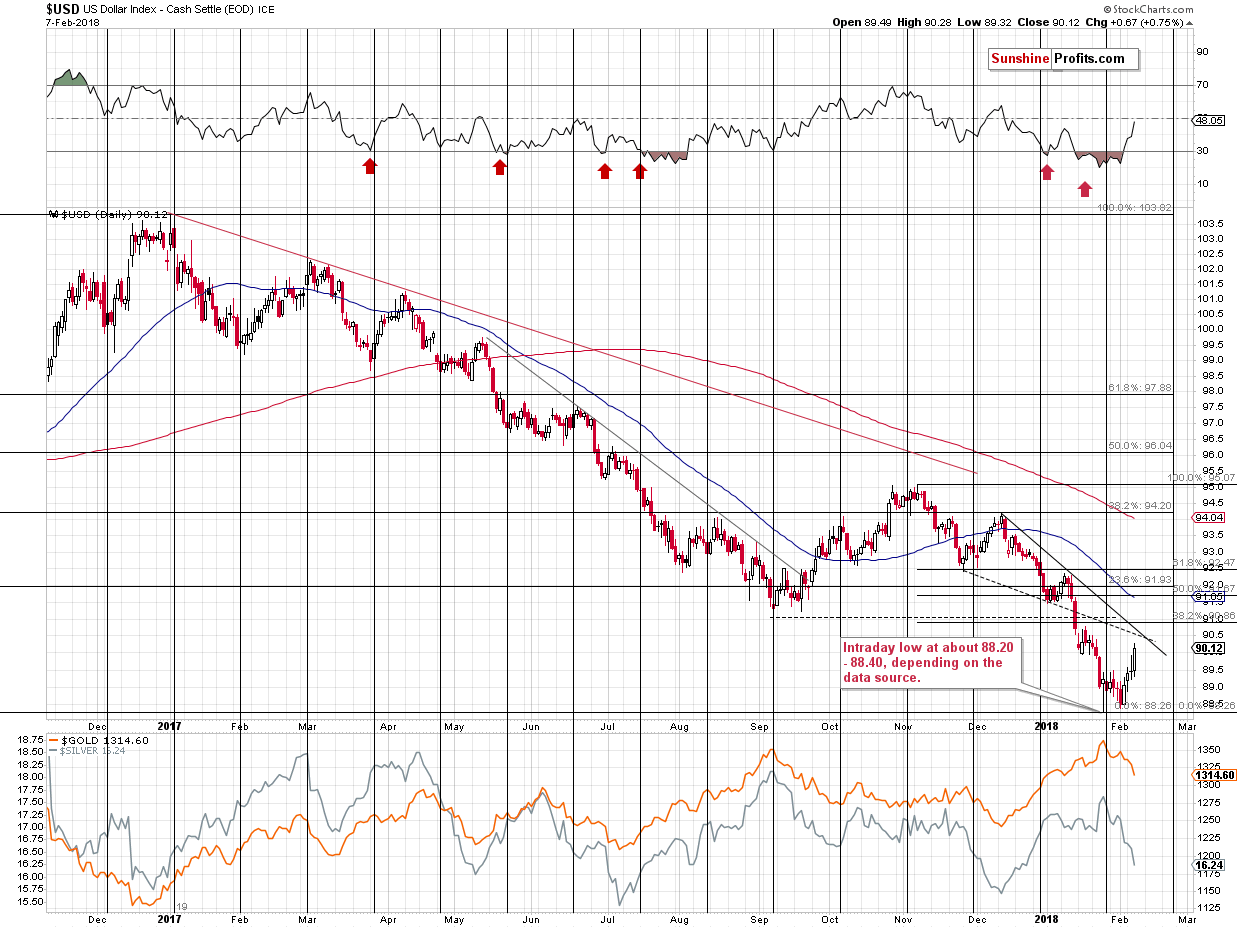
The USD Index moved higher this month and invalidated a small breakdown below the previous extremes. This makes the outlook very bullish for the following weeks. However, it doesn’t mean that there will be no pullbacks during the rally. There are several reasons for the USD Index to take a breather relatively soon:
- Declining solid resistance line.
- Declining dashed resistance line.
- 38.2% Fibonacci retracement based on the November – February decline.
- September 2017 bottom.
They all coincide in the 90.5 – 91 area, so that’s where we might see a consolidation. After a decline that was so huge as the recent one, it doesn’t seem that it will be anything major. Even if the USD Index is not moving above the 2017 high (and this seems quite likely), then the corrective upswing that should follow a yearly decline should be bigger than just a few-index-points upswing.
If the decline is not going to be big, then why should we – precious metals investors and traders – care?
Because if the PMs and miners get ahead of themselves during the current decline, then a brief pause in the USD may be enough to trigger a visible corrective upswing. For instance, in early October 2017, the USD Index moved lower for just a few days, but that was enough to trigger about a $30 upswing in gold and a comparatively bigger rally in silver. The current slide in gold and silver is even sharper than the September – October one, so metals might be even more inclined to correct in a visible manner if the USD triggers such a move.
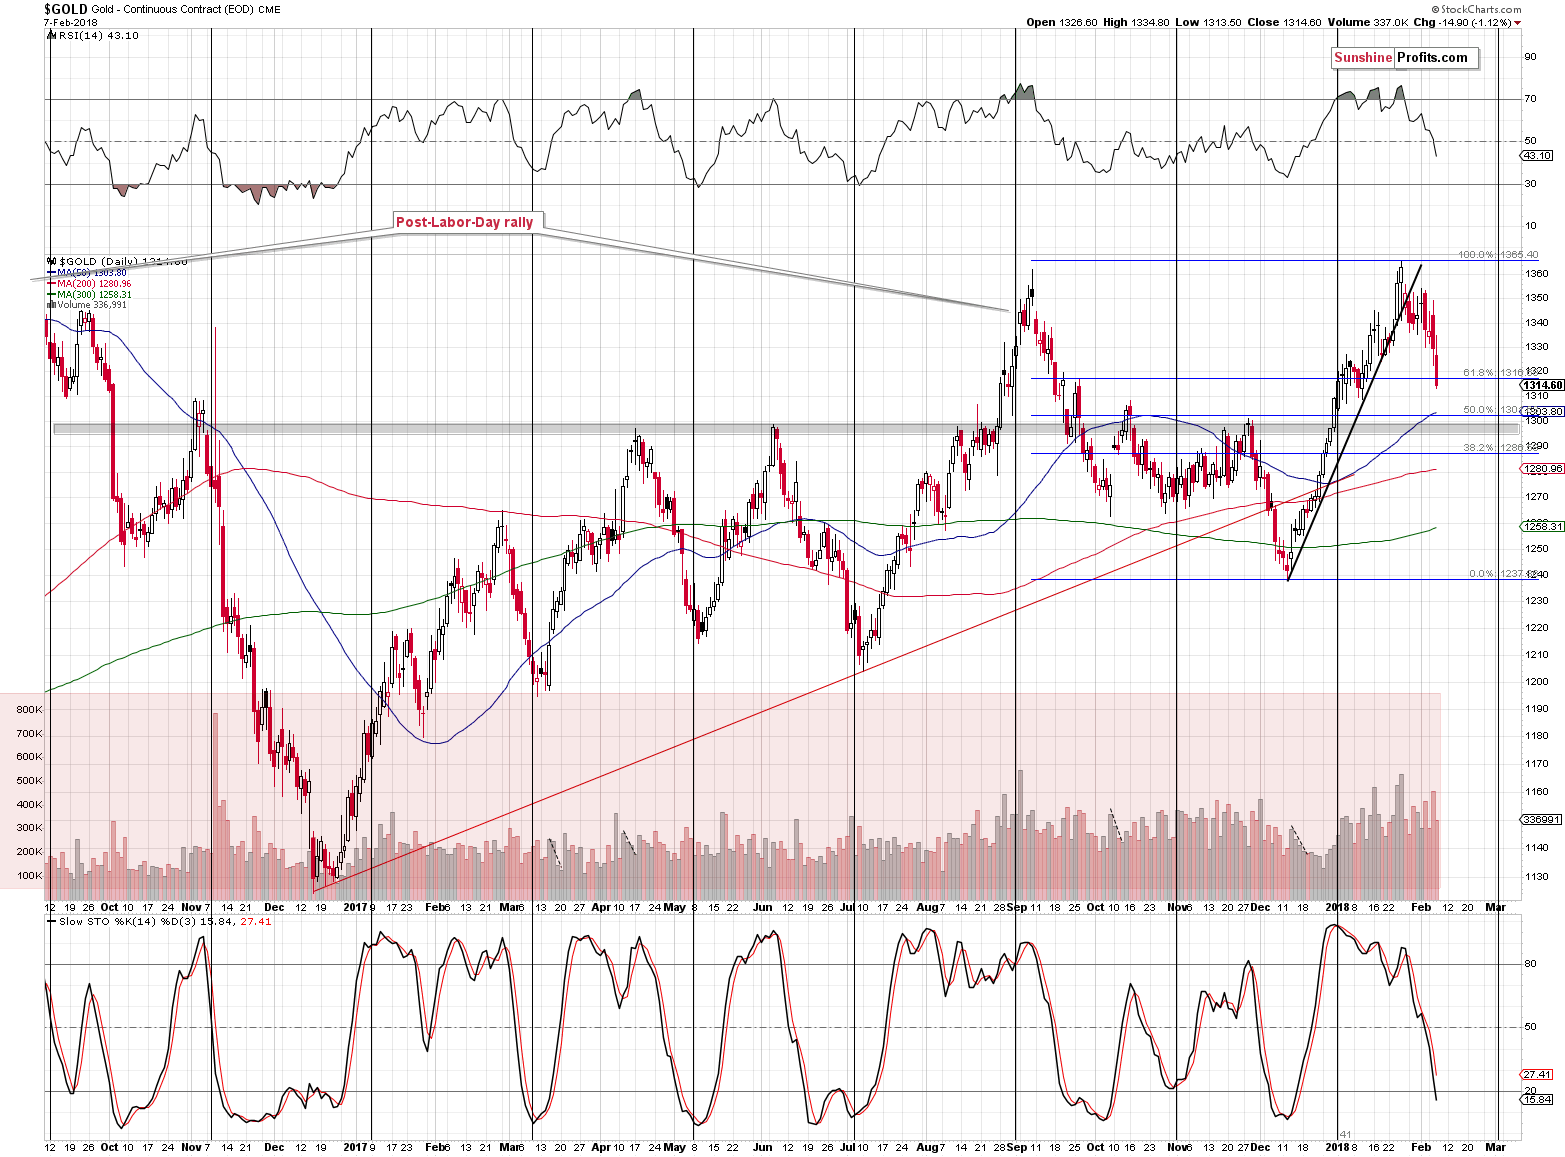
The price of gold is approaching the $1,300 level, which served as resistance quite a few times. It was not as useful as a support level, but still, it’s something that we should keep in mind.
We marked the area that stopped gold’s price moves with a grey rectangle – it starts at about $1,300 and reaches about $5 below this level.
The 50-day moving average is also close to $1,300, which strengthens this level as potential support. However, this moving average worked on a near-to basis more than on an exact basis, so we could easily see a move to $1,286 or so before the bottom is in, and that would still be in tune with the mentioned MA.
Finally, the 50% and 61.8% Fibonacci retracements are just above $1,300 and at $1,286, respectively. The first one strengthens the theory according to which gold corrects from about $1,300, while the latter provides the next support if $1,300 fails to hold.
The Stochastic indicator moved below 30, which suggests that we should be prepared for a rebound, but it’s not a buy signal on its own.
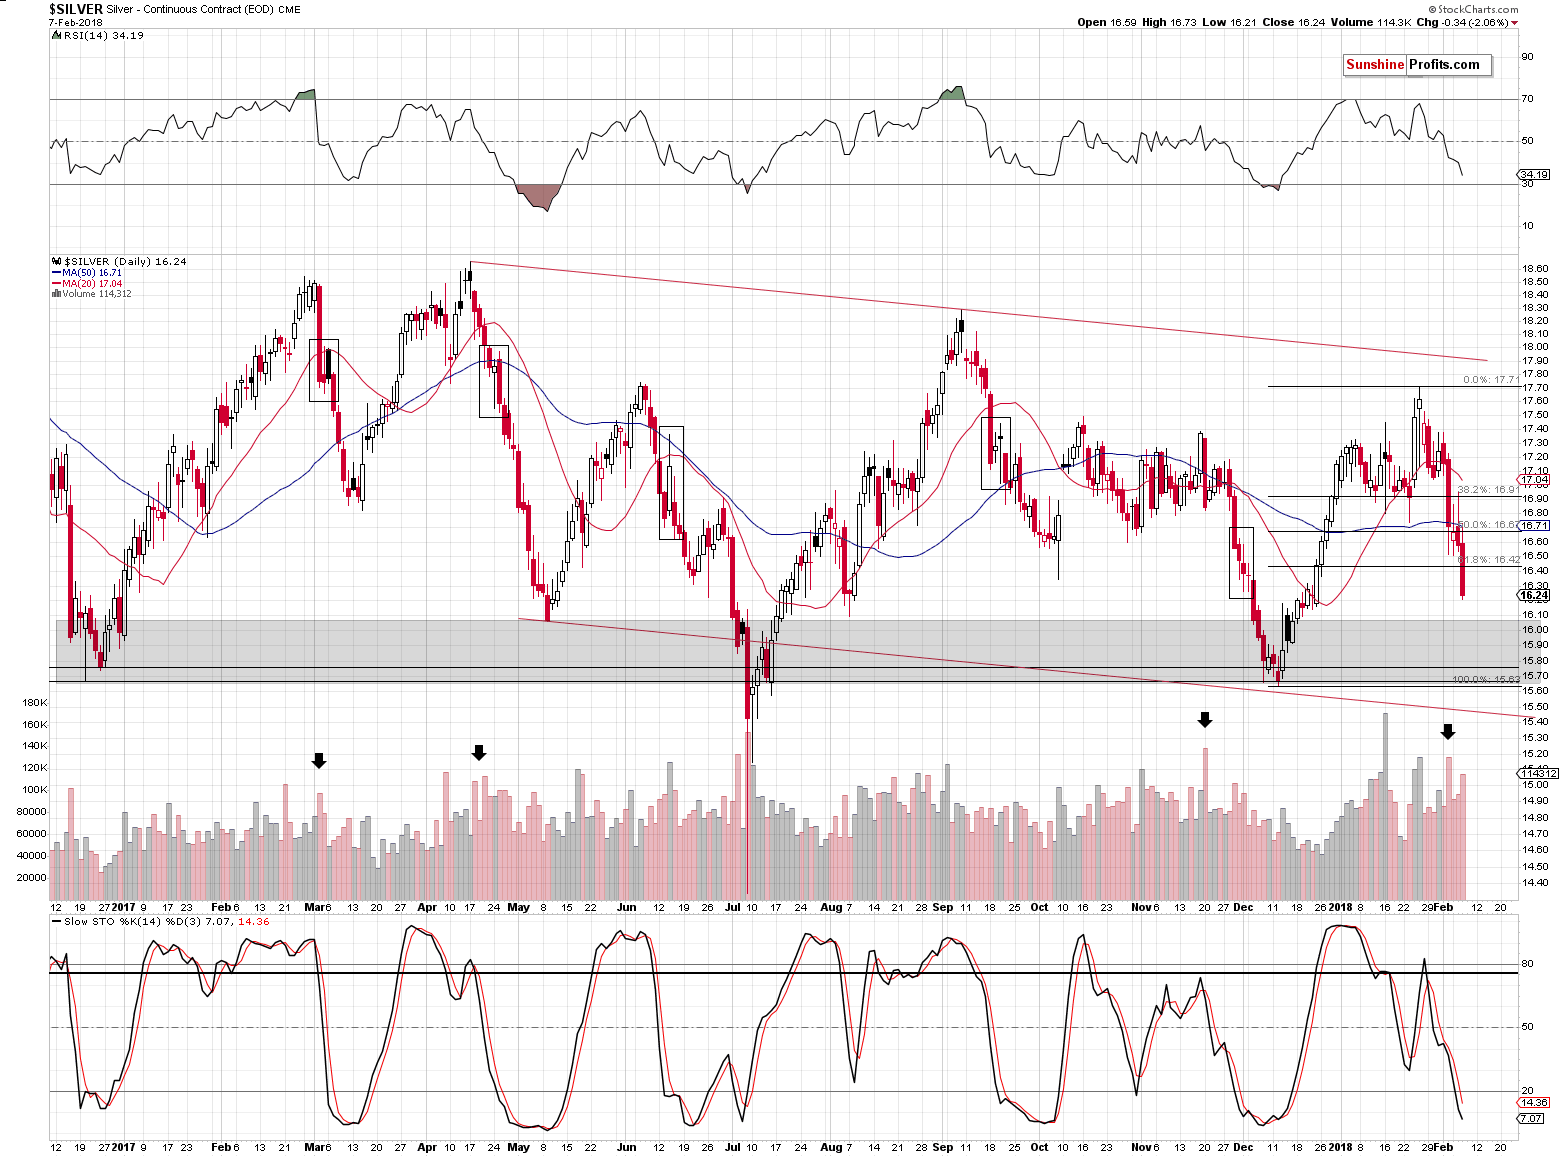
In the case of silver, the grey area is larger as the differences between previous price extremes are wider as well. Silver has already broken below the 61.8% Fibonacci retracement, which is a very bearish sign. It seems that the white metal wants to move lower before even a local bottom is seen. Where will it be? Most likely within the grey rectangle – between $15.65 and $16.05.
In yesterday’s alert, we discussed the short- and medium-term outlook for mining stocks in greater detail, so today’ we’ll focus on the nearby target and the way the action in mining stocks could be useful as a signal.
Let’s start with a quote from yesterday’s alert:
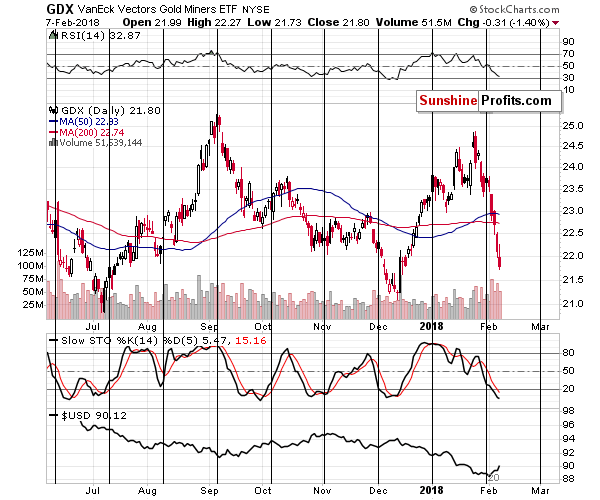
Still, let’s keep in mind that if the current bearish momentum persists, mining stocks will reach their 2017 lows very soon. The RSI indicator is already close to the 30 level and since reaching it is a classic buy signal for the short term, we may see at least a corrective upswing soon.
Overall, based on the previous two charts, it seems that we may indeed see a corrective upswing once miners move to (or very close to) their 2017 lows, but it’s not likely that the upcoming rally will be anything significant.
The move may or may not be tradable and it will depend to a large extent on the way in which the previous lows (natural support) are reached and what action accompanies these moves in gold, silver, the general stock market and the USD Index.
If the miners decline in a sharp manner, but reverse in a visible way, while gold and the main stock indices decline further, then it will be a very good indication that the upcoming correction might be something worth betting on. In other cases, it will not be as clear. It’s not possible to list out every scenario that could take place, but if, in contrast to the mentioned possibility, mining stocks continue to magnify gold’s declines regardless of the main stock indices’ performance, then we’ll most likely keep the short position intact, even if gold moves to $1,300 or so.
Normally, the situation regarding gold stocks is quite clear – if they stop reacting to gold’s movement, then something is likely to change. However, at this time, the situation is not normal due to the stock market’s substantial decline in the previous days. If stocks move higher, it could result in the mining stocks’ “strength” relative to gold, which would not imply any real strength, just it’s imitation, as the real reason behind it would be outside of the precious metals sector.
Before summarizing, let’s take a look at gold once again, but this time, focusing on a broader perspective and two indicators that provide highly effective medium-term signals.
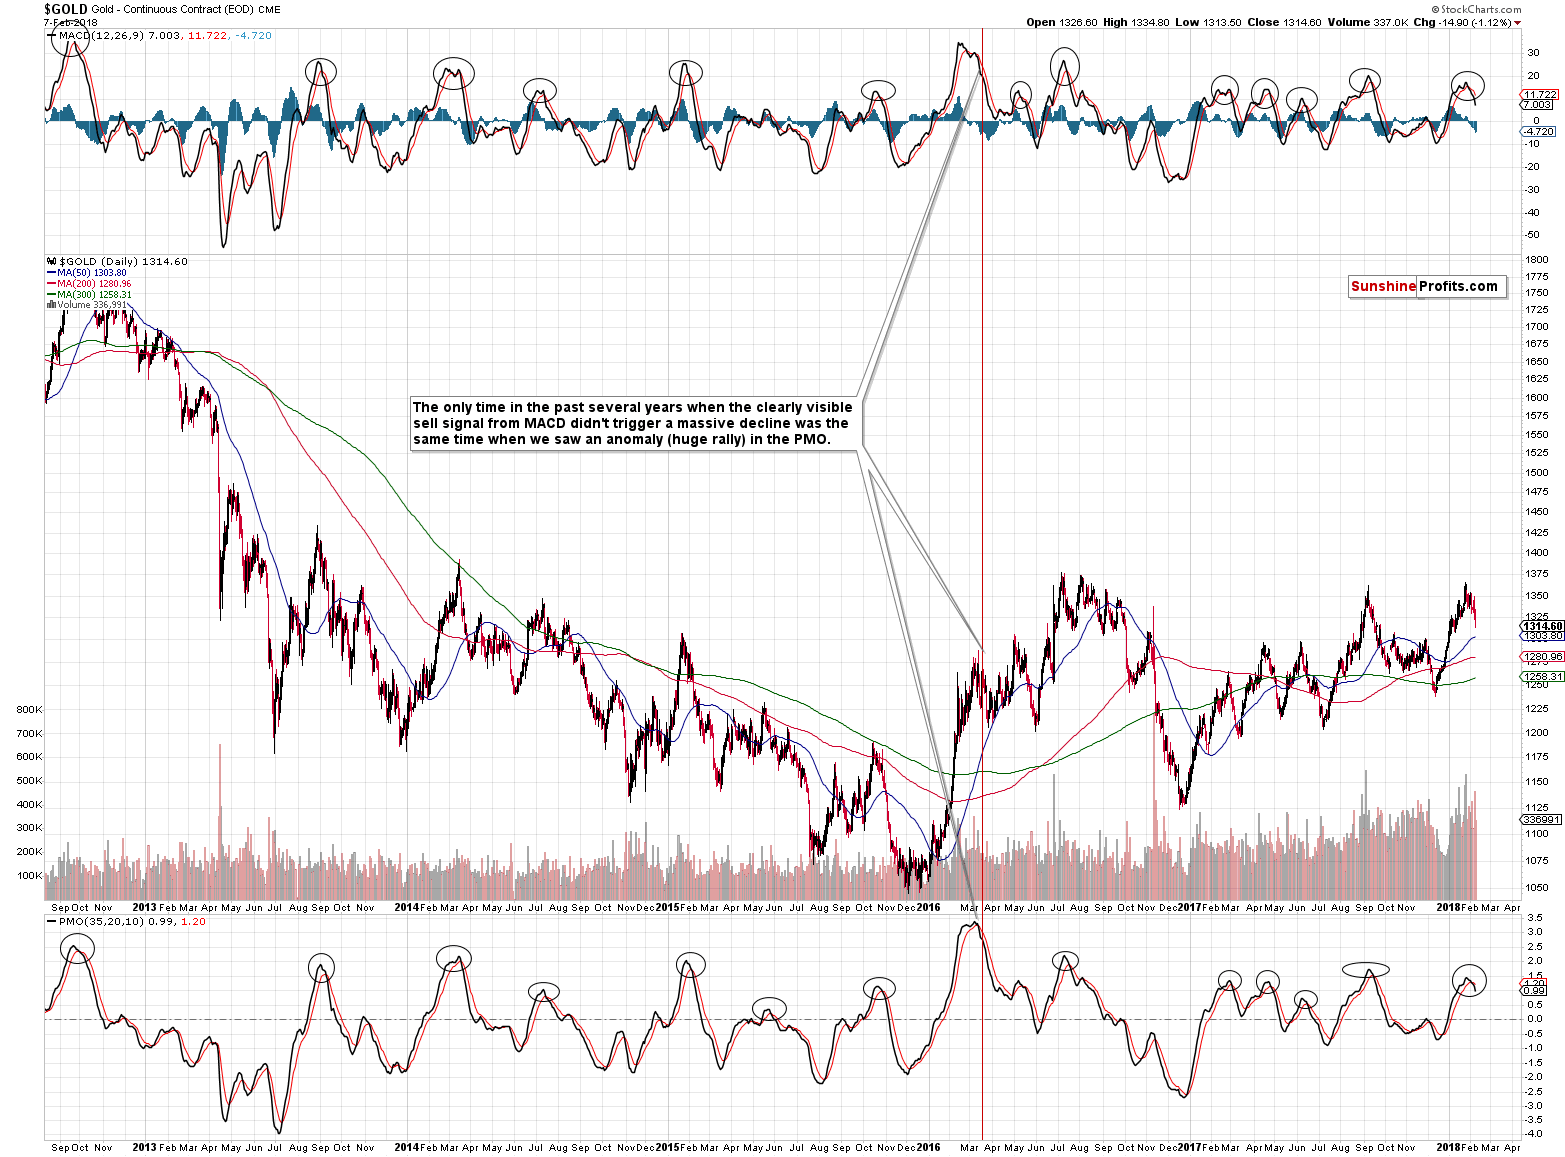
Both indicators (MACD and PMO) flash sell signals when black lines move below the red lines. If they are visibly above the middle of their trading ranges, the efficiency of the signal increases.
We marked those highly efficient signals from both indicators with black ellipses. How many of those ellipses turned out to be major shorting opportunities that followed major medium-term tops? All of them, except for the early 2016 top. It’s easy to spot it as an outlier because both indicators were sharply higher at that time. In all other cases, the implications for the following weeks and months were very bearish. Both indicators flashed sell signals while they were at normal levels. The implications are definitely bearish.
Summing up, there are multiple reasons to expect lower precious metals prices in the coming weeks and months and we covered some of them in the previous alerts and some of them in today’s alert (the PMO and MACD sell signals), which implies that there have to be very good reasons to trade against this medium-term trend. There are resistance (USD) and support levels not too far away (gold at about $1,300 and silver at and a little below $16), but it’s not yet clear if it will be worth it to adjust the short position based on them. If we see meaningful signs of strength – for instance, if gold refuses to decline despite the USD’s rally and/or miners refuse to decline even though gold declined, we might exit the short position or even enter a long one. It seems to early to do so at this time – the risk of missing the continuation of the decline seems too big.
As always, we will keep you – our subscribers – informed.
To summarize:
Trading capital (supplementary part of the portfolio; our opinion): Full short positions (200% of the full position) in gold, silver and mining stocks are justified from the risk/reward perspective with the following stop-loss orders and initial target price levels:
- Gold: initial target price: $1,218; stop-loss: $1,382; initial target price for the DGLD ETN: $53.98; stop-loss for the DGLD ETN $37.68
- Silver: initial target price: $14.63; stop-loss: $17.82; initial target price for the DSLV ETN: $33.88; stop-loss for the DSLV ETN $20.88
- Mining stocks (price levels for the GDX ETF): initial target price: $19.22; stop-loss: $26.14; initial target price for the DUST ETF: $39.88; stop-loss for the DUST ETF $15.78
In case one wants to bet on junior mining stocks' prices (we do not suggest doing so – we think senior mining stocks are more predictable in the case of short-term trades – if one wants to do it anyway, we provide the details), here are the stop-loss details and initial target prices:
- GDXJ ETF: initial target price: $27.82; stop-loss: $38.22
- JDST ETF: initial target price: $94.88 stop-loss: $37.78
Long-term capital (core part of the portfolio; our opinion): No positions (in other words: cash)
Insurance capital (core part of the portfolio; our opinion): Full position
Important Details for New Subscribers
Whether you already subscribed or not, we encourage you to find out how to make the most of our alerts and read our replies to the most common alert-and-gold-trading-related-questions.
Please note that the in the trading section we describe the situation for the day that the alert is posted. In other words, it we are writing about a speculative position, it means that it is up-to-date on the day it was posted. We are also featuring the initial target prices, so that you can decide whether keeping a position on a given day is something that is in tune with your approach (some moves are too small for medium-term traders and some might appear too big for day-traders).
Plus, you might want to read why our stop-loss orders are usually relatively far from the current price.
Please note that a full position doesn’t mean using all of the capital for a given trade. You will find details on our thoughts on gold portfolio structuring in the Key Insights section on our website.
As a reminder – “initial target price” means exactly that – an “initial” one, it’s not a price level at which we suggest closing positions. If this becomes the case (like it did in the previous trade) we will refer to these levels as levels of exit orders (exactly as we’ve done previously). Stop-loss levels, however, are naturally not “initial”, but something that, in our opinion, might be entered as an order.
Since it is impossible to synchronize target prices and stop-loss levels for all the ETFs and ETNs with the main markets that we provide these levels for (gold, silver and mining stocks – the GDX ETF), the stop-loss levels and target prices for other ETNs and ETF (among other: UGLD, DGLD, USLV, DSLV, NUGT, DUST, JNUG, JDST) are provided as supplementary, and not as “final”. This means that if a stop-loss or a target level is reached for any of the “additional instruments” (DGLD for instance), but not for the “main instrument” (gold in this case), we will view positions in both gold and DGLD as still open and the stop-loss for DGLD would have to be moved lower. On the other hand, if gold moves to a stop-loss level but DGLD doesn’t, then we will view both positions (in gold and DGLD) as closed. In other words, since it’s not possible to be 100% certain that each related instrument moves to a given level when the underlying instrument does, we can’t provide levels that would be binding. The levels that we do provide are our best estimate of the levels that will correspond to the levels in the underlying assets, but it will be the underlying assets that one will need to focus on regarding the signs pointing to closing a given position or keeping it open. We might adjust the levels in the “additional instruments” without adjusting the levels in the “main instruments”, which will simply mean that we have improved our estimation of these levels, not that we changed our outlook on the markets. We are already working on a tool that would update these levels on a daily basis for the most popular ETFs, ETNs and individual mining stocks.
Our preferred ways to invest in and to trade gold along with the reasoning can be found in the how to buy gold section. Additionally, our preferred ETFs and ETNs can be found in our Gold & Silver ETF Ranking.
As a reminder, Gold & Silver Trading Alerts are posted before or on each trading day (we usually post them before the opening bell, but we don't promise doing that each day). If there's anything urgent, we will send you an additional small alert before posting the main one.
=====
Latest Free Trading Alerts:
Until recently, the financial press was reporting confidence in the global economy in 2018. Participants at the World Economic Forum in Davos were full of optimism and they outdid each other in upgrading their forecasts. One week later, the global stock market plunged, making analysts stupefied. “As equities tumbled, gold should shine”, almost everyone thought. But that’s not what we saw. What really happened, then?
Three Truths about Stock Market Sell-Off Gold Investors Should Know
S&P 500 index lost 0.5% on Wednesday, as it slightly extended its upward correction following recent move down. Stocks retraced their unprecedented month-long rally, as investors were selling stocks in panic. The index was losing almost 10% vs. its late January record high on Tuesday, just before bouncing off support level at 2,600. Is this sell-off the beginning of some new medium-term downtrend or just downward correction? It's hard to say, but this move down set the negative tone for weeks or months to come.
Stocks Slip As Rebound Falters, More Volatility Ahead
=====
Hand-picked precious-metals-related links:
PRECIOUS-Gold hits 4-wk low on firmer dollar amid U.S. rate hike views
Goldman Sachs boosts gold price forecast, sees $1,450/oz in 12 months
Arizona’s newest gold mine just weeks away of first pour
=====
In other news:
Shares fragile, U.S. budget deal puts bonds on defensive
Fed likely to continue raising rates: Kaplan
Bank of England Set to Hike Rates Earlier Than Expected
EU doubts 2020 Brexit vision, sees longer goodbye
VIX May Form the ‘Mother of All Inverted Vs’
Greece Takes Step to Normalcy With Bond as Bailout Nears End
ECB Wakes Up to Bitcoin as Virtual World Touches Reality
One Of The Creators Of The VXX Explains The Problem With Many Volatility Products
=====
Thank you.
Sincerely,
Przemyslaw Radomski, CFA
Founder, Editor-in-chief, Gold & Silver Fund Manager
Gold & Silver Trading Alerts
Forex Trading Alerts
Oil Investment Updates
Oil Trading Alerts

