

Briefly: In our opinion, full (100% of the regular size of the position) speculative short positions in gold, silver and mining stocks are justified from the risk/reward perspective at the moment of publishing this alert.
Remember how mining stocks soared on Valentine’s Day and how we wrote that a rally was not necessarily bullish? Guess what – this rally has been more than erased. Miners not only closed below the February 14th opening price, but also below the February 13th and 12th closing prices. The mining stocks’ big rally turned out to be nothing more than just a regular 50% retracement during a decline – something that we saw many times in the past and that we had described as likely. But, since the rally was rather inconsequential, then perhaps the decline is inconsequential as well?
Not likely.
It’s not likely because of the context. Gold is still relatively close to its recent high, but mining stocks are very close to their recent low. The latter are underperforming, and Valentine’s Day rally was just a verification of the breakdown in the HUI to gold ratio. Let’s take a look at the details, starting with the currency market (chart courtesy of http://stockcharts.com).
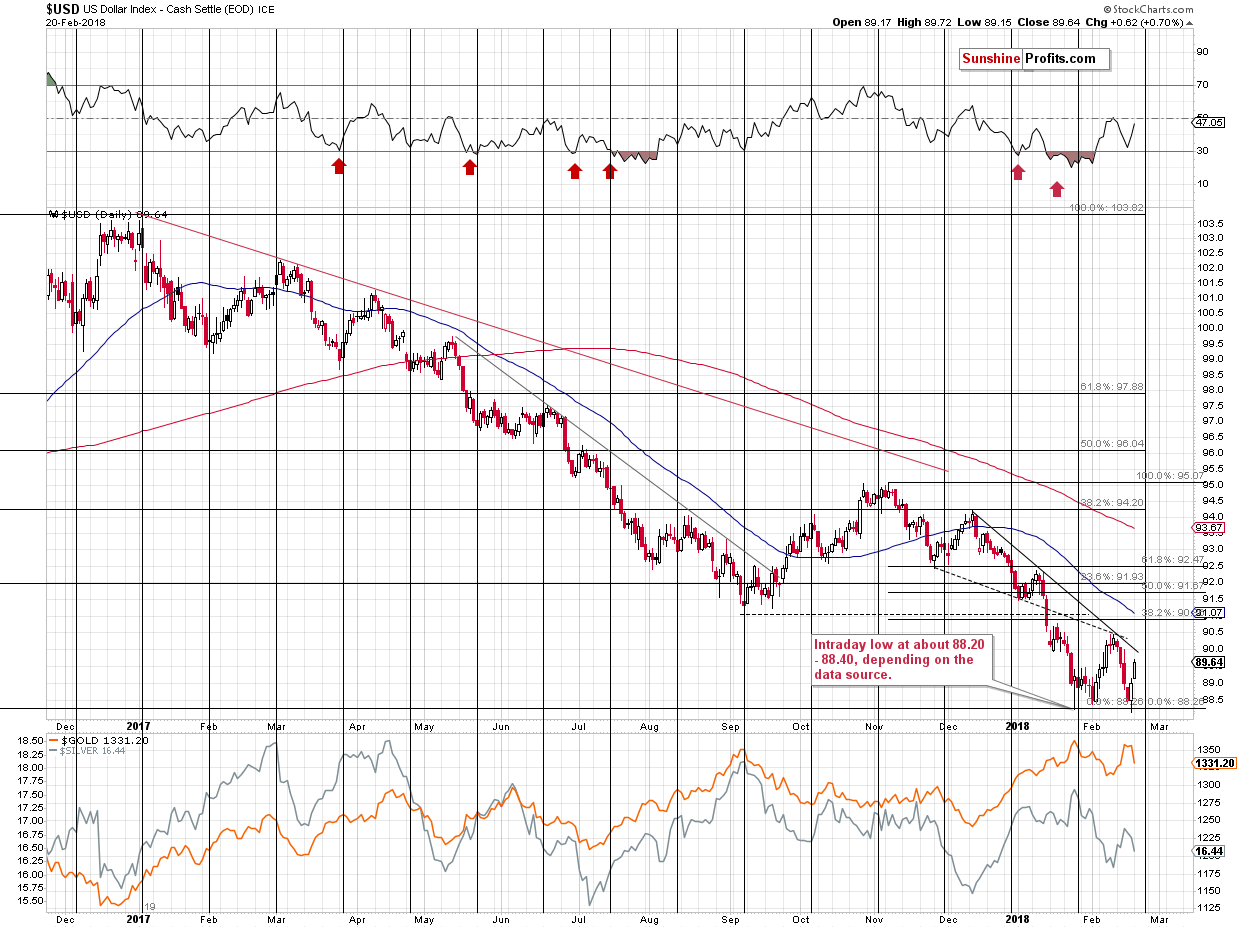
During Friday’s trading, the USD Index moved very insignificantly below the previous 2018 low and rallied back up, invalidating almost all breakdowns below important support levels. The remaining breakdown was invalidated yesterday in a clear way, so the outlook improved further.
The chart above shows how significant the mentioned support levels actually are. Key tops and key Fibonacci retracements based on the key price extremes. Each of them is important and their combination is even more important. The same goes for the invalidation of breakdowns – the implications are bullish.
Please note that earlier this year the USD Index broke below the declining support / resistance line based on the mid-2015 and 2016 lows and this breakdown was verified recently. This is a bearish technical development, however, the combination of the 2009 and 2010 tops along with 2 major retracements based on major extremes (marked in red and black on the above chart) is much stronger than the mentioned declining line. The reason is that the mid-2015 and 2016 lows are less prominent than the 2009 and 2010 tops and the line based on the former is not strengthened by key Fibonacci retracements, while the latter is.
Consequently, the invalidation of breakdowns below the key, long-term support levels is far more important than the declining shorter-term line. That’s why, all in all, the outlook is bullish, but not bearish. At the moment of writing these words, the USD Index is trading at 89.82, so it’s very close to the mentioned line – it could even be the case that USD breaks decisively above 90 (the mentioned line is currently a bit above 90) later today. Actually, we hope that the 90 level doesn’t give up without a fight, but we expect that whether it happens shortly or in a week or so, the decisive breakout above 90 will be seen followed by a bigger rally.
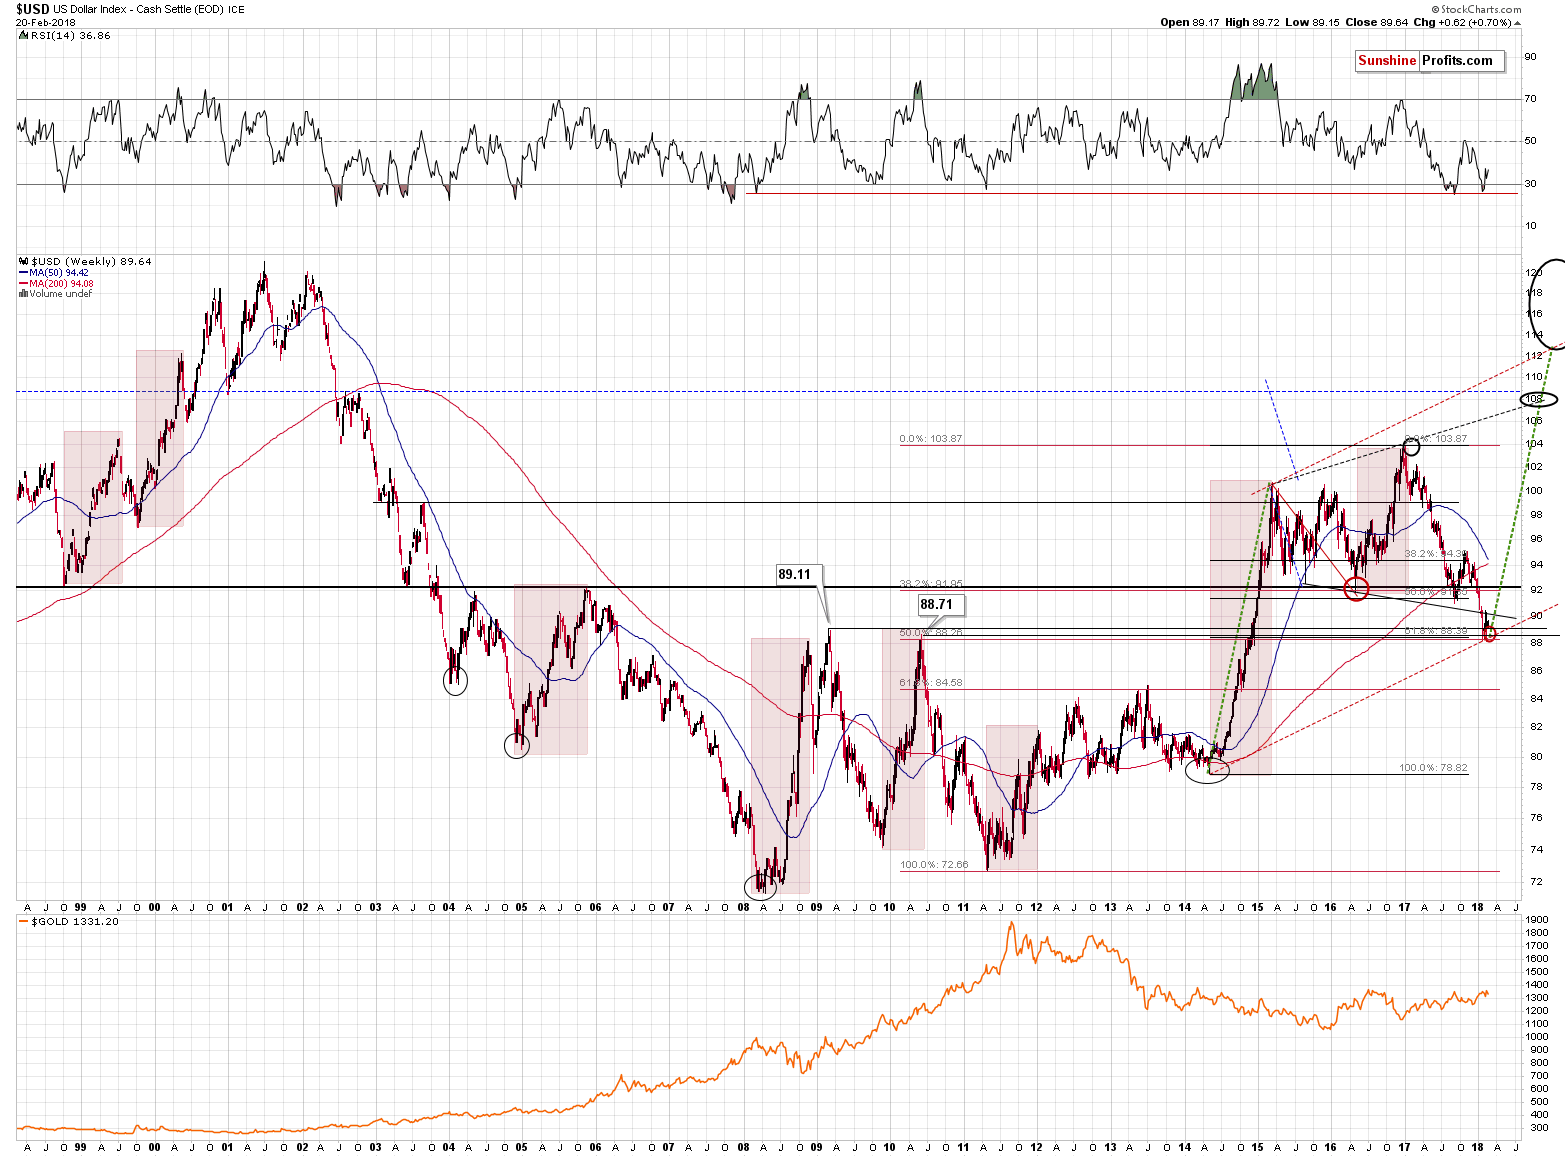
As we had indicated previously, it’s not just the entire USD Index’s picture that points to a reversal – one of its most important (the second most important) components is pointing to a reversal as well.
The Japanese yen reached a combination of strong resistance levels (the rising medium-term resistance line and the 61.8% Fibonacci retracement level), which is quite likely to trigger a reversal. Knowing that the Japanese yen and gold very often move in tandem suggests that precious metals have just formed a major top – just like the yen probably did.
Speaking of precious metals, let’s take a look at gold.
In yesterday’s alert, we warned that the previous move higher was not to be trusted:
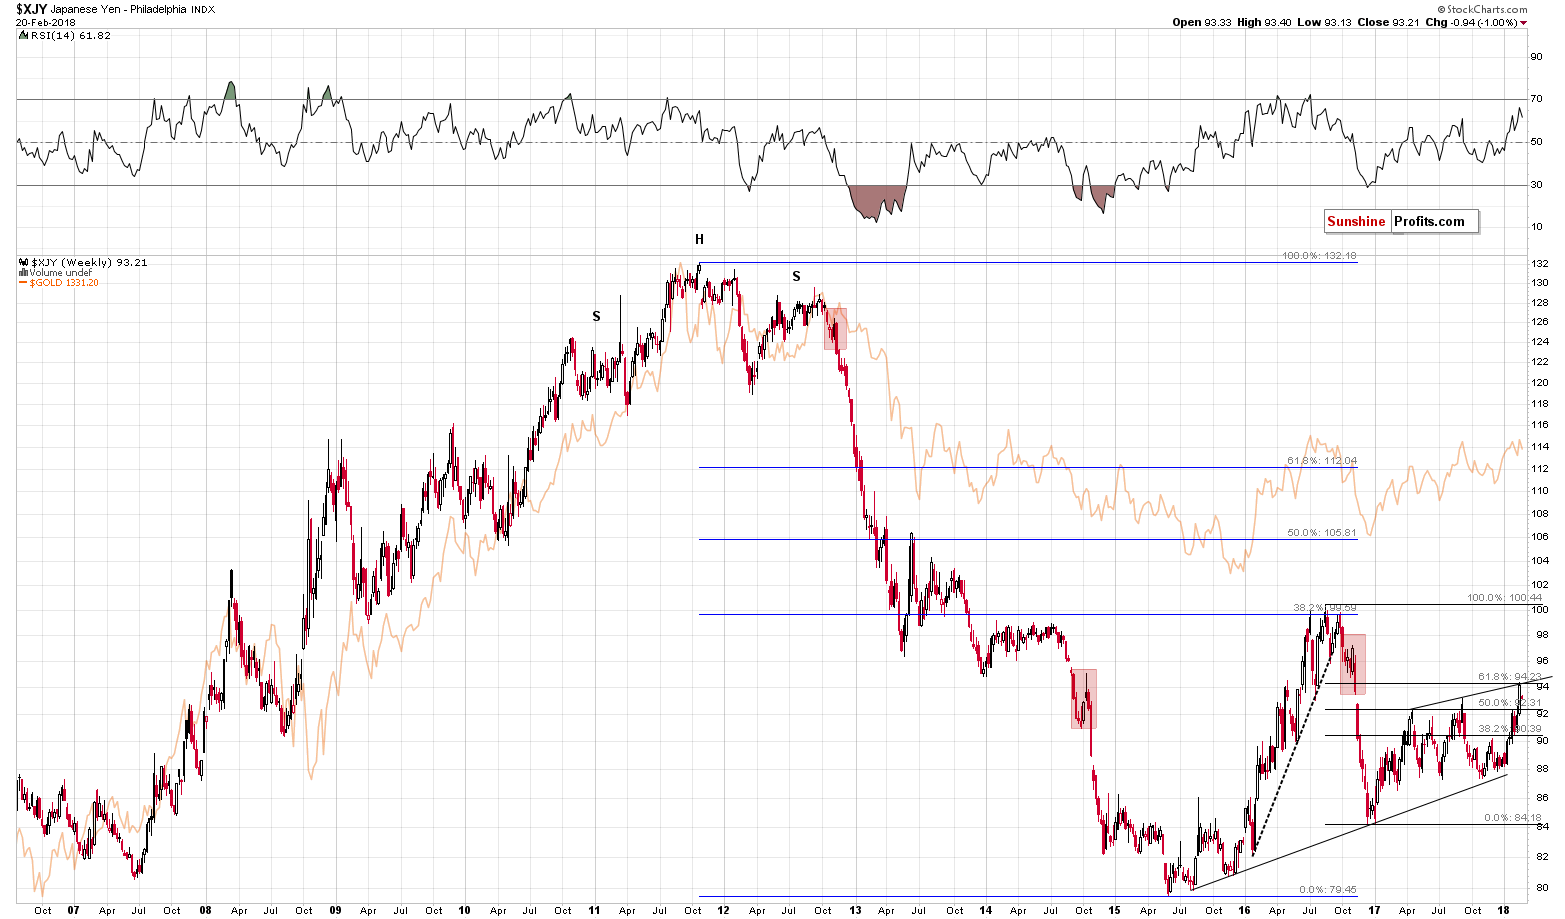
Gold, on the other hand, moved temporarily higher - to the September 2017 and January 2018 highs and then it reversed and - based on GLD and kitco's intraday data - declined. The reversal is not visible on the above Stockcharts' chart, but it should be. The implications are bearish and they seem to be already in play. Gold declined about $7 today and is currently at $1,339. This is the price level to which gold approximately (a little below $1,340) declined right after both the September 2017 high and the January 2018 high. The implications are bearish as gold declined more visibly in both past cases.
There was some back and forth movement close to the $1,335 in both cases, so we might also see the same here. This might serve as a chance for silver to shine and outperform gold during one of the daily upswings. If that happens, it could be the bearish confirmation that is needed for the short-term outlook to deteriorate further and for us to consider adding to our short positions (we previously cut it in half right after the Feb 9 bottom, taking some profits off the table).
Yesterday’s decline was much more volatile than the initial declines that followed the January 2018 and September 2017 tops, but this doesn’t change the possibility of seeing higher prices very temporarily before the slide continues. From September 14 to 15, gold rallied almost $20 before taking a plunge and from February 2 to 6, gold also rallied almost $20 before declining below $1,320. If we’re lucky, we could see the same kind of pattern shortly. At the moment of writing these words, the pre-market low is $1,325, so an analogous rally might take gold to about $1,345. This doesn’t make it a very likely upside target, but something that’s worth keeping in mind. If gold moves to this level, it will not be a bullish sign, but something in tune with the past – bearish – patterns.
But why do you hope for a fight for 90 in the USD Index and a temporary rebound in gold? Aren’t you guys bearish for the medium term after all?
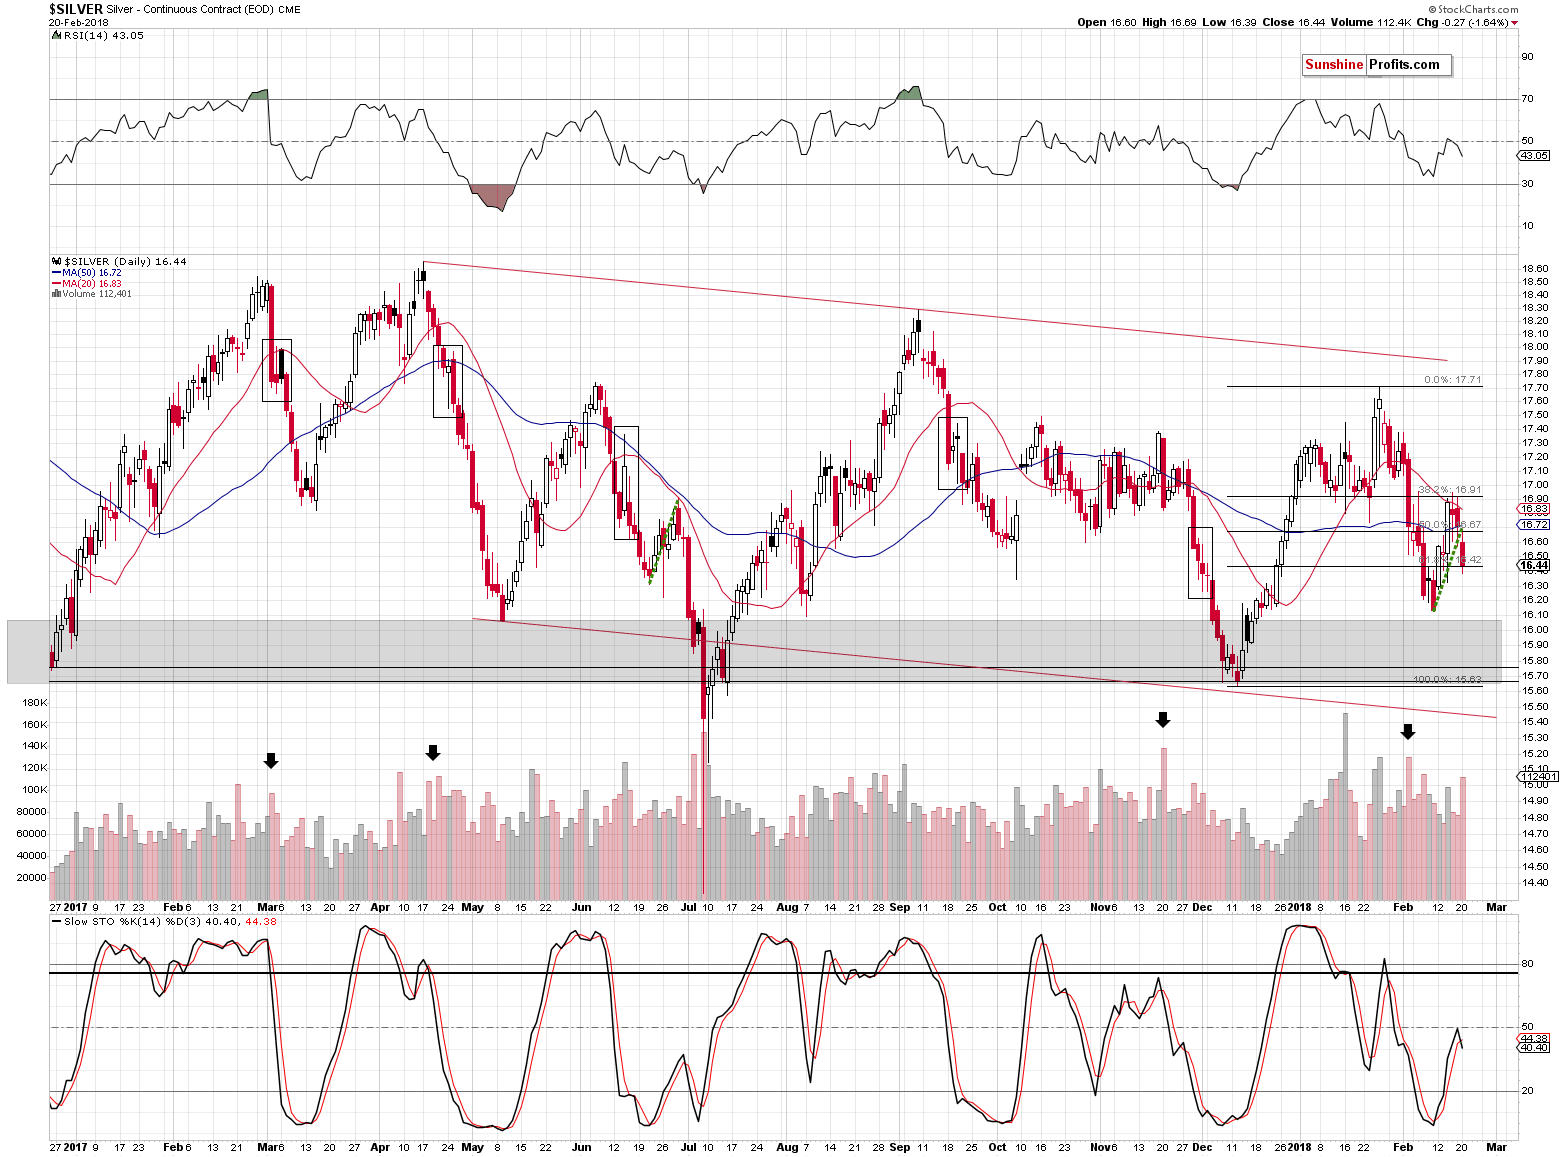
We hope for the above, because if the above takes place, we might see a very specific sign from the silver market and if we do, the probability for a decline in the entire precious metals sector will greatly increase.
This specific signal is silver’s quick outperformance. If gold rallied $10, but silver rallied by $0.50 or so, it would not be a reason to panic, or to be bullish – it would serve as a perfect bearish confirmation and something that would likely make us increase the size of our short position.
For now, we have a new sell signal from the Stochastic indicator, which already serves as a bearish sign. It’s not enough to change the outlook in a dramatic way, though.
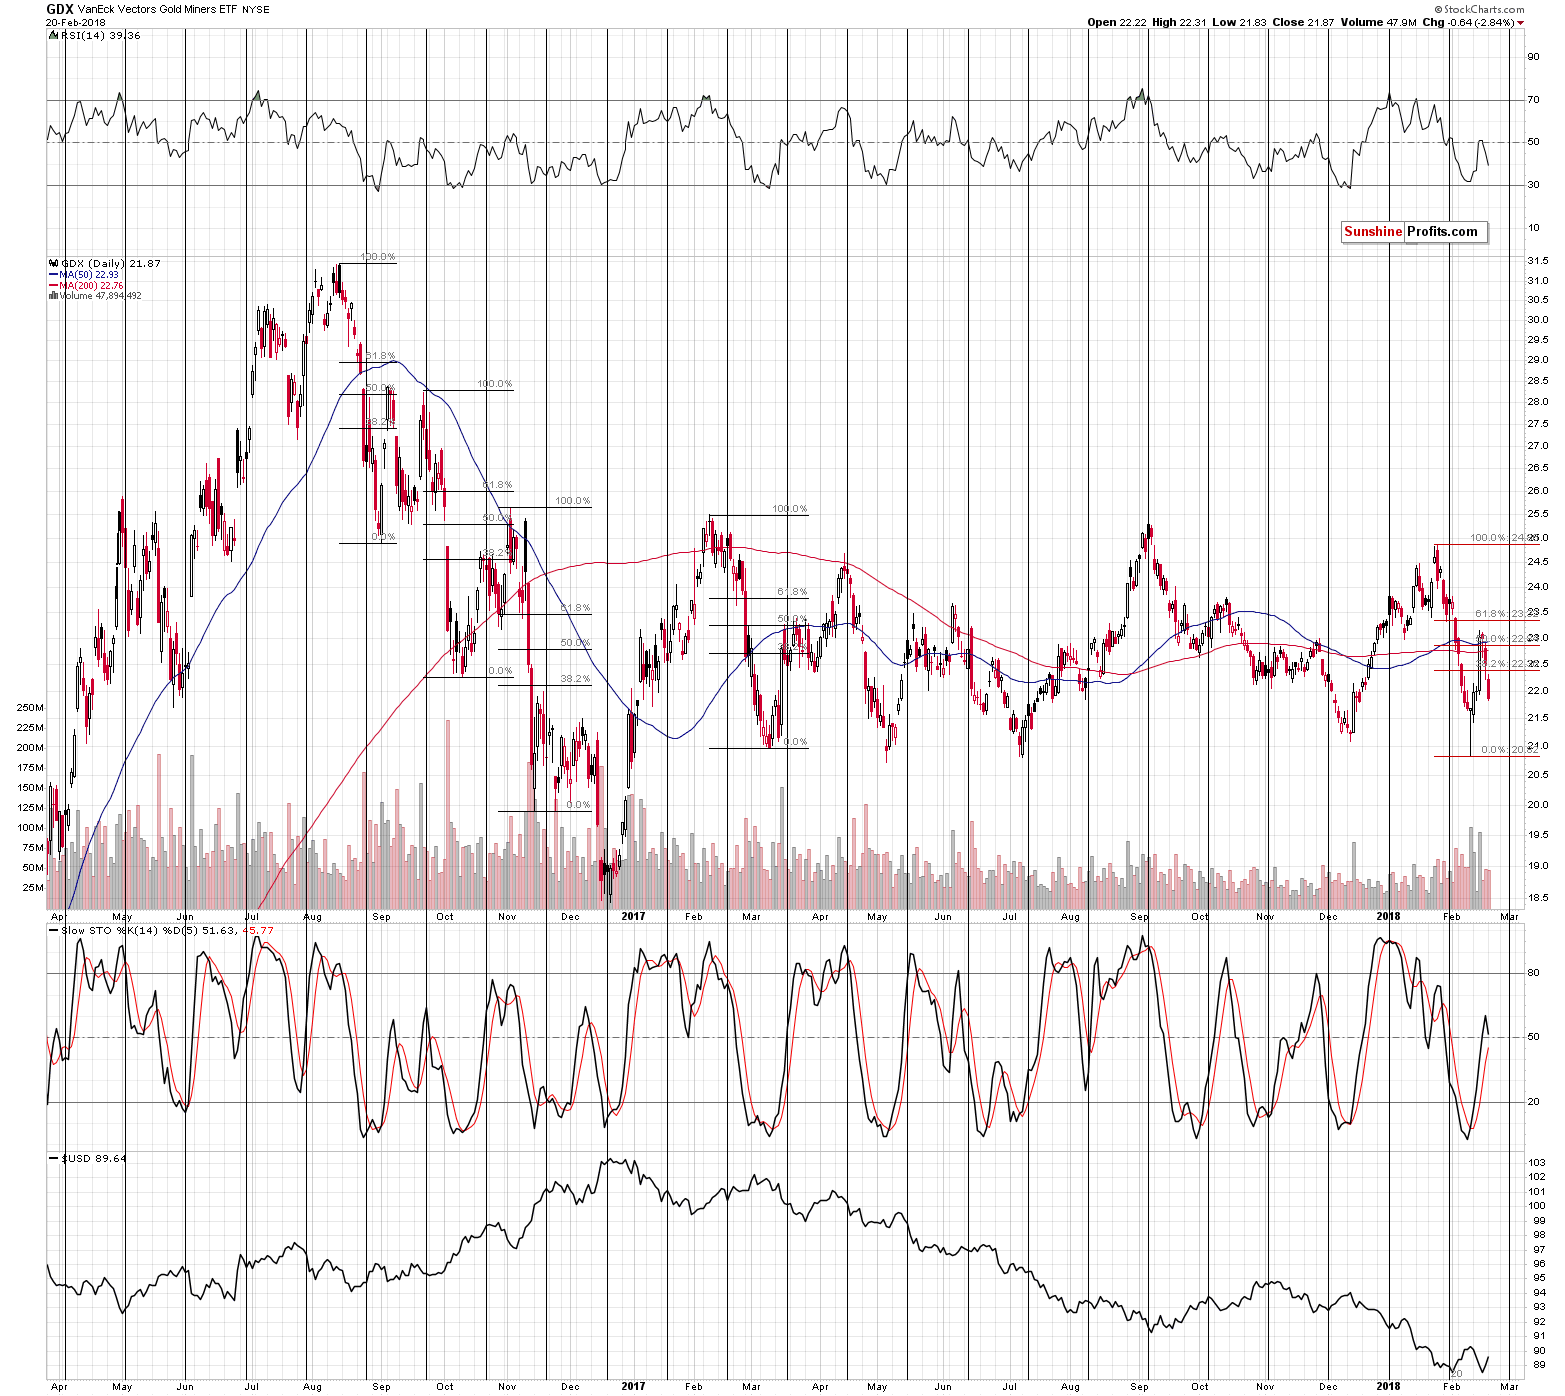
The Valentine’s Day rally is officially erased. But wait, there’s more. Not only did mining stocks erase the entire daily upswing that got everyone and their brother excited, but they also declined below the previous two trading days’ closing prices. In fact, yesterday’s closing price is the 4th lowest close of the year.
The above is a sign of underperformance of mining stocks relatively to gold, which is a bearish factor.
The 50% retracement along with the 50- and 200-day moving averages seem to have stopped the rally, just like we indicated previously:
[Valentine’s Day] rally in the mining stocks may seem like the end of the world or at least like a tremendous change in the situation on the precious metals world. In reality, however, it’s something that we’ve seen multiple times - only not very recently.
The last big and volatile downswing that was followed by a sharp upswing in GDX was seen in February and March 2017. The upswing took miners to about 50% Fibonacci retracement, before stopping. The preceding similar situations took place in the second half of 2016. When GDX declined sharply in August, it rallied back up just a little above the 50% Fibonacci retracement. The decline that started in September corrected initially to the 38.2% retracement, but ended only after miners moved a bit above the 50% retracement. The November decline was corrected to the 38.2% retracement.
At this time, GDX corrected a bit more than 50% of the recent sharp decline, which is well in line with the historical norms for a volatile corrective upswing WITHIN a bigger decline. In other words, even though the mining stocks are up by about 5% today, it’s not necessarily a bullish sign.
During [Thursday’s] session, mining stocks were trading back and forth around the 50% Fibonacci retracement and two of their moving averages: the 50-day and 200-day one. The breakouts above all three resistance levels are not confirmed yet, so we might be currently seeing a topping pattern, just as the currency markets suggest.
Based on the above and on the signs from USD and gold, we have most likely indeed seen a topping pattern.
But why did the mining stocks decline so far and then rallied back up in the first place?
That’s most likely the impact of the price action in the main stock indices. Stocks’ decline was very volatile, and it sank miners as well. The subsequent rebound contributed to miners’ revival. Then, once the volatility decreased, the impact that the general stock market had on the miners decreased substantially as well. In other words, things are now back to normal.
What is normal for mining stocks at this time? Most signs point to decline’s continuation, but we should also take into account the possibility that the decline could continue according to the pattern that is already in place. If you examine the Fibonacci retracements that we marked on the above chart, you’ll see that it was usually the case (September 2016, November 2016, December 2016) that the initial rally in the miners was not the final one before the big slide. Consequently, if we see another short-term upswing here, it will not necessarily be a bullish factor. In fact, it may – depending on the way it takes place and the action in silver – even serve as a bearish sign.
Measuring Miners’ Relative Performance
Before summarizing, we will feature our reply to a question that we received about out- and underperformance of mining stocks. The question was how to check it, since mining stocks generally multiple daily swings in gold in both directions.
There are couple of ways in which one can compare the performance of mining stocks to the performance of gold.
Firstly, you can look at the percentage change on each day. This will not detect any subtle out- and underperformance cases, but it's enough for the big ones. For instance, if gold is up by $4 or so and gold stocks are down 1% - it's clear that the mining stocks are underperforming on that day. If the case is not that obvious, we look at what was the usual way in which miners recently performed relative to gold. Did it change and how significantly? If gold's rallies used to be magnified 2x during a certain rally, but now it quickly declined to 1.5x, the 1x, then 0.5x and then to just 0.1x - it's a clear case of underperformance and a bearish signal.
Secondly, you can look at the daily price moves as compared to most recent price swings. For instance, gold erases last month's decline, but miners erase only half of last month's decline - that's a bearish sign.
Thirdly, you can look at the GDX to GLD or HUI to gold ratios. If the ratio breaks below a certain level or is in a clear short-term downtrend despite a move higher in gold, then it suggests that something is wrong with the rally and that it's about to end.
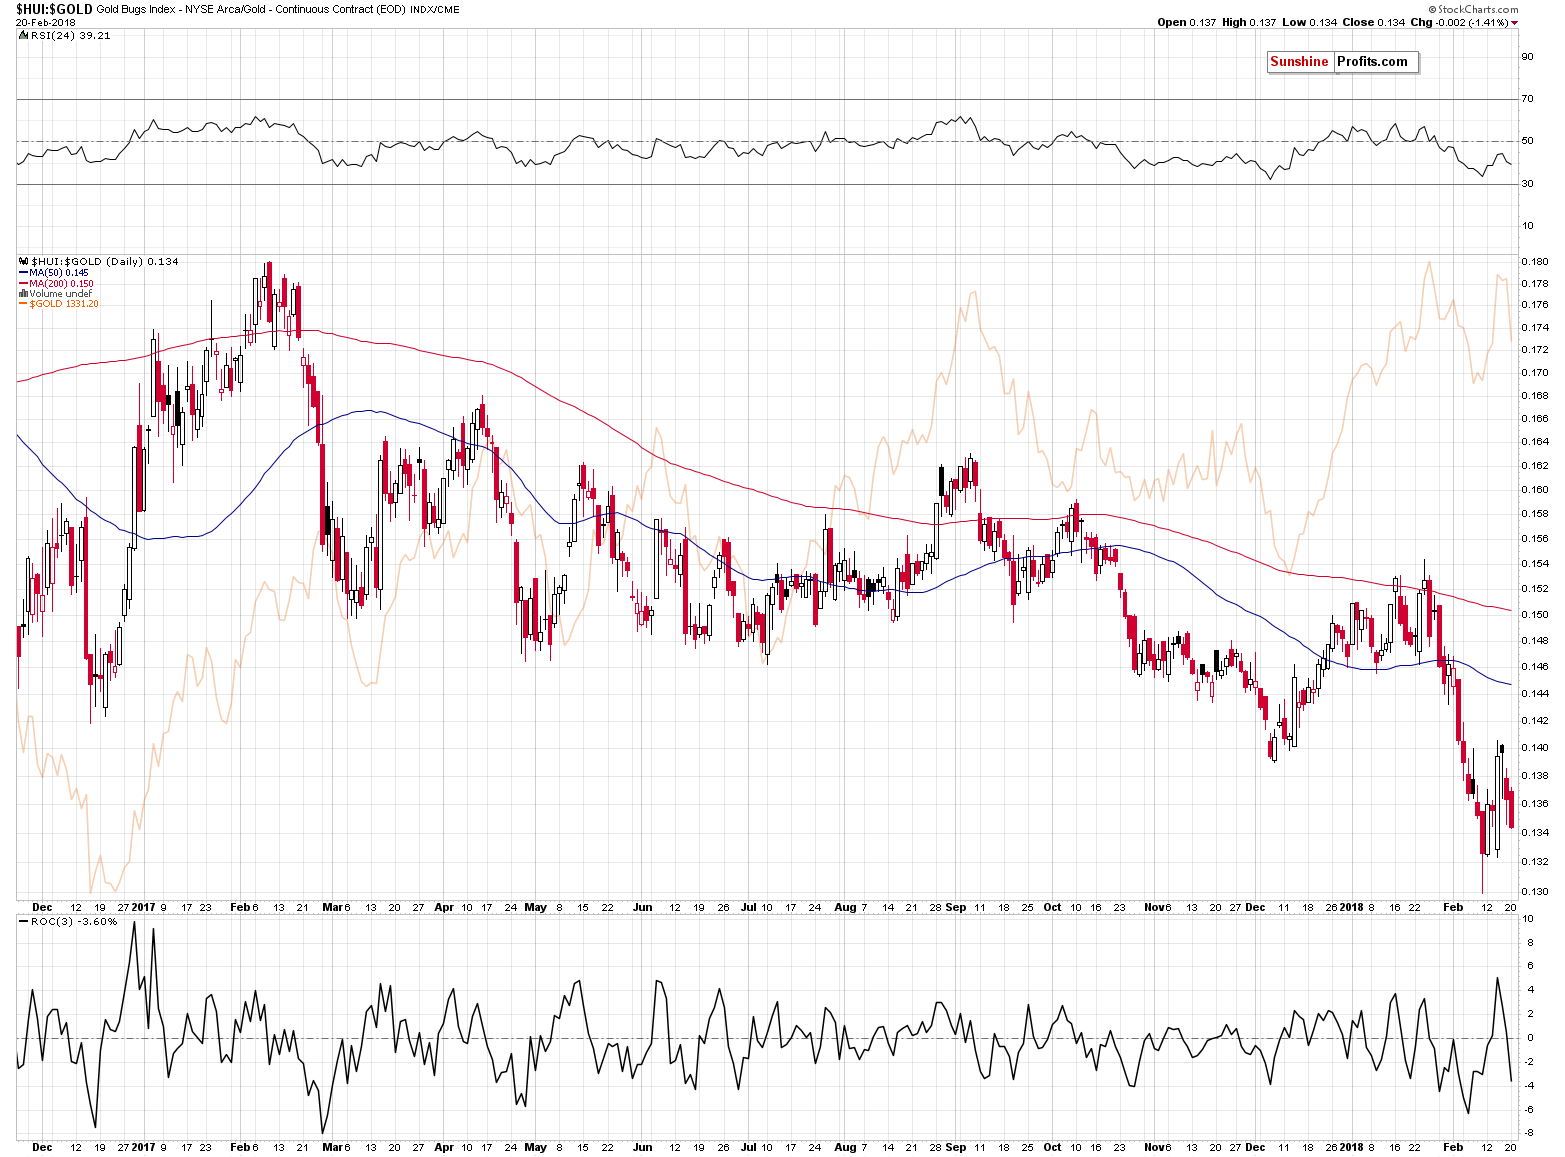
For instance, the breakdowns below the 2016 and 2017 lows in the HUI to gold ratio served as a very bearish indication. The bearish implications remain in place as the breakdown was recently verified by a correction back to it that was followed by further declines.
Summing up, the top in gold, silver and mining stocks is most likely in and the underperformance of mining stocks confirms it. Moreover, since the USD Index just invalidated breakdowns below its key support levels, it’s likely to rally, which is likely to contribute to lower precious metals prices in the coming weeks. We might – and we hope that we do – see another small upswing in the PMs and this might serve as an opportunity to add to our short positions.
If we’re lucky, we’ll see another small upswing in gold which is accompanied by a bigger daily rally in silver and disappointing performance in mining stocks. This would serve as a perfect bearish confirmation for the short term that would likely make us double the size of the current short position. At this time, however, the above is just a possibility, not a certainty, so we’ll need to keep monitoring the market and act accordingly.
As always, we will keep you – our subscribers – informed.
To summarize:
Trading capital (supplementary part of the portfolio; our opinion): Full short positions (100% of the full position) in gold, silver and mining stocks are justified from the risk/reward perspective with the following stop-loss orders and initial target price levels:
- Gold: initial target price: $1,218; stop-loss: $1,382; initial target price for the DGLD ETN: $53.98; stop-loss for the DGLD ETN $37.68
- Silver: initial target price: $14.63; stop-loss: $17.82; initial target price for the DSLV ETN: $33.88; stop-loss for the DSLV ETN $20.88
- Mining stocks (price levels for the GDX ETF): initial target price: $19.22; stop-loss: $26.14; initial target price for the DUST ETF: $39.88; stop-loss for the DUST ETF $15.78
In case one wants to bet on junior mining stocks' prices (we do not suggest doing so – we think senior mining stocks are more predictable in the case of short-term trades – if one wants to do it anyway, we provide the details), here are the stop-loss details and initial target prices:
- GDXJ ETF: initial target price: $27.82; stop-loss: $38.22
- JDST ETF: initial target price: $94.88 stop-loss: $37.78
Long-term capital (core part of the portfolio; our opinion): No positions (in other words: cash)
Insurance capital (core part of the portfolio; our opinion): Full position
Important Details for New Subscribers
Whether you already subscribed or not, we encourage you to find out how to make the most of our alerts and read our replies to the most common alert-and-gold-trading-related-questions.
Please note that the in the trading section we describe the situation for the day that the alert is posted. In other words, it we are writing about a speculative position, it means that it is up-to-date on the day it was posted. We are also featuring the initial target prices, so that you can decide whether keeping a position on a given day is something that is in tune with your approach (some moves are too small for medium-term traders and some might appear too big for day-traders).
Plus, you might want to read why our stop-loss orders are usually relatively far from the current price.
Please note that a full position doesn’t mean using all of the capital for a given trade. You will find details on our thoughts on gold portfolio structuring in the Key Insights section on our website.
As a reminder – “initial target price” means exactly that – an “initial” one, it’s not a price level at which we suggest closing positions. If this becomes the case (like it did in the previous trade) we will refer to these levels as levels of exit orders (exactly as we’ve done previously). Stop-loss levels, however, are naturally not “initial”, but something that, in our opinion, might be entered as an order.
Since it is impossible to synchronize target prices and stop-loss levels for all the ETFs and ETNs with the main markets that we provide these levels for (gold, silver and mining stocks – the GDX ETF), the stop-loss levels and target prices for other ETNs and ETF (among other: UGLD, DGLD, USLV, DSLV, NUGT, DUST, JNUG, JDST) are provided as supplementary, and not as “final”. This means that if a stop-loss or a target level is reached for any of the “additional instruments” (DGLD for instance), but not for the “main instrument” (gold in this case), we will view positions in both gold and DGLD as still open and the stop-loss for DGLD would have to be moved lower. On the other hand, if gold moves to a stop-loss level but DGLD doesn’t, then we will view both positions (in gold and DGLD) as closed. In other words, since it’s not possible to be 100% certain that each related instrument moves to a given level when the underlying instrument does, we can’t provide levels that would be binding. The levels that we do provide are our best estimate of the levels that will correspond to the levels in the underlying assets, but it will be the underlying assets that one will need to focus on regarding the signs pointing to closing a given position or keeping it open. We might adjust the levels in the “additional instruments” without adjusting the levels in the “main instruments”, which will simply mean that we have improved our estimation of these levels, not that we changed our outlook on the markets. We are already working on a tool that would update these levels on a daily basis for the most popular ETFs, ETNs and individual mining stocks.
Our preferred ways to invest in and to trade gold along with the reasoning can be found in the how to buy gold section. Additionally, our preferred ETFs and ETNs can be found in our Gold & Silver ETF Ranking.
As a reminder, Gold & Silver Trading Alerts are posted before or on each trading day (we usually post them before the opening bell, but we don't promise doing that each day). If there's anything urgent, we will send you an additional small alert before posting the main one.
=====
Hand-picked precious-metals-related links:
PRECIOUS-Gold steadies ahead of Fed minutes after steep slide
These Bacteria Convert Heavy Metals Into Gold
=====
In other news:
Inflation's Back and Commodities Will Benefit, JPMorgan Says
Investors Are Scared, And ECB's Not Even Close to Unwinding QE
Euro zone business growth lost some steam in Feb but still robust
UK interest rate rise is coming, Bank of England tells borrowers
=====
Thank you.
Sincerely,
Przemyslaw Radomski, CFA
Founder, Editor-in-chief, Gold & Silver Fund Manager
Gold & Silver Trading Alerts
Forex Trading Alerts
Oil Investment Updates
Oil Trading Alerts

