

Briefly: In our opinion, full (200% of the regular size of the position) speculative short positions in gold, silver and mining stocks are justified from the risk/reward perspective at the moment of publishing this alert. We are moving the initial target prices higher in order to prepare for the possible rebound next week.
Silver moved higher on Wednesday and also during yesterday’s trading and many precious metals investors and traders are likely hoping for a new sizable rally. Mining stocks have just killed this hope.
The GDX ETF declined about half a percent, which is not much, but it’s quite significant if one takes into account the fact that the GLD ETF closed without declining at all and when one notes that it was the third consecutive day below the neck level of the head-and-shoulders formation. The breakdown and the entire formation are therefore completed and verified and the significant bearish implications are in full strength.
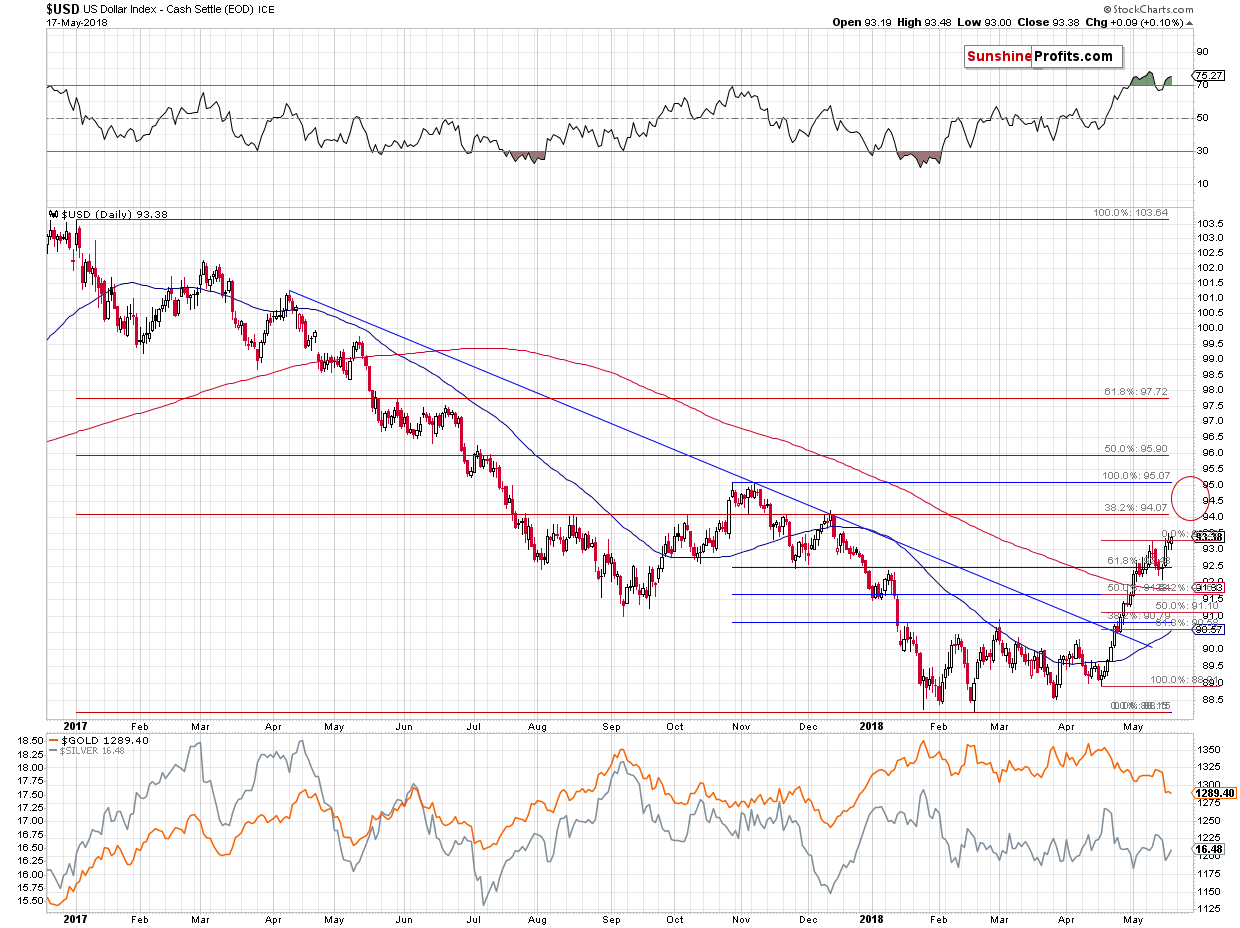
At the same time, the USD Index closed the day above the previous 2018 high, thus confirming its own breakout. Both confirmations have strong bearish implications for the precious metals sector in the coming days.
Let’s take a closer look (chart courtesy of http://stockcharts.com).
Breakout and Breakdown – Fully Confirmed
In Wednesday’s alert, we emphasized how the outlook for the USD and its implications for the PMs changed:
The situation in the USD Index was the only thing that had bullish implications for the PMs and based on what happened yesterday, the implications are now bearish. The USDX moved to new 2018 highs in terms of both intraday and closing prices. This invalidates the previous theory according to which there will be another short-term downswing after a few days of pause. Based on the breakout, this is no longer likely. Instead, the USD is now likely to move to the next resistance or even higher (in fact, our short positions in EUR/USD are already profitable). The next two target prices are at about 94 and 95. The former is provided by the December 2017 top and the latter is based on the October / November top. The 94 level seems more important as its strengthened by the August and early October tops and the 38.2% Fibonacci retracement level.
The above remains up-to-date and the thing that we would like to emphasize is that during yesterday’s and Wednesday’s trading, the USD didn’t move back below the previous May high. Instead, it closed a bit higher on both days. This means that the breakout is now fully confirmed and that the mentioned bearish implications for PMs are as strong as they could become.
As far as the GDX ETF chart is concerned, we previously commented on it in the following way:
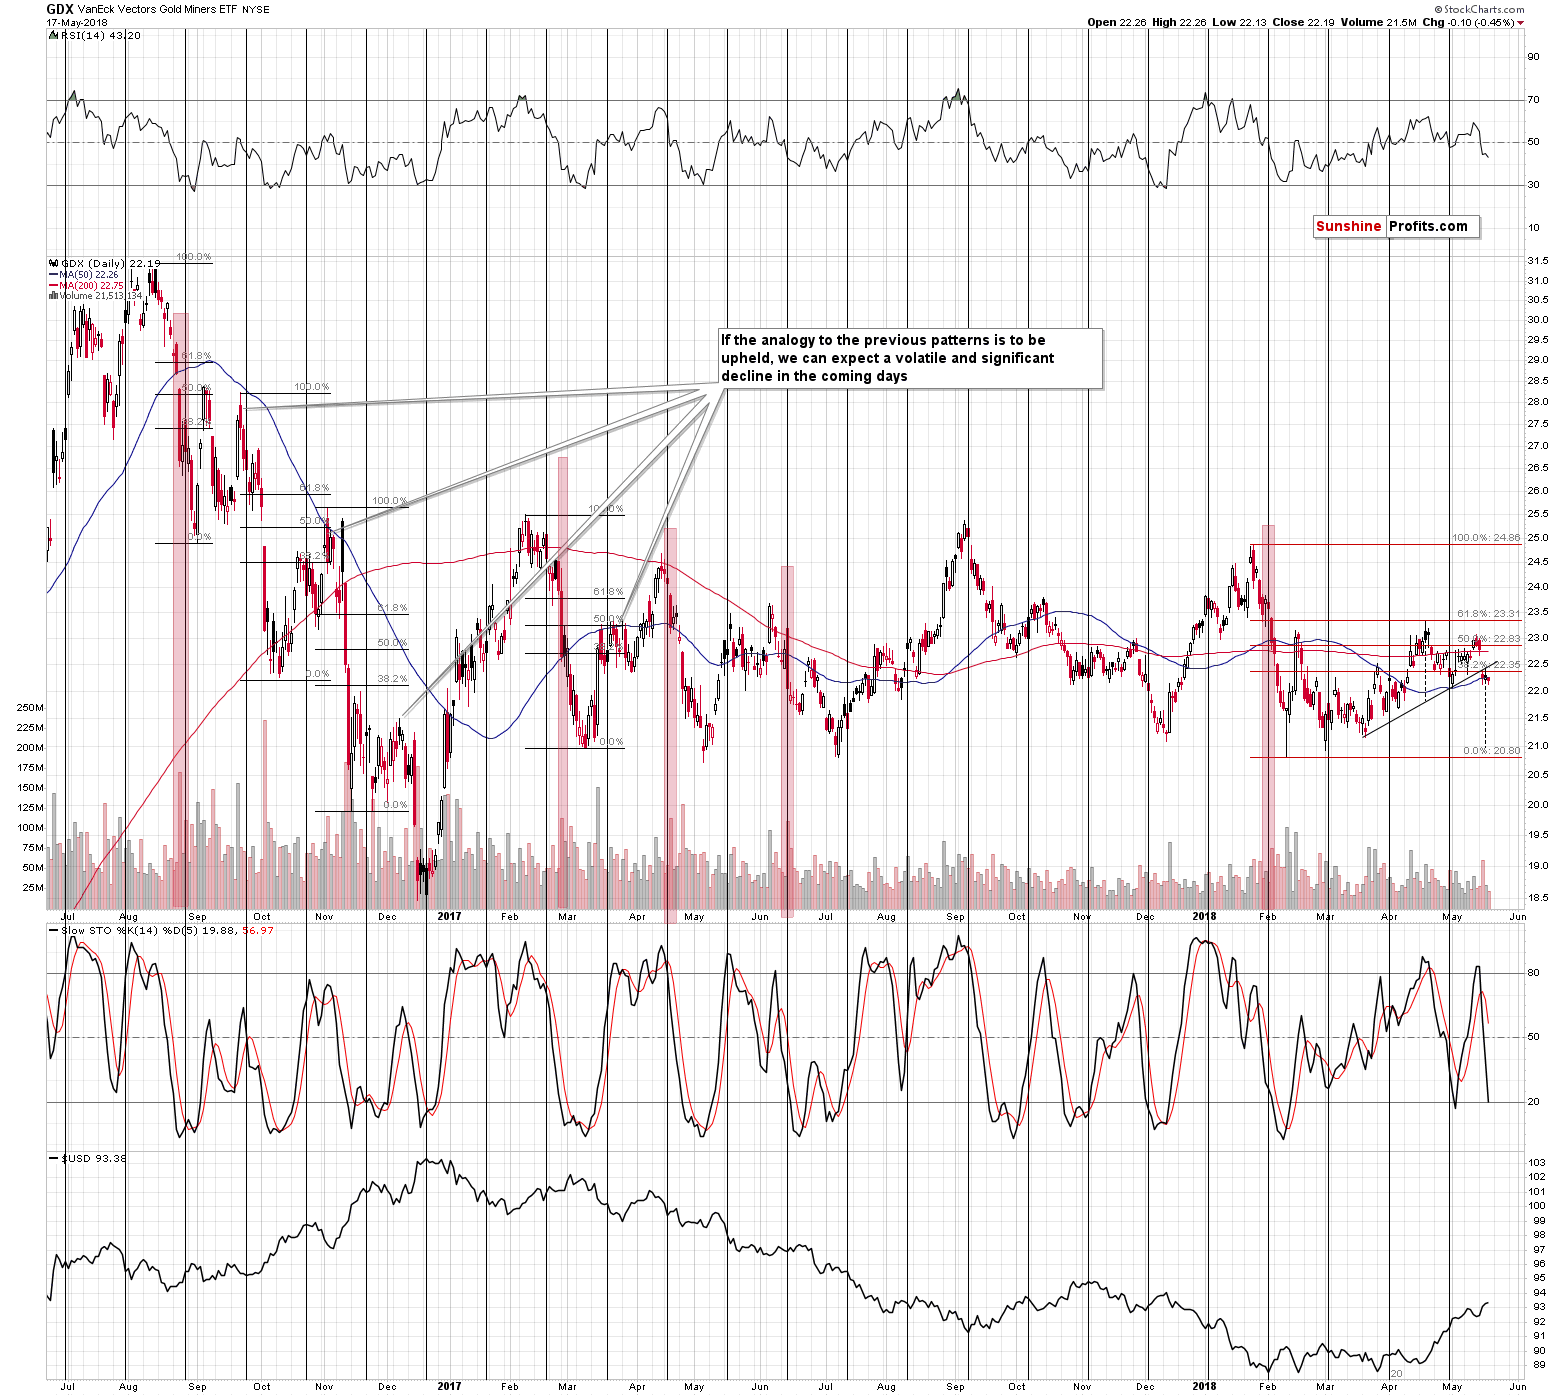
The breakdown is clear and it took place on huge volume. While its usually best to wait for two additional closes below a certain price level, based on the size of the volume, we can say that the breakdown was already verified in a way.
Moreover, yesterday’s decline created and completed a bearish head-and-shoulders pattern. The minimum target based on this formation can be obtained by applying the size of the head to the price of the breakdown. We marked both with dashed lines and based on this technique it seems that the GDX is about to decline to the previous 2018 lows. At about $21.
However, there are two factors that suggest that miners will decline much more. The less important is the analogy to the late-2016 declines. The double / triple (when counting this month’s upswing) move back to the 50% - 61.8% Fibonacci retracement levels makes the entire 2018 performance similar to the short-term downswings that we saw in late 2016. If the similarity is to continue, then the first big sharp move lower is just a start of something much bigger.
It’s best if a given breakdown is confirmed by two additional closes and we saw exactly that. Moreover, GDX even moved back to the neck of previously completed head-and-shoulders pattern and then it declined. That’s a textbook example of the pattern’s verification.
As discussed earlier, the $21 level is the current minimum target for this decline.
Gold’s Lack of Rebound
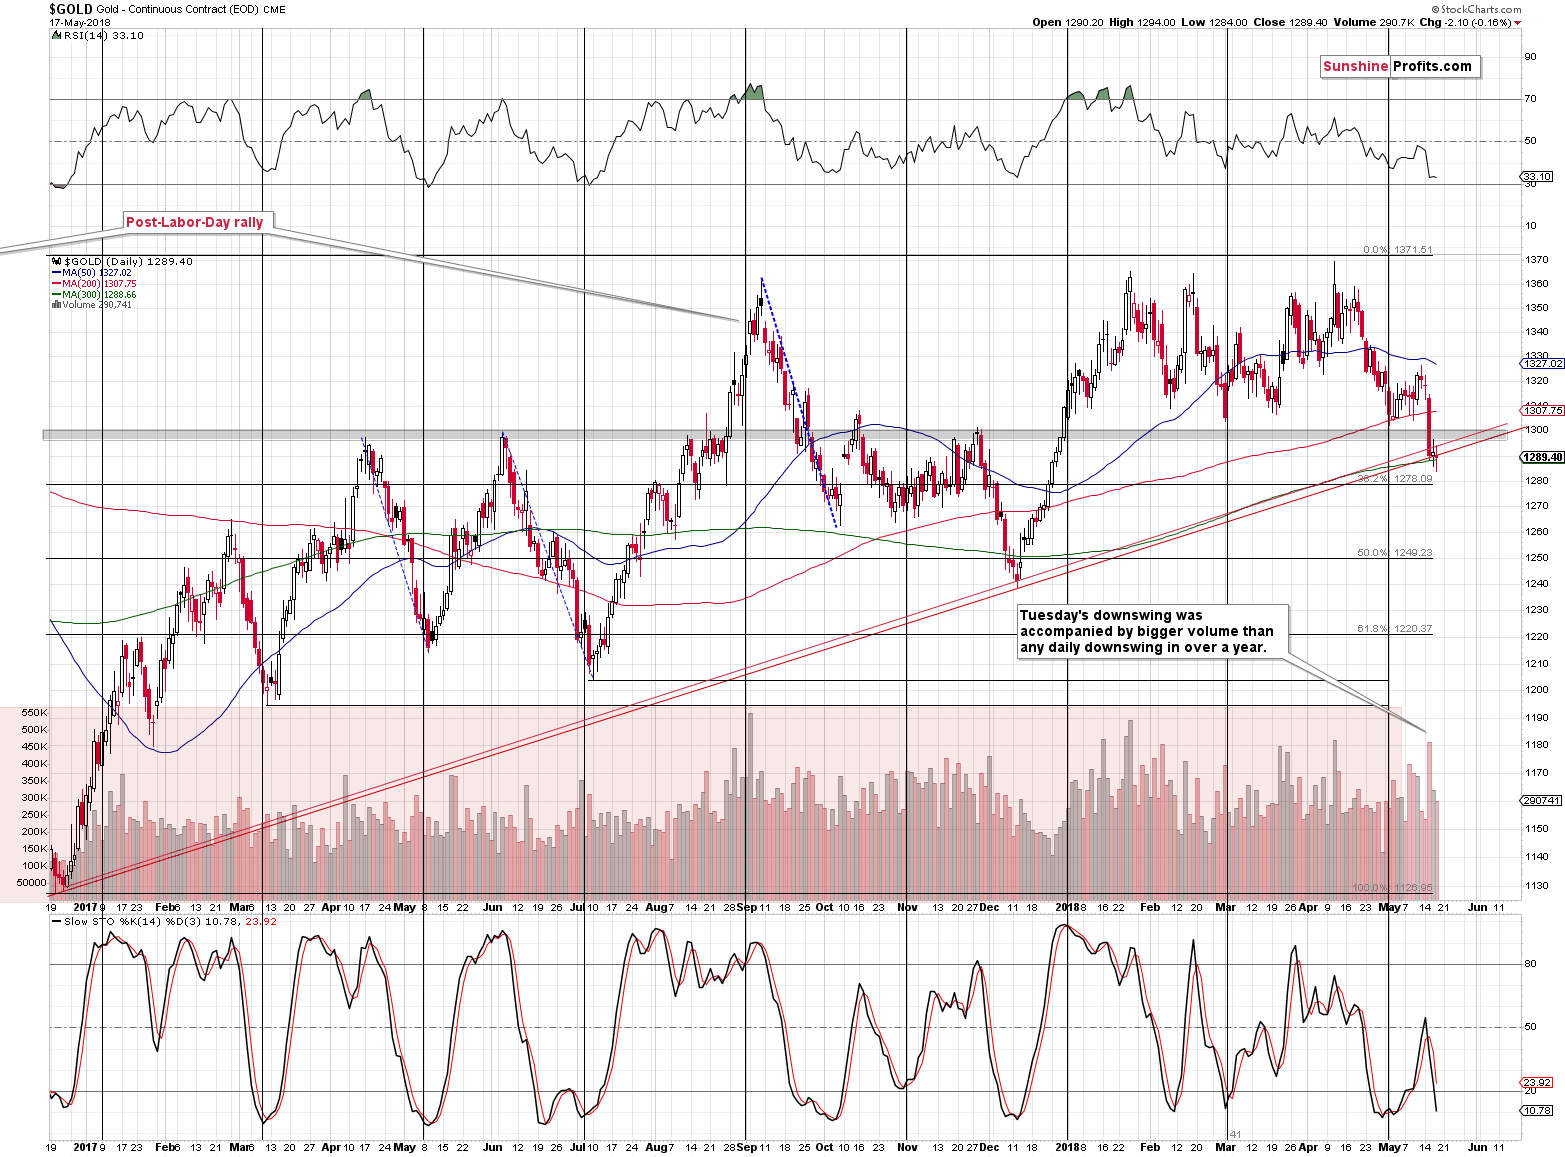
In Wednesday’s alert, we wrote that there was a bullish factor in the form of the red support line. It was reached, so gold could show some temporary strength.
Instead of showing strength, gold showed weakness. The best that it was able to do was to move back and forth and even move a bit below this line. That’s the opposite of showing strength.
The line that we described was based on the intraday prices. Another way to draw such lines is to use the closing prices. We did and that’s why the above chart features two lines. The upper one is based on the closing prices.
While gold was moving around the line based on the intraday lows, it closed below the daily-closing-based line for 3 consecutive trading days, thus verifying the breakdown. With GDX’s and the USD’s verifications, that’s the third important signal that now supports much lower PM prices in the short term.
Silver’s Outperformance

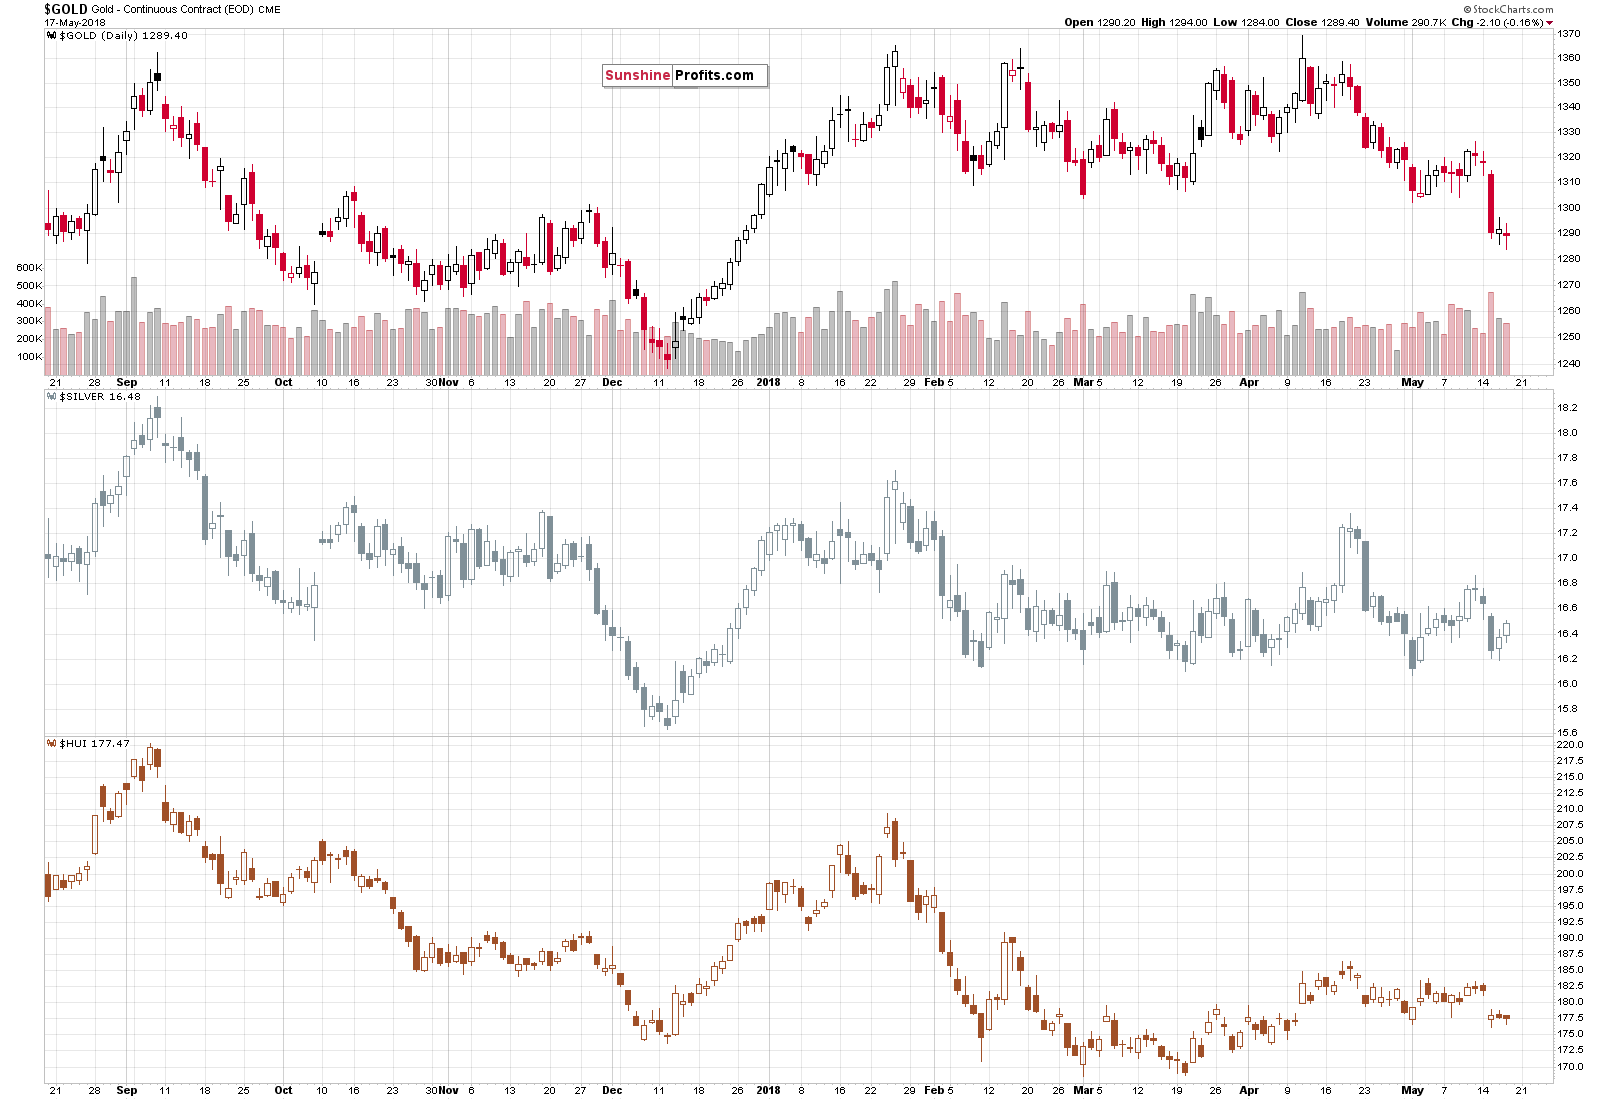
The white metal moved higher once again, visibly outperforming gold and mining stocks. This may appear bullish, but in reality, is a very bearish development as silver’s short-term outperformance is what precedes declines. Since the precious metals sector is already declining (based on gold’s and miners’ performance, the last 2 days were just a pause), it seems likely that the move lower will continue shortly.
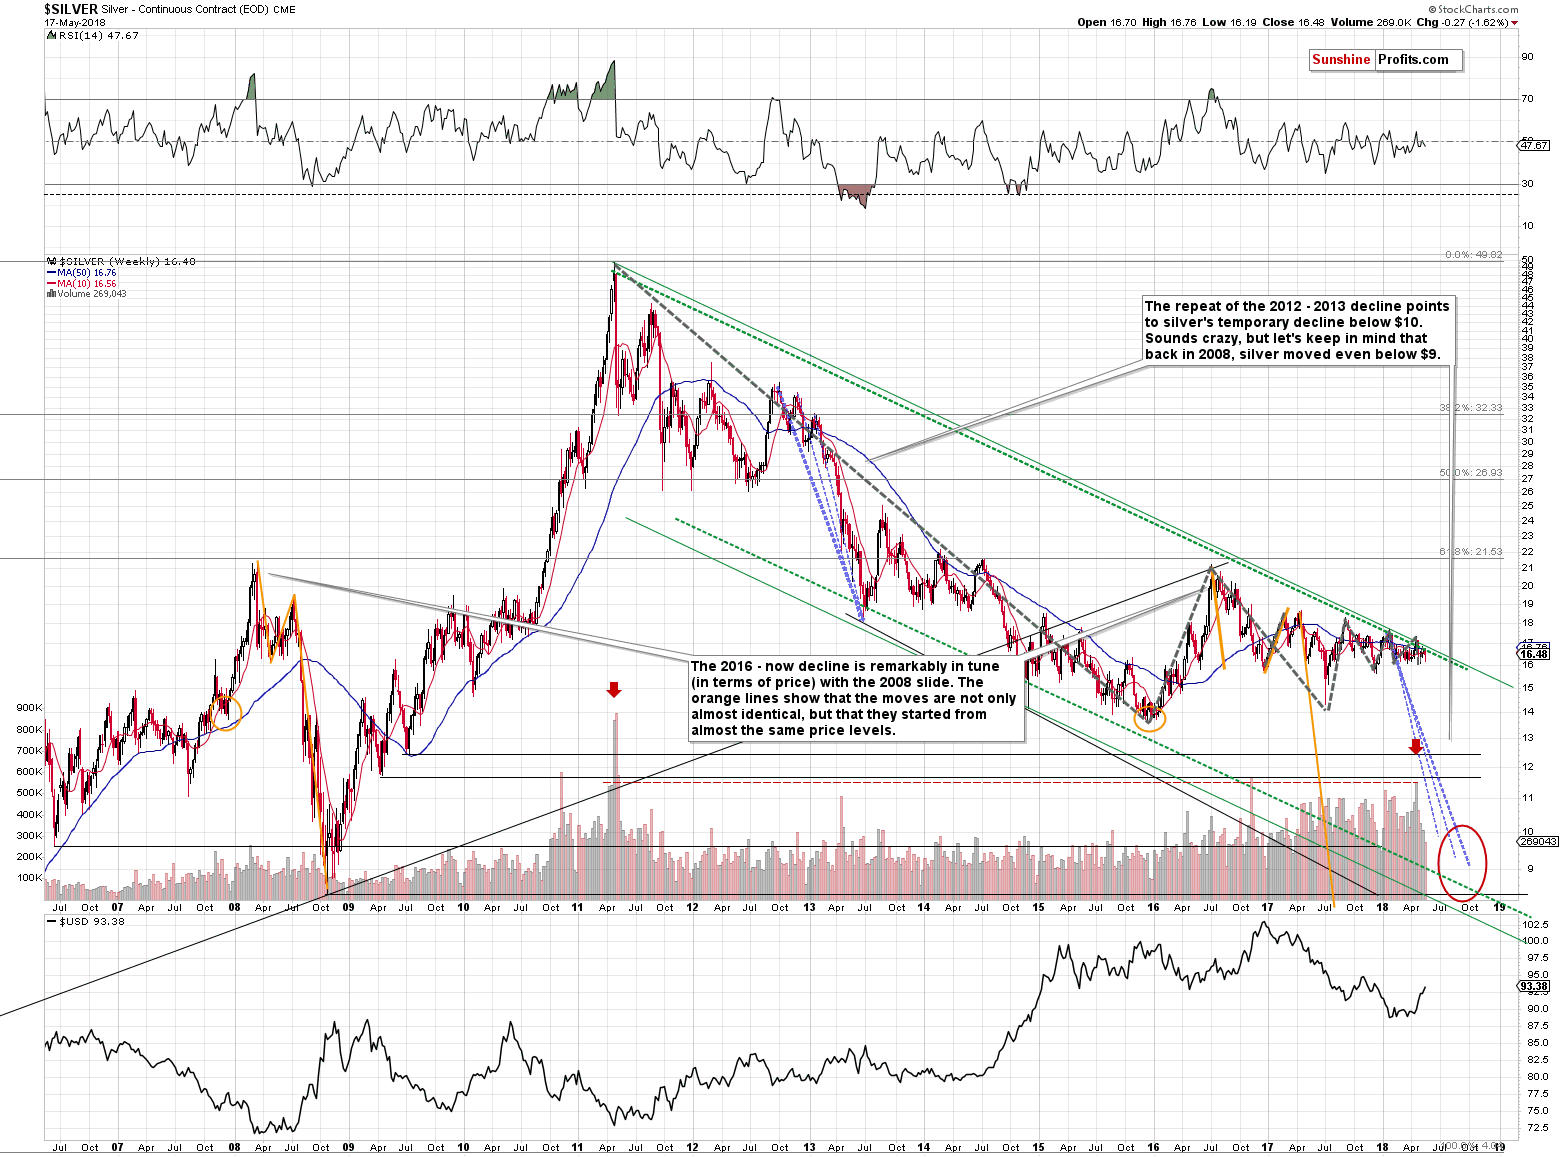
Let’s not forget about silver’s oscillating nature. The white metal’s moves, both up and down, continue to be smaller and smaller. At some point, this pattern in the white metal will end and the results will wake up those who expect nothing buy several-cent moves each day. Silver can move by more than a dollar per day – and it will.
The odds are that the next medium-term move will be to the downside and it’s likely to be big enough to make silver break out of the mentioned oscillating pattern, thus making the downswing something truly profound.
The Game Plan and Nearby Downside Targets
We previously discussed how low gold, silver, and mining stocks might decline, but we’d like to provide you with a more detailed game plan before the end of the week.
As you read previously, the precious metals sector could reverse temporarily next week on Wednesday or Thursday based on gold and silver’s apex-based turning points. These turning points provided to be extremely useful once again just a few days ago, so we should definitely pay attention to those signals.
But, how low can gold, silver and miners move next week?
Before continuing, we’d like to emphasize that this is what seems most likely at this time, but we are not discarding other possibilities. It’s more important to stay flexible when the new developments emerge than to stick to one’s original scenario – and we will. Still, there are 2 things that seem more likely than the other.
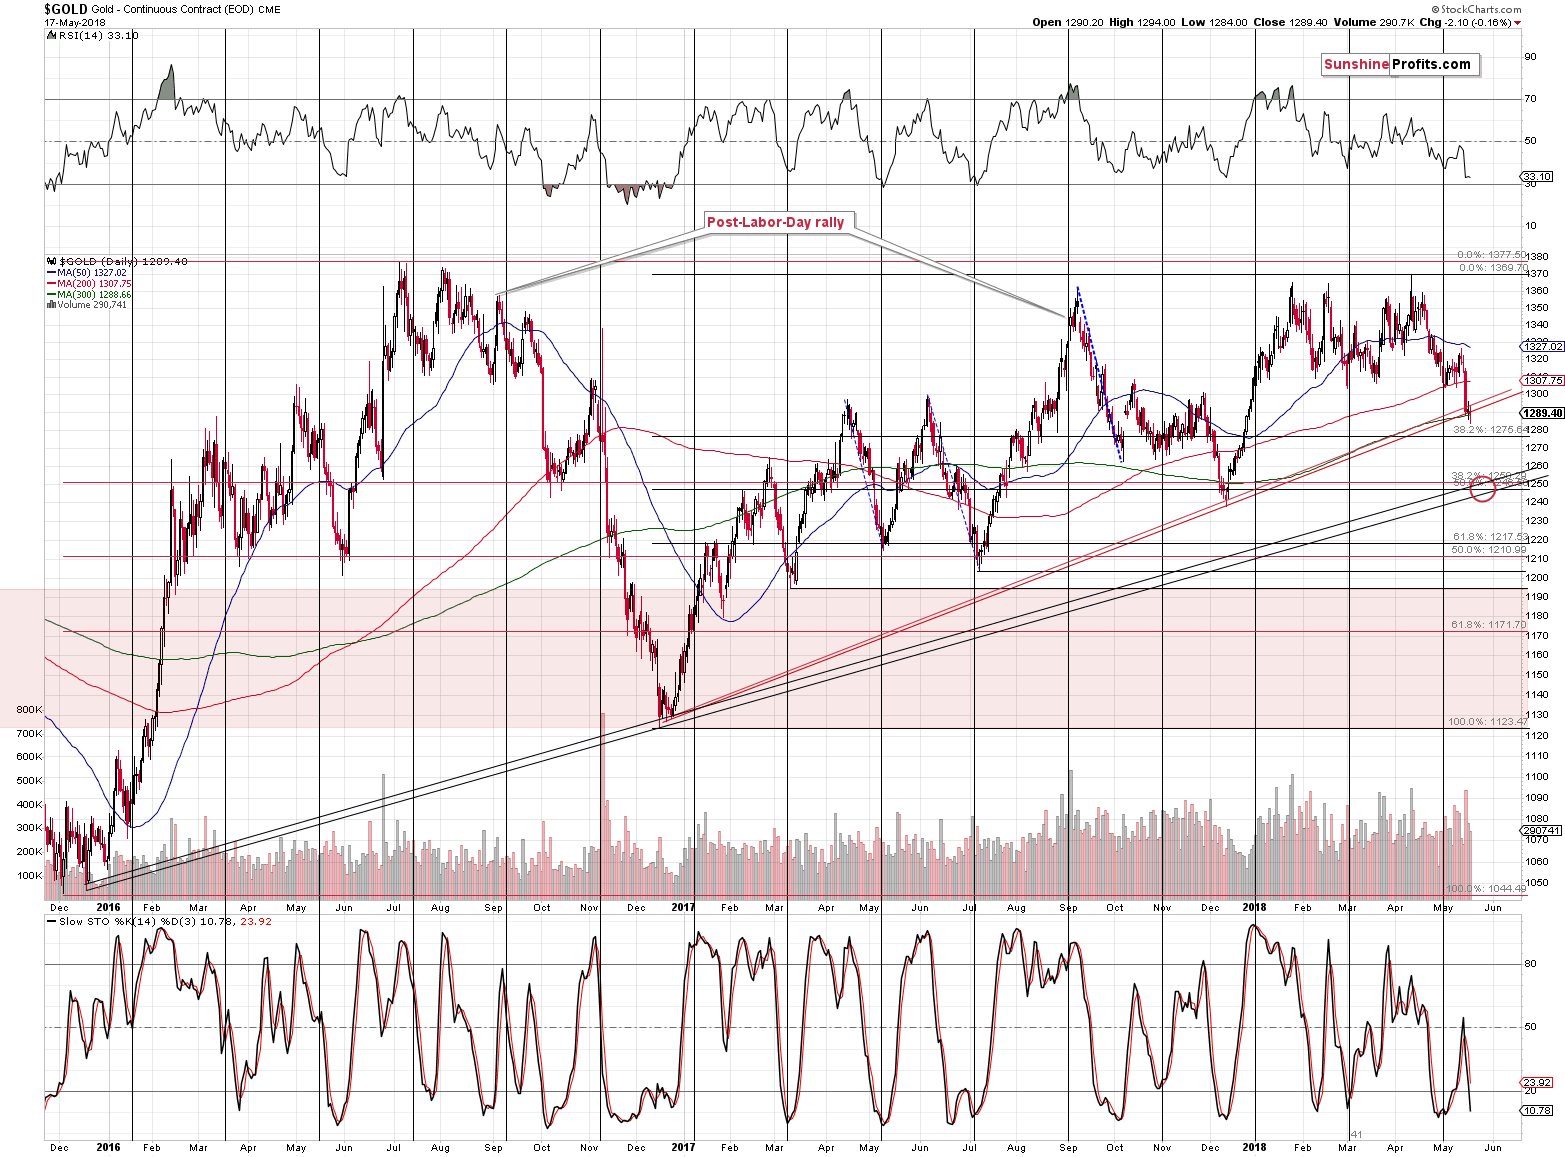
The first one is gold bouncing from the $1,250 level or its proximity. There was no meaningful correction from the currently-tested rising support line, which makes it more likely that the next strong support will indeed manage to generate one. After all, no market can move up or down without periodic corrections.
Why $1,250? Because of several reasons:
- Long-term support line based on the December 2015 and December 2016 highs. When based on the closing prices, this line is a bit above $1,250, and when based on the intraday lows, this line is a bit below $1,250. Consequently, it seems likely that we’ll see a move below $1,250 on an intraday basis, but a close back above it. This intraday prediction is not very precise, yet that’s an outcome that appears more likely than others.
- The 38.2% Fibonacci retracement level based on the 2015 – 2016 rally is at $1,250.
- The 50% Fibonacci retracement level based on the 2016 – 2018 rally is just a few dollars below $1,250.
- The previous short-term decline ended a few dollars below $1,250 in December 2017.
- The RSI indicator is at 33, and a move below 30 corresponded to local bottoms many times in the past. A move to $1,250 seems to be enough to make the RSI move below 30.
- The current situation is similar to what happened in early October 2016, when gold moved lower after topping for several months and forming many local tops. Gold has been topping most of this year, forming many local tops. In both 2016 and 2018 gold topped close to $1,370 and the initial local bottoms were formed a bit above $1,300. When gold finally broke below $1,300, it bounced only after reaching $1,250. Interestingly, it moved below this level on an intraday basis and closed the session back above it, just like the support lines (Point 1) are currently suggesting.
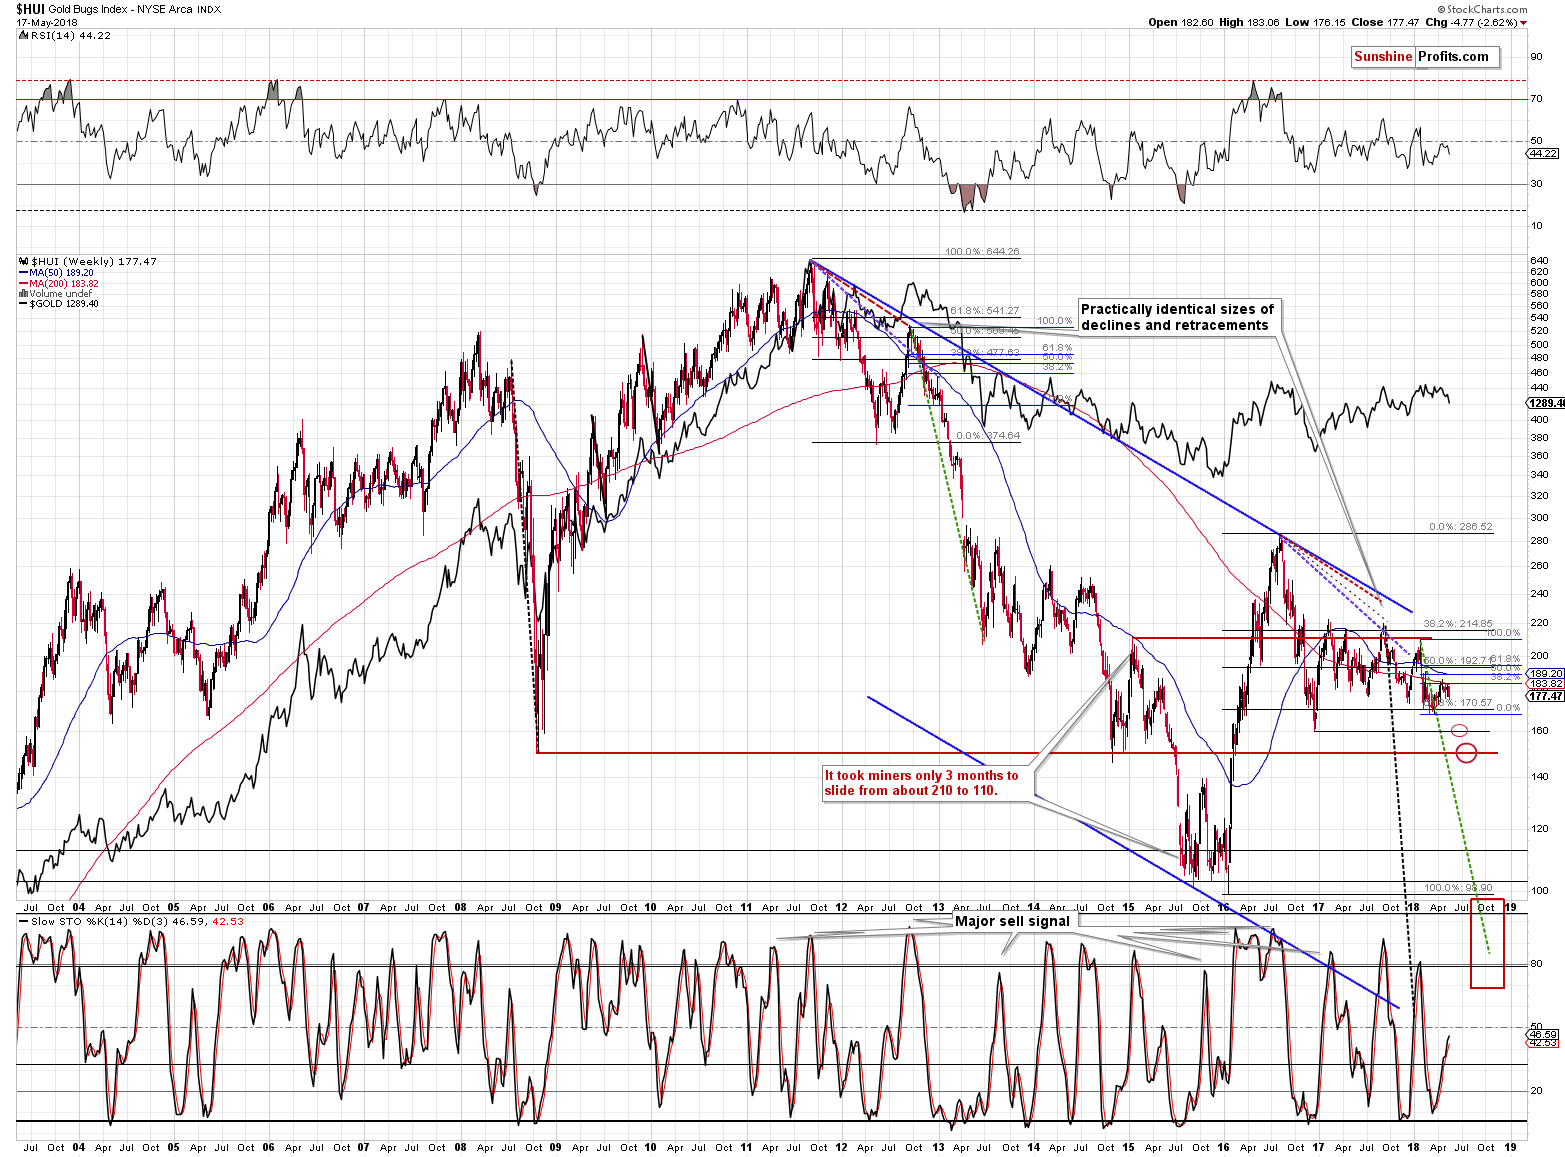
In the case of the HUI Index, there are several support targets: the 2018 low, 160,150, and the 110-100 area. Which of them will be hit next week? The 2018 low seems most likely, but if it’s already breached when gold is still well above $1,250, then we might see a move even to 160.
Naturally, the latter is not very likely and the move to the 2018 low next week is, but we wanted to explain how one can get the reversal prices without knowing them in advance, based on other markets. The first step is to establish the support levels and then to check which of them is nearby when a more reliable target level in a corresponding market is being reached.
This technique will be heavily used in the case of silver as the white metal provides us with even fewer details than the HUI Index chart.
The long-term silver chart doesn’t provide any precise targets that are nearby, and the ones seen on the short-term chart are rather unclear.
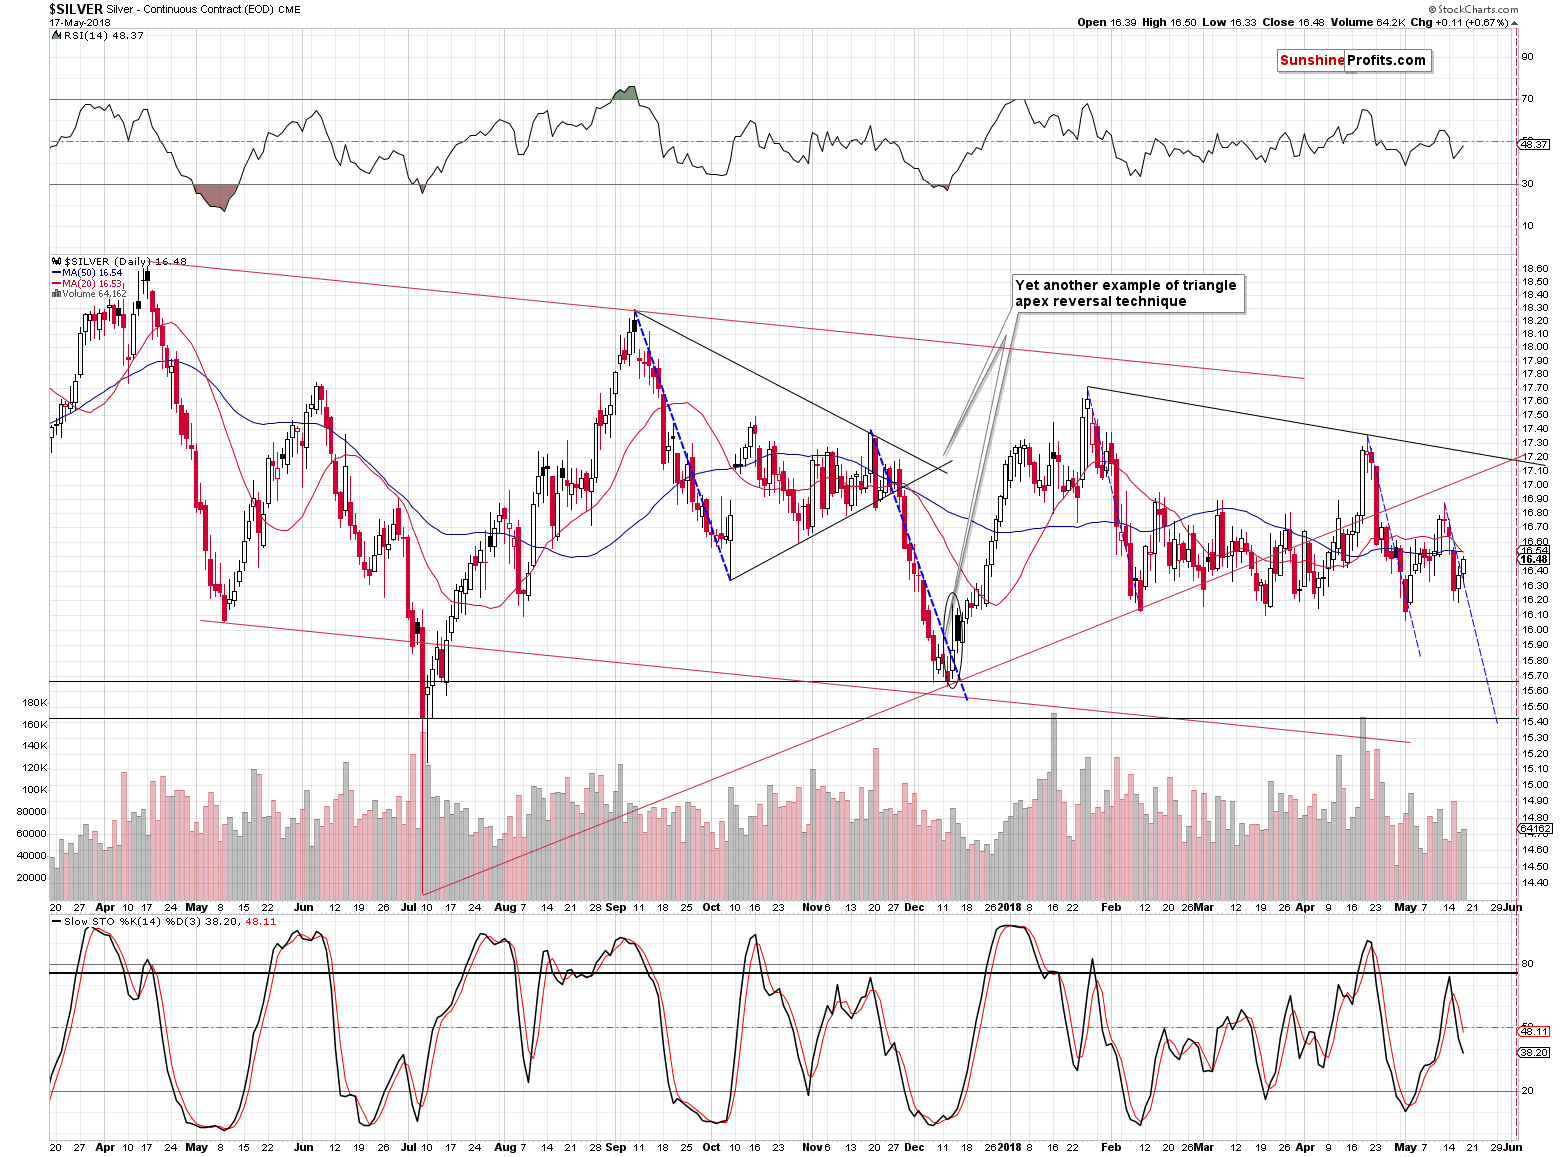
The closest support is provided by the February, March and May lows, but it seems that if gold moves significantly lower, silver will decline more than to just this month’s low. The next support is provided by the December 2017 low (at about $15.60 - $15.70), which seems to be the most likely target for next week’s bottom.
Why is the silver case rather unclear? Because the December 2017 bottom may be a bit too low given silver’s recent strength, or it may be too high given silver’s crazy volatility at times. If we had multiple additional signs pointing to the same target, like it is the case with gold, this target would be stronger. But we don’t, so it seems best to focus on gold, where the situation seems to be the clearest and to use the fact that gold, silver and mining stocks tend to form short-term bottoms at the same time.
Summary
Summing up, based on the apex-based reversals, True Seasonal patterns for gold, silver and mining stocks, USDX’s breakout, GDX’s breakdown and silver’s Wednesday’s and yesterday’s outperformance, it seems that the local top is already in and that we can expect a sharp decline in the coming days and weeks.
Based on the nearby apex-based reversals in gold and silver, we might expect a turnaround next week on Wednesday or Thursday. It seems likely that gold will reverse close to $1,250, while GDX moves to $21 and silver slides to about $15.60 - $15.70, but out of the above only gold’s price target is confirmed by multiple techniques, so it seems best to focus on this particular market when timing the next week’s bottom in the rest of the precious metals sector.
Based on the above, we are moving the initial target prices higher as it may be worth catching this bottom.
As always, we will keep you – our subscribers – informed.
To summarize:
Trading capital (supplementary part of the portfolio; our opinion): Full short positions (200% of the full position) in gold, silver and mining stocks are justified from the risk/reward perspective with the following stop-loss orders and initial target price levels:
- Gold: initial target price: $1,251; stop-loss: $1,382; initial target price for the DGLD ETN: $48.88; stop-loss for the DGLD ETN $37.48
- Silver: initial target price: $15.73; stop-loss: $18.06; initial target price for the DSLV ETN: $27.58; stop-loss for the DSLV ETN $19.17
- Mining stocks (price levels for the GDX ETF): initial target price: $21.03; stop-loss: $23.54; initial target price for the DUST ETF: $28.88; stop-loss for the DUST ETF $21.16
In case one wants to bet on junior mining stocks' prices (we do not suggest doing so – we think senior mining stocks are more predictable in the case of short-term trades – if one wants to do it anyway, we provide the details), here are the stop-loss details and initial target prices:
- GDXJ ETF: initial target price: $30.62; stop-loss: $36.14
- JDST ETF: initial target price: $59.68 stop-loss: $40.86
Long-term capital (core part of the portfolio; our opinion): No positions (in other words: cash)
Insurance capital (core part of the portfolio; our opinion): Full position
Important Details for New Subscribers
Whether you already subscribed or not, we encourage you to find out how to make the most of our alerts and read our replies to the most common alert-and-gold-trading-related-questions.
Please note that the in the trading section we describe the situation for the day that the alert is posted. In other words, it we are writing about a speculative position, it means that it is up-to-date on the day it was posted. We are also featuring the initial target prices, so that you can decide whether keeping a position on a given day is something that is in tune with your approach (some moves are too small for medium-term traders and some might appear too big for day-traders).
Plus, you might want to read why our stop-loss orders are usually relatively far from the current price.
Please note that a full position doesn’t mean using all of the capital for a given trade. You will find details on our thoughts on gold portfolio structuring in the Key Insights section on our website.
As a reminder – “initial target price” means exactly that – an “initial” one, it’s not a price level at which we suggest closing positions. If this becomes the case (like it did in the previous trade) we will refer to these levels as levels of exit orders (exactly as we’ve done previously). Stop-loss levels, however, are naturally not “initial”, but something that, in our opinion, might be entered as an order.
Since it is impossible to synchronize target prices and stop-loss levels for all the ETFs and ETNs with the main markets that we provide these levels for (gold, silver and mining stocks – the GDX ETF), the stop-loss levels and target prices for other ETNs and ETF (among other: UGLD, DGLD, USLV, DSLV, NUGT, DUST, JNUG, JDST) are provided as supplementary, and not as “final”. This means that if a stop-loss or a target level is reached for any of the “additional instruments” (DGLD for instance), but not for the “main instrument” (gold in this case), we will view positions in both gold and DGLD as still open and the stop-loss for DGLD would have to be moved lower. On the other hand, if gold moves to a stop-loss level but DGLD doesn’t, then we will view both positions (in gold and DGLD) as closed. In other words, since it’s not possible to be 100% certain that each related instrument moves to a given level when the underlying instrument does, we can’t provide levels that would be binding. The levels that we do provide are our best estimate of the levels that will correspond to the levels in the underlying assets, but it will be the underlying assets that one will need to focus on regarding the signs pointing to closing a given position or keeping it open. We might adjust the levels in the “additional instruments” without adjusting the levels in the “main instruments”, which will simply mean that we have improved our estimation of these levels, not that we changed our outlook on the markets. We are already working on a tool that would update these levels on a daily basis for the most popular ETFs, ETNs and individual mining stocks.
Our preferred ways to invest in and to trade gold along with the reasoning can be found in the how to buy gold section. Additionally, our preferred ETFs and ETNs can be found in our Gold & Silver ETF Ranking.
As a reminder, Gold & Silver Trading Alerts are posted before or on each trading day (we usually post them before the opening bell, but we don't promise doing that each day). If there's anything urgent, we will send you an additional small alert before posting the main one.
=====
Latest Free Trading Alerts:
The gold market seems to be very emotional and without any logic, but when you look closely, you will discover important forces in action. What are they? We invite you to read our today’s article about the fundamental drivers of the gold prices to find out what are the most important elements in the gold’s puzzle.
=====
Hand-picked precious-metals-related links:
PRECIOUS-Gold prices slip as surging US Treasury yields lift dollar
=====
In other news:
Dollar hits four-month high vs yen as U.S. Treasury yields rise
Reasons Why Global Growth Is Speeding Up, Not Slowing Down
Warren Buffett: Interest rates are the 'most important' thing in determining stock values
Live Now: Italy’s Five Star Says Final Government Plan Agreed
Crypto Wealth Sinks $52 Billion in One Week
=====
Thank you.
Sincerely,
Przemyslaw Radomski, CFA
Founder, Editor-in-chief, Gold & Silver Fund Manager
Gold & Silver Trading Alerts
Forex Trading Alerts
Oil Investment Updates
Oil Trading Alerts

