

Briefly: in our opinion, full (300% of the regular position size) speculative short positions in mining stocks are justified from the risk/reward point of view at the moment of publishing this Alert.
Gold’s yesterday’s intraday attempt to rally was not bullish. On the contrary, it was what usually happens right before a big slide. Especially given the USDX’s breakout.
Let’s start with the latter.
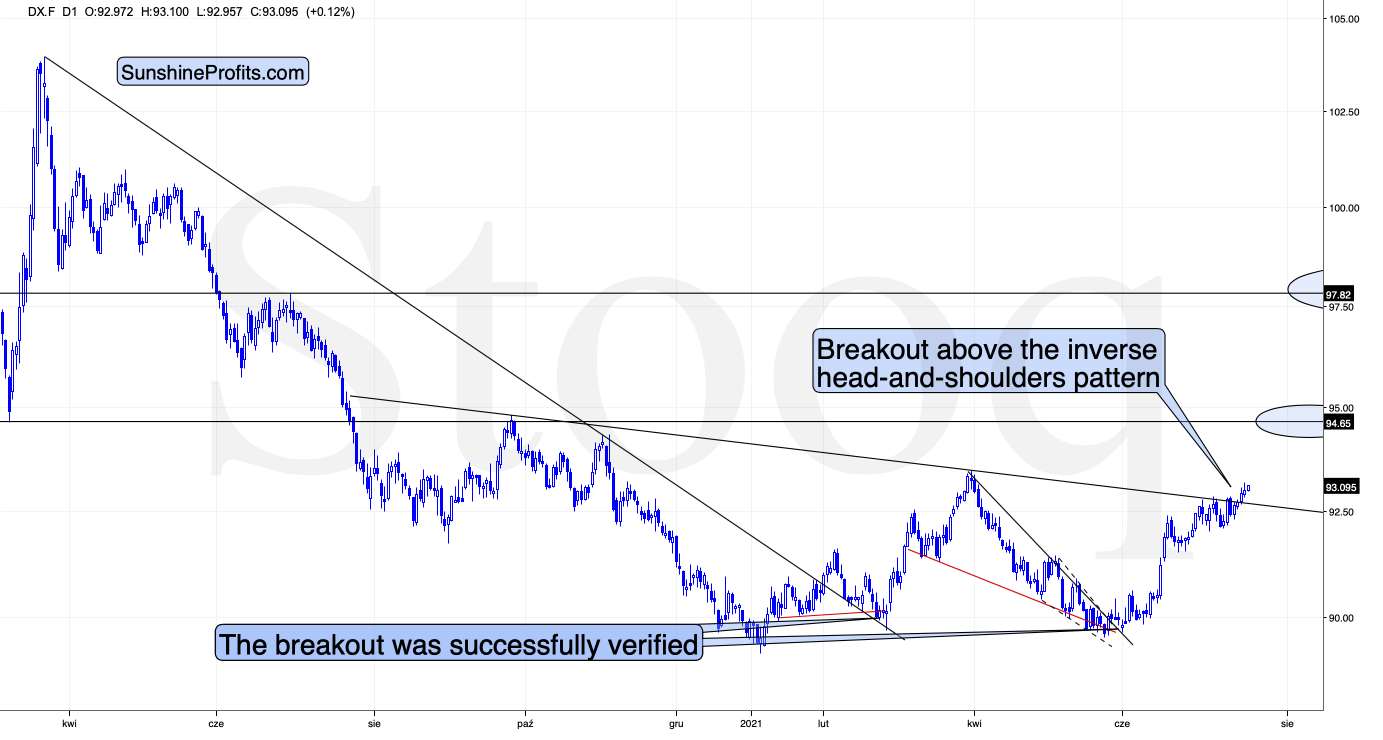
Yesterday there was a second session in a row when the USD Index closed above the neck level of the broad (~yearly) inverse head-and-shoulders pattern. Furthermore, it’s been moving slightly higher in today’s session, at least so far.
This is a very bullish price action – the USDX’s breakout was not accidental, nor was it based on geopolitical news (the latter tends to trigger temporary moves that are then reversed). Additionally, it was preceded by a consolidation. Consequently, it seems that this breakout has a huge chance of being confirmed (we need just one more – today’s – daily close) and followed by another sharp rally. The previous highs at about 94.5 are the initial upside target, but based on the inverse H&S pattern, the USDX is likely to rally to about 98.
Therefore, what just happened (the breakout above the formation’s neckline) has really bullish implications for the U.S. currency. And since the latter tends to move in the opposite direction to gold, silver, and mining stocks, it’s also very bearish for them.
Gold and Its Stocks
That would be enough on its own to make the outlook for the PMs bearish, but we have many more bearish indications, and some of them are truly profound. The most bearish confirmation of the bearish price prediction for gold doesn’t come from the USD Index but from the extreme underperformance of gold stocks relative to gold.
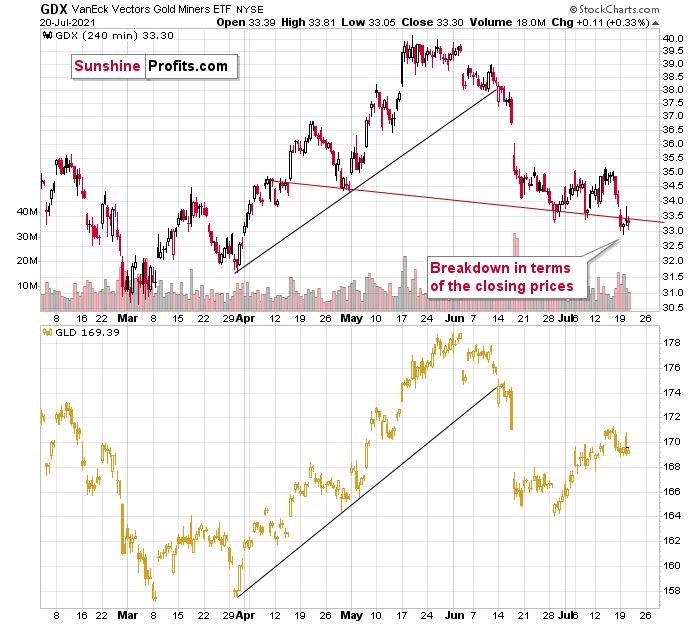
The GDX ETF (senior gold miners) moved below the recent lows, and it closed the day below the neck level of a head-and-shoulders pattern based on the 4-hour candlestick chart. At the same time, the GLD ETF is still relatively close to the middle of its previous decline. If the comparison is still unclear, please consider the mid-May bottom. The GLD ETF closed just slightly below it, while the GDX a few dollars below it.
And if you think this kind of relative weakness is bearish, just wait until you see what the junior mining stocks did.
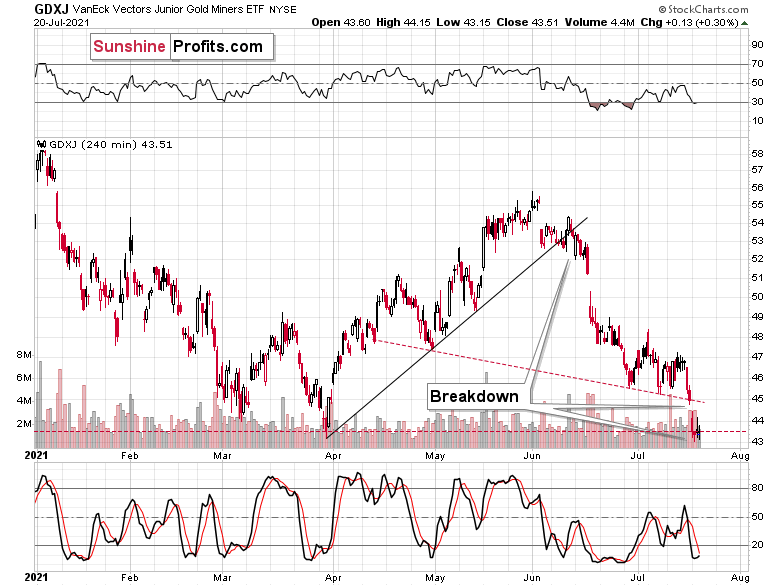
Junior miners declined not only below the neck level of the recent head-and-shoulders pattern (very clearly in both: intraday and closing price terms), but they actually closed the day at new 2021 lows! And they didn’t invalidate this breakdown yesterday, despite the intraday attempt!
There are two markets that primarily impact the performance of the junior mining stocks. One is gold, and the other is the general stock market. Gold is now about $140 above its 2021 lows, while the S&P 500 is over 16% above its 2021 highs. And yet, the GDXJ is below its previous 2021 lows. It seems that choosing junior miners as a proxy for shorting the precious metals sector was a good decision – our profits are rising rapidly, and it seems that they are going to soar much more in the following weeks.
What’s more, juniors are underperforming senior gold miners too. You can see that by comparing the two previous charts and by examining their ratio.
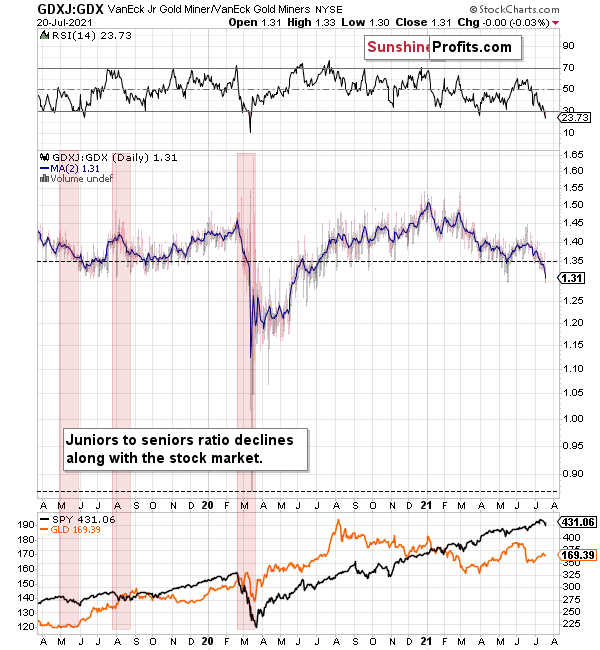
The ratio declines when junior miners underperform seniors. This happens often when the general stock market declines – juniors are more correlated with the latter than the seniors. Interestingly, juniors underperformed recently, even while stocks were strong. If the general stock market declines from here, the underperformance is likely to take an epic form – just as it did in early 2020.
This level of underperformance and weakness is truly breathtaking.
If miners – in particular, juniors – were able to decline so much without meaningful help from gold and the general stock market, just imagine the carnage they will suffer once this “help” finally arrives.
And given the breakout above the neck level of the inverse head-and-shoulders pattern in the USD Index, it seems like the key trigger to set the wheels in motion is already here.
Having said that, let’s take a look at the markets from a more fundamental point of view.
Riding the Bond Market’s Roller Coaster
With the U.S. 10-Year Treasury yield suffering a mild stroke, the hospitalization has helped gold recover from its recent plunge. However, with the Treasury benchmark extremely oversold, a reversal of fortunes could put the final nail in the yellow metal’s coffin.
Case in point: while over-positioning, the FED’s hawkish shift, unprecedented reverse repos, and the Delta variant have combined to suppress the long-end of the U.S. yield curve, the U.S. 10-Year Treasury yield is now trading at an all-time low relative to realized inflation.
Please see below:
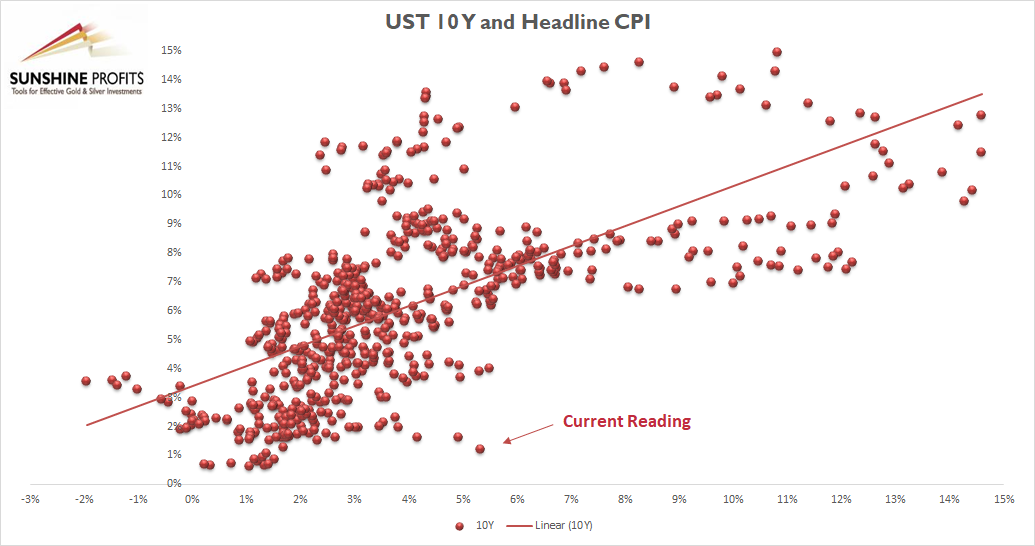
To explain, the scatterplot above depicts the relationship between the headline Consumer Price Index (CPI) and the U.S. 10-Year Treasury yield (available data dates back to 1967). For context, the headline CPI is plotted on the horizontal axis, while the U.S. 10-Year Treasury yield is plotted on the vertical axis. If you analyze the dot labeled “Current Reading,” you can see that the U.S. 10-Year Treasury yield has never been lower when the headline CPI has risen by 5% or more year-over-year (YoY). In fact, even if the headline CPI declined to the U.S. Federal Reserve’s (FED) 2% YoY target, a U.S. 10-Year Treasury yield at 1.22% would still be the lowest relative reading of all time.
However, with inflation surging and the FED’s revised 3% core Personal Consumption Expenditures (PCE) Index forecast still too low, subsequent inflation readings have to be near zero for the projection to hold.
Please see below:
 Source: Robin Brooks/Institute of International Finance (IIF)
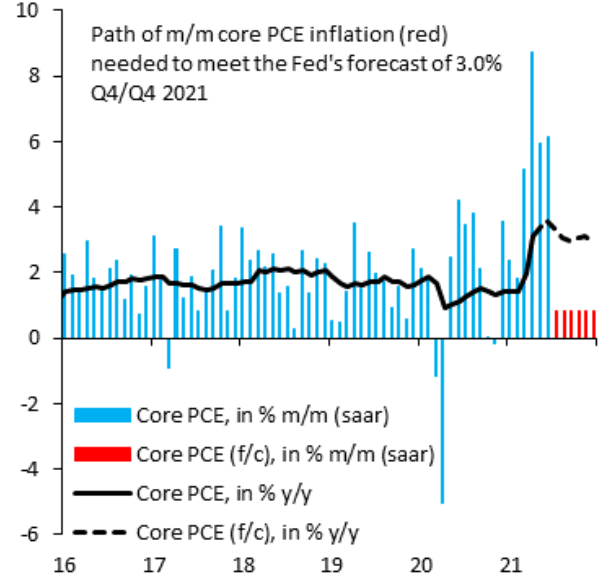
To explain, the blue bars above represent the month-over-month (MoM) percentage change in the core CPI, while the black line above depicts the YoY percentage change in the core CPI. If you analyze the red bars on the right side of the chart, they represent the future MoM readings (roughly zero) that are required for the FED to reach its annual target. As a result, an overshoot still remains the most likely outcome.
As evidence, the Philadelphia FED released its Nonmanufacturing Business Outlook Survey on Jul. 20. An excerpt from the report read:
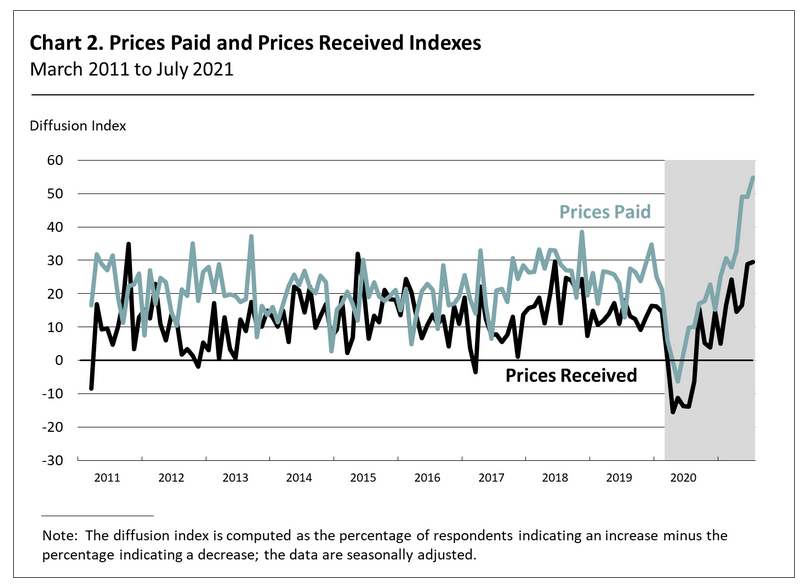
“Price increases were more widespread this month. The prices paid index had hit its all-time high in May, but the index this month climbed 6 points above that mark to 54.8. More than 55 percent of the respondents reported increases in their input prices, and only 1 percent reported decreases. Just about one-third of the respondents reported stable input prices. Regarding prices for firms’ own goods and services, the prices received index inched up from a reading of 28.9 in June to 29.5 in July. The share of firms reporting increases in prices received (34 percent) exceeded the share reporting decreases (4 percent). Most firms (54 percent) reported steady prices for their own goods and services.”
Please see below:
 Source: Philadelphia FED
Wages’ Ascent Is Not Slowing Down
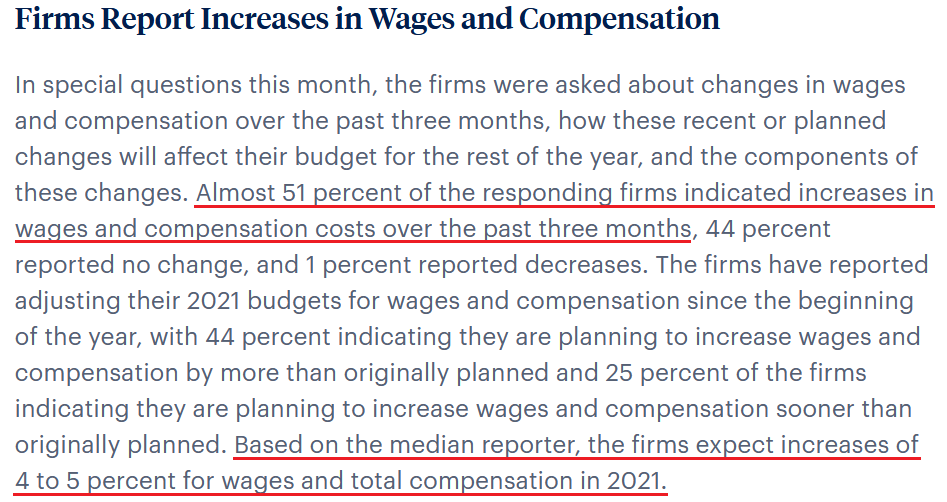
On top of that, wage inflation is showing no signs of slowing down:
 Source: Source: Philadelphia FED
In addition, while investors fret over the Delta variant and its potential to upend the global economy, the Philadelphia FED’s “index for future activity at the firm level increased from 74.0 in June to 79.2,” an all-time high, and “over 80%of the firms expect an increase in activity at their firms over the next six months, compared with 1%that expect decreases and 18%that expect no change.”
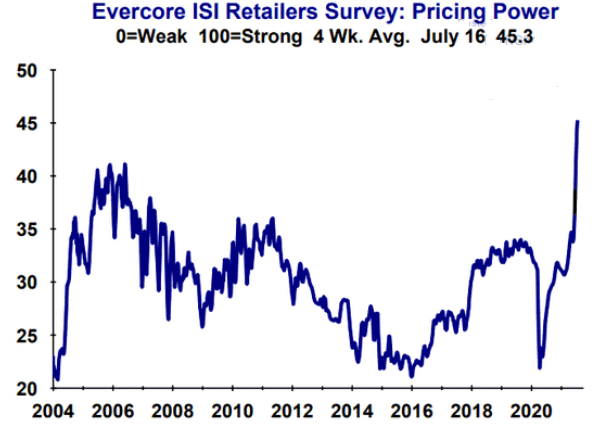
Likewise, Evercore ISI’s gauge of retailers’ pricing power has risen once again. For context, from Jun. 8 to Jun. 25, the metric increased from 37.9 to 41.1. And with the latest reading at 45.3, department stores continue to have their pedal to the inflationary metal.
Please see below:
Will Delta Change Anything?
Circling back to the Delta variant, J.P. Morgan found that regions where more than 50% of the population has received at least one dose of a COVID-19 vaccine remain largely unaffected by the new coronavirus strain.
Please see below:
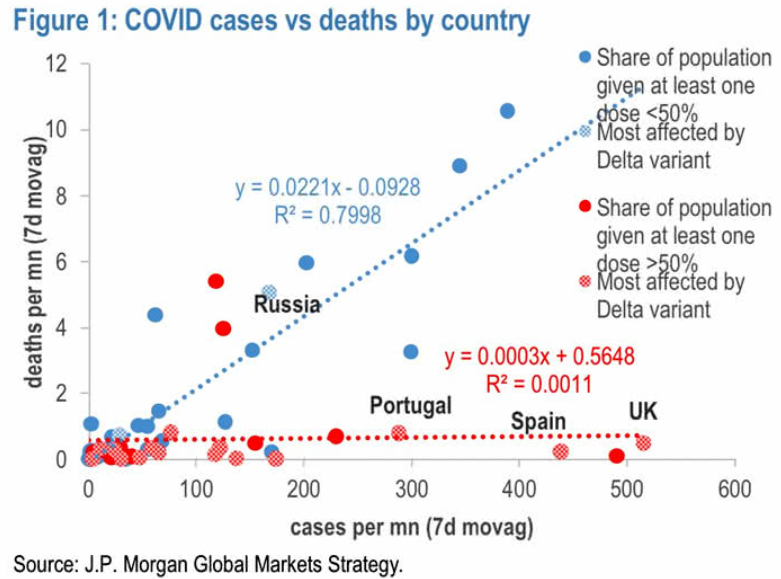
To explain, the red and blue dots above compare the countries where more than(or less than) 50% of the population has received at least one dose of a COVID-19 vaccine (the checkered red dots are the regions most affected by the Delta variant). If you analyze the relationship, you can see that while most countries have seen a material uptick in cases (the horizontal axis), countries with high vaccination rates have not seen an uptick in coronavirus-related deaths (the vertical axis). For context, the U.K. is the best example (labeled checkered red), and the data indicates that vaccinations are protecting citizens from serious illness.
Moreover, with COVID-19 already past its one-year anniversary, citizens are more confident about their health and are demonstrating a willingness to re-engage in social activities.
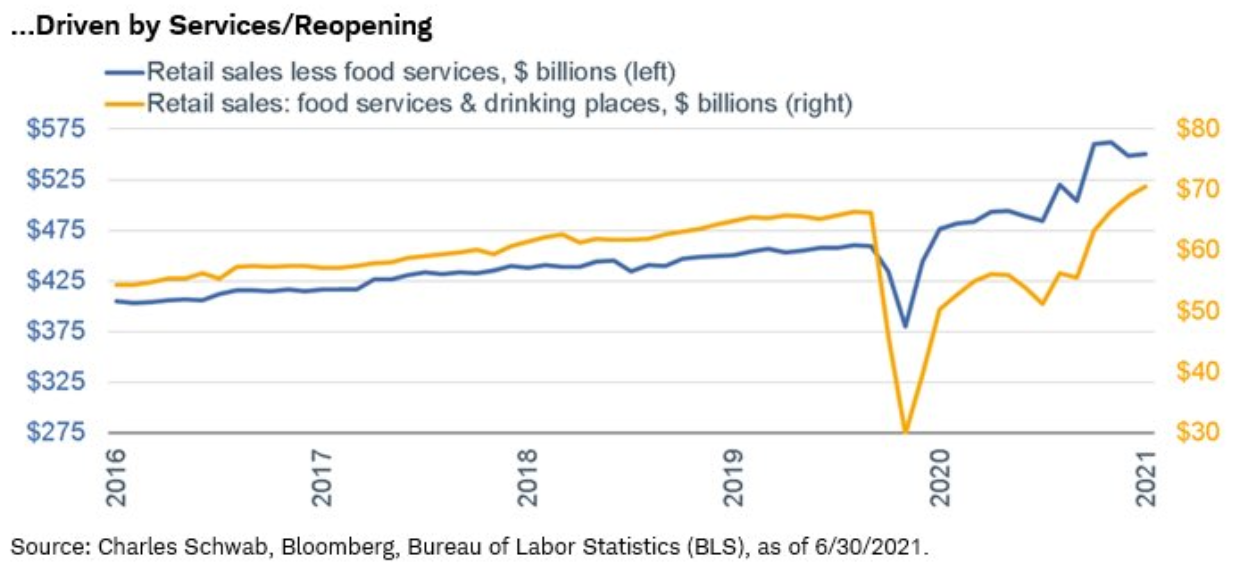
To explain, the blue line above tracks U.S. retail sales excluding food services, while the gold line above isolates retail sales at food and drink establishments. If you analyze the trend, you can see that the gold line has been a relative outperformer in recent months. And with U.S. citizens eager to resume in-person activities, economic laggards (services) are making a major comeback.
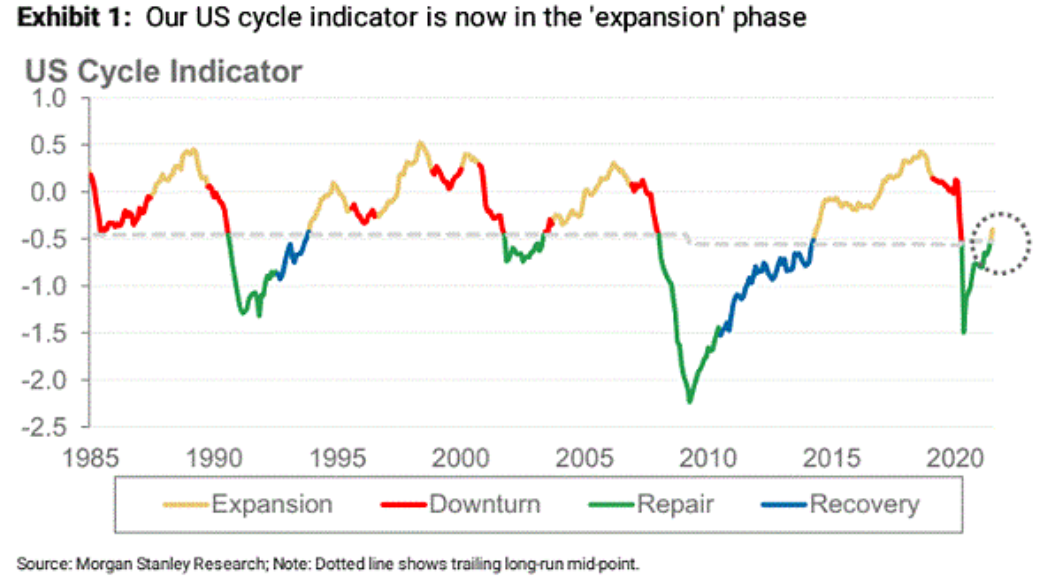
On top of that, Morgan Stanley’s “cycle indicator” has just moved from “repair” to “expansion.” And with expansionary periods often lasting several years, a U.S. 10-Year Treasury yield at 1.22% defies U.S. economic strength.
Please see below:
Is Housing Inflation Underestimated?
Finally, while the bond market is all-in on the FED’s “transitory” narrative, billionaire hedge fund manager Bill Ackman supported our view on Jul. 19, telling CNBC that the Shelter CPI could be the next shoe to drop:
“I’m in more of closer to the new normal with respect to many sources of inflation so one I think inflation is understated. You know, there’s very, very significant kind of, talk about home equivalent rent or ownership equivalent rents and those are really understated…. You’re seeing housing prices go way up, I think the way the data is collected for, you know, the kind of CPI or other inflation numbers really understate what’s going on in housing and that’s, you know, approaching a third of inflation. There’s housing inflation, there’s real wage inflation. I think you’re going to have to pay people to come to work and I think that’s actually a big positive, it’s probably a long-term positive for the economy.”
And where does he think that bond yields are headed over the medium term?
 Source: CNBC
In conclusion, the PMs remain sedated and unsure of whether to rise, fall, or simply stay where they are. However, given their inability to gain any meaningful traction when the U.S. 10-Year Treasury yield is trading at an all-time low (relative to the realized headline CPI), their anxiety is extremely bearish. Moreover, with the USD Index only a hair away from 93 (a key level) and surging inflation likely to force the FED’s hand in September, the PMs encounter villains at nearly every turn. As a result, while they’re still holding out hope for a Hollywood ending, reality likely won’t be so kind.
Overview of the Upcoming Part of the Decline
- The corrective upswing in gold might already be over, and another huge decline is likely just around the corner. In fact, it seems to be well underway in the case of mining stocks, especially junior miners.
- After miners slide in a meaningful and volatile way, but silver doesn’t (and it just declines moderately), I plan to switch from short positions in miners to short positions in silver. At this time, it’s too early to say at what price levels this would take place – perhaps with gold close to $1,600. I plan to exit those short positions when gold shows substantial strength relative to the USD Index, while the latter is still rallying. This might take place with gold close to $1,350 - $1,500 and the entire decline (from above $1,900 to about $1,475) would be likely to take place within 6-20 weeks, and I would expect silver to fall the hardest in the final part of the move. This moment (when gold performs very strongly against the rallying USD and miners are strong relative to gold – after gold has already declined substantially) is likely to be the best entry point for long-term investments, in my view. This might also happen with gold close to $1,475, but it’s too early to say with certainty at this time.
- As a confirmation for the above, I will use the (upcoming or perhaps we have already seen it?) top in the general stock market as the starting point for the three-month countdown. The reason is that after the 1929 top, gold miners declined for about three months after the general stock market started to slide. We also saw some confirmations of this theory based on the analogy to 2008. All in all, the precious metals sector would be likely to bottom about three months after the general stock market tops.
- The above is based on the information available today, and it might change in the following days/weeks.
Please note that the above timing details are relatively broad and “for general overview only” – so that you know more or less what I think and how volatile I think the moves are likely to be – on an approximate basis. These time targets are not binding or clear enough for me to think that they should be used for purchasing options, warrants or similar instruments.
Summary
To summarize, it seems that gold has already formed its short-term top and – based i.a. on the completed inverse head-and-shoulders pattern in the USD Index – gold is likely to fall substantially in the following weeks. Gold stocks’ exceptionally weak performance has been indicating that for many weeks, and given juniors’ breakdown to new yearly lows, it seems that the storm has already begun.
It seems that our profits on the short position in the junior mining stocks are going to grow substantially in the following weeks.
After the sell-off (that takes gold to about $1,350 - $1,500), I expect the precious metals to rally significantly. The final part of the decline might take as little as 1-5 weeks, so it's important to stay alert to any changes.
Most importantly, please stay healthy and safe. We made a lot of money last March and this March, and it seems that we’re about to make much more on the upcoming decline, but you have to be healthy to enjoy the results.
As always, we'll keep you - our subscribers - informed.
By the way, we’re currently providing you with the possibility to extend your subscription by a year, two years or even three years with a special 20% discount. This discount can be applied right away, without the need to wait for your next renewal – if you choose to secure your premium access and complete the payment upfront. The boring time in the PMs is definitely over, and the time to pay close attention to the market is here. Naturally, it’s your capital, and the choice is up to you, but it seems that it might be a good idea to secure more premium access now while saving 20% at the same time. Our support team will be happy to assist you in the above-described upgrade at preferential terms – if you’d like to proceed, please contact us.
To summarize:
Trading capital (supplementary part of the portfolio; our opinion): Full speculative short positions (300% of the full position) in mining stocks are justified from the risk to reward point of view with the following binding exit profit-take price levels:
Mining stocks (price levels for the GDXJ ETF): binding profit-take exit price: $37.12; stop-loss: none (the volatility is too big to justify a stop-loss order in case of this particular trade)
Alternatively, if one seeks leverage, we’re providing the binding profit-take levels for the JDST (2x leveraged) and GDXD (3x leveraged – which is not suggested for most traders/investors due to the significant leverage). The binding profit-take level for the JDST: $15.96; stop-loss for the JDST: none (the volatility is too big to justify a SL order in case of this particular trade); binding profit-take level for the GDXD: $37.02; stop-loss for the GDXD: none (the volatility is too big to justify a SL order in case of this particular trade).
For-your-information targets (our opinion; we continue to think that mining stocks are the preferred way of taking advantage of the upcoming price move, but if for whatever reason one wants / has to use silver or gold for this trade, we are providing the details anyway.):
Silver futures upside profit-take exit price: unclear at this time - initially, it might be a good idea to exit, when gold moves to $1,683
Gold futures upside profit-take exit price: $1,683
HGD.TO – alternative (Canadian) inverse 2x leveraged gold stocks ETF – the upside profit-take exit price: $12.88
Long-term capital (core part of the portfolio; our opinion): No positions (in other words: cash
Insurance capital (core part of the portfolio; our opinion): Full position
Whether you already subscribed or not, we encourage you to find out how to make the most of our alerts and read our replies to the most common alert-and-gold-trading-related-questions.
Please note that we describe the situation for the day that the alert is posted in the trading section. In other words, if we are writing about a speculative position, it means that it is up-to-date on the day it was posted. We are also featuring the initial target prices to decide whether keeping a position on a given day is in tune with your approach (some moves are too small for medium-term traders, and some might appear too big for day-traders).
Additionally, you might want to read why our stop-loss orders are usually relatively far from the current price.
Please note that a full position doesn't mean using all of the capital for a given trade. You will find details on our thoughts on gold portfolio structuring in the Key Insights section on our website.
As a reminder - "initial target price" means exactly that - an "initial" one. It's not a price level at which we suggest closing positions. If this becomes the case (like it did in the previous trade), we will refer to these levels as levels of exit orders (exactly as we've done previously). Stop-loss levels, however, are naturally not "initial", but something that, in our opinion, might be entered as an order.
Since it is impossible to synchronize target prices and stop-loss levels for all the ETFs and ETNs with the main markets that we provide these levels for (gold, silver and mining stocks - the GDX ETF), the stop-loss levels and target prices for other ETNs and ETF (among other: UGL, GLL, AGQ, ZSL, NUGT, DUST, JNUG, JDST) are provided as supplementary, and not as "final". This means that if a stop-loss or a target level is reached for any of the "additional instruments" (GLL for instance), but not for the "main instrument" (gold in this case), we will view positions in both gold and GLL as still open and the stop-loss for GLL would have to be moved lower. On the other hand, if gold moves to a stop-loss level but GLL doesn't, then we will view both positions (in gold and GLL) as closed. In other words, since it's not possible to be 100% certain that each related instrument moves to a given level when the underlying instrument does, we can't provide levels that would be binding. The levels that we do provide are our best estimate of the levels that will correspond to the levels in the underlying assets, but it will be the underlying assets that one will need to focus on regarding the signs pointing to closing a given position or keeping it open. We might adjust the levels in the "additional instruments" without adjusting the levels in the "main instruments", which will simply mean that we have improved our estimation of these levels, not that we changed our outlook on the markets. We are already working on a tool that would update these levels daily for the most popular ETFs, ETNs and individual mining stocks.
Our preferred ways to invest in and to trade gold along with the reasoning can be found in the how to buy gold section. Furthermore, our preferred ETFs and ETNs can be found in our Gold & Silver ETF Ranking.
As a reminder, Gold & Silver Trading Alerts are posted before or on each trading day (we usually post them before the opening bell, but we don't promise doing that each day). If there's anything urgent, we will send you an additional small alert before posting the main one.
Thank you.
Przemyslaw Radomski, CFA
Founder, Editor-in-chief

