

Briefly: in our opinion, full (250% of the regular position size) speculative short positions in mining stocks are justified from the risk/reward point of view at the moment of publishing this Alert.
The Covid-19 daily cases in the US jumped to new highs yesterday.
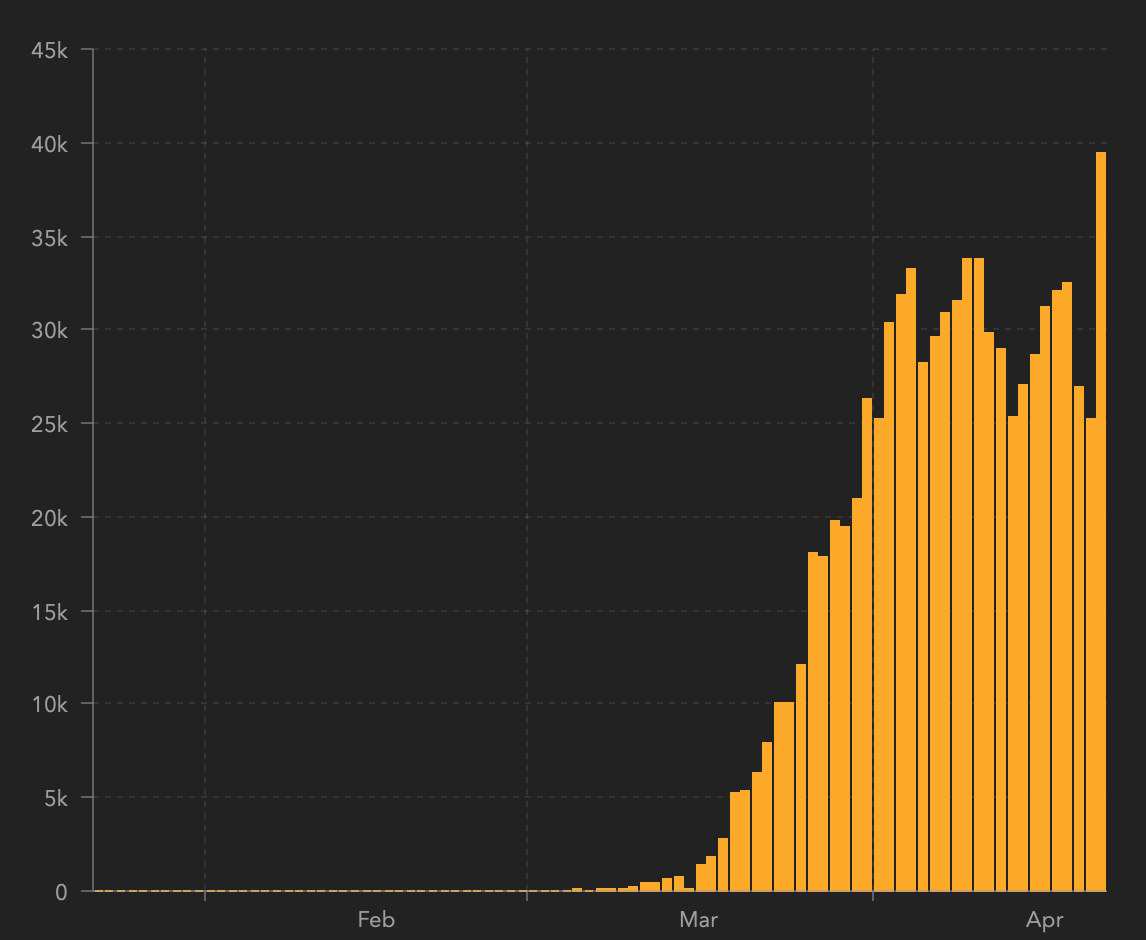
This makes it clear that based on the Trump US economy re-opening plan, it will likely take weeks, if not months, before we can see the latter. At least to a degree that really matters.
The stock market, commodities, and the USD Index are already starting to react to it, and following their own technical patterns. Let's check what they just did, starting with the latter.
USDX in Focus
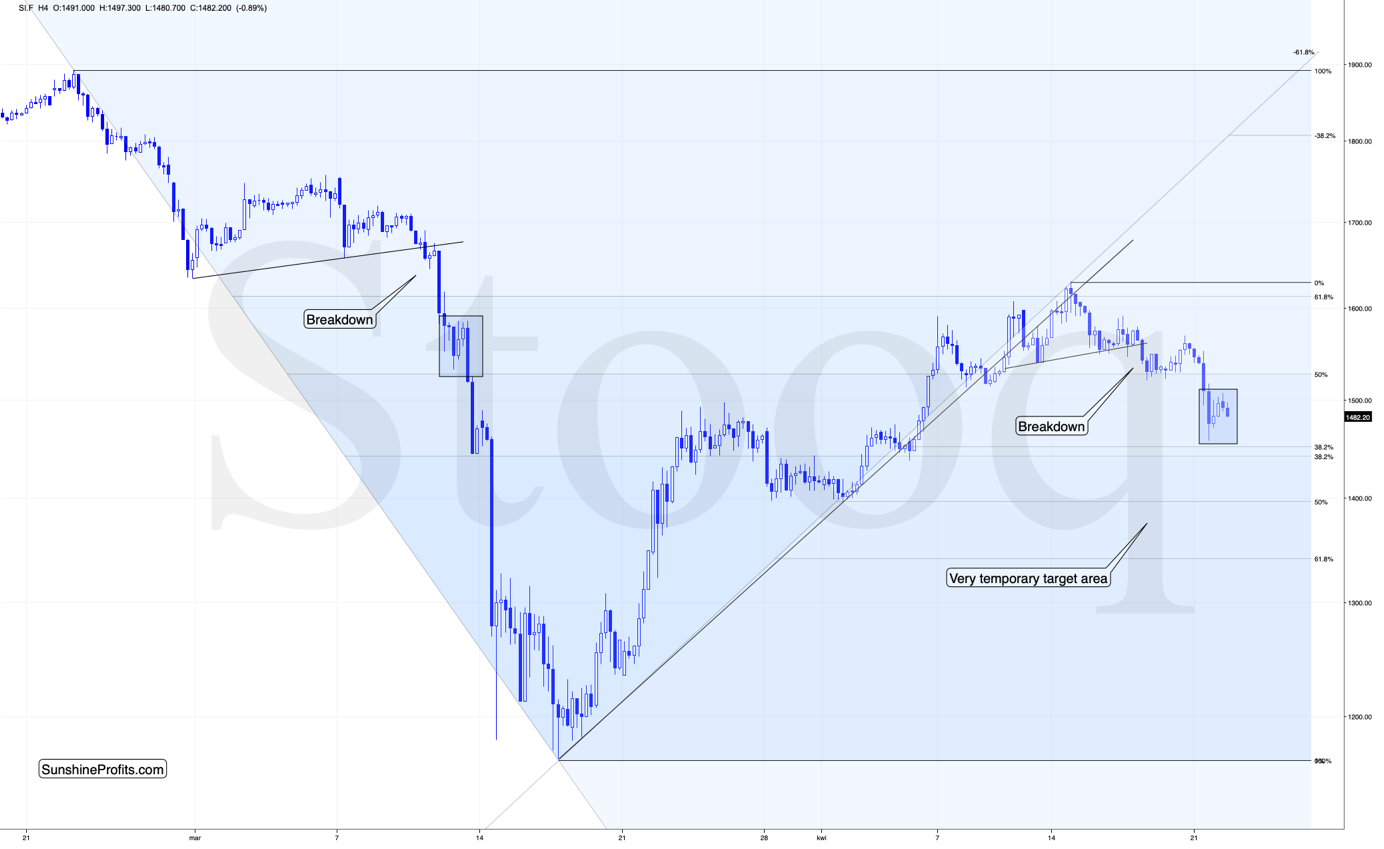
In short, the self-similarity to early-March continues, which means that our previous comments on the above chart remain up-to-date with a slight modification:
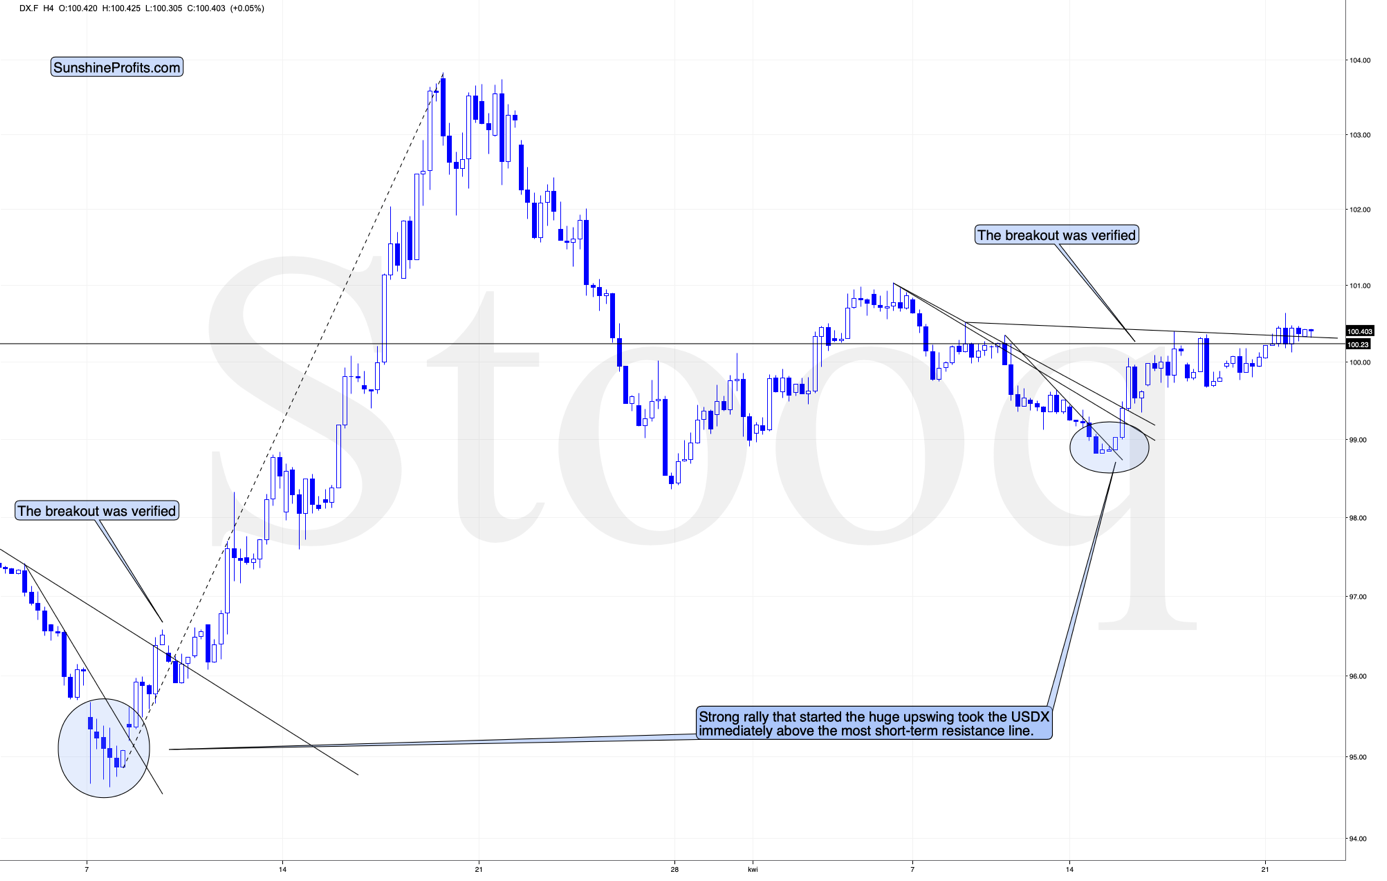
The USD index soared after forming an intraday reversal. It then declined, rallied back up, and declined quickly once again - all just as it did in early March.
The final 4-hour decline was sharp and it took place as the USDX broke below the rising support line that was based on the early intraday lows. We saw the analogous decline on Friday, and the USD Index has been moving slowly up since that time. Both situations are very similar from the pattern point of view.
Back then, the analogous price action triggered further upswings, which translated into lower prices of the precious metals. The bearish implications remains in place at this time as well.
Please note that the recent price action also almost created an inverse head and shoulders pattern (we'll have H&S patterns in other markets as well). Once the USD Index breaks above the mid-April highs, the pattern will be complete, and it would like result in a rally to about 102 level.
The modified update is that the inverse H&S pattern was already completed. Regardless of whether one chooses to draw the neckline of the pattern by connecting the 4-hour closes, or based on the recent intraday highs, we saw a breakout and it is being verified at the moment of writing these words.
Stock Market Lessons for Gold
In yesterday's analysis, we wrote the following about the breakdown below the rising support line:
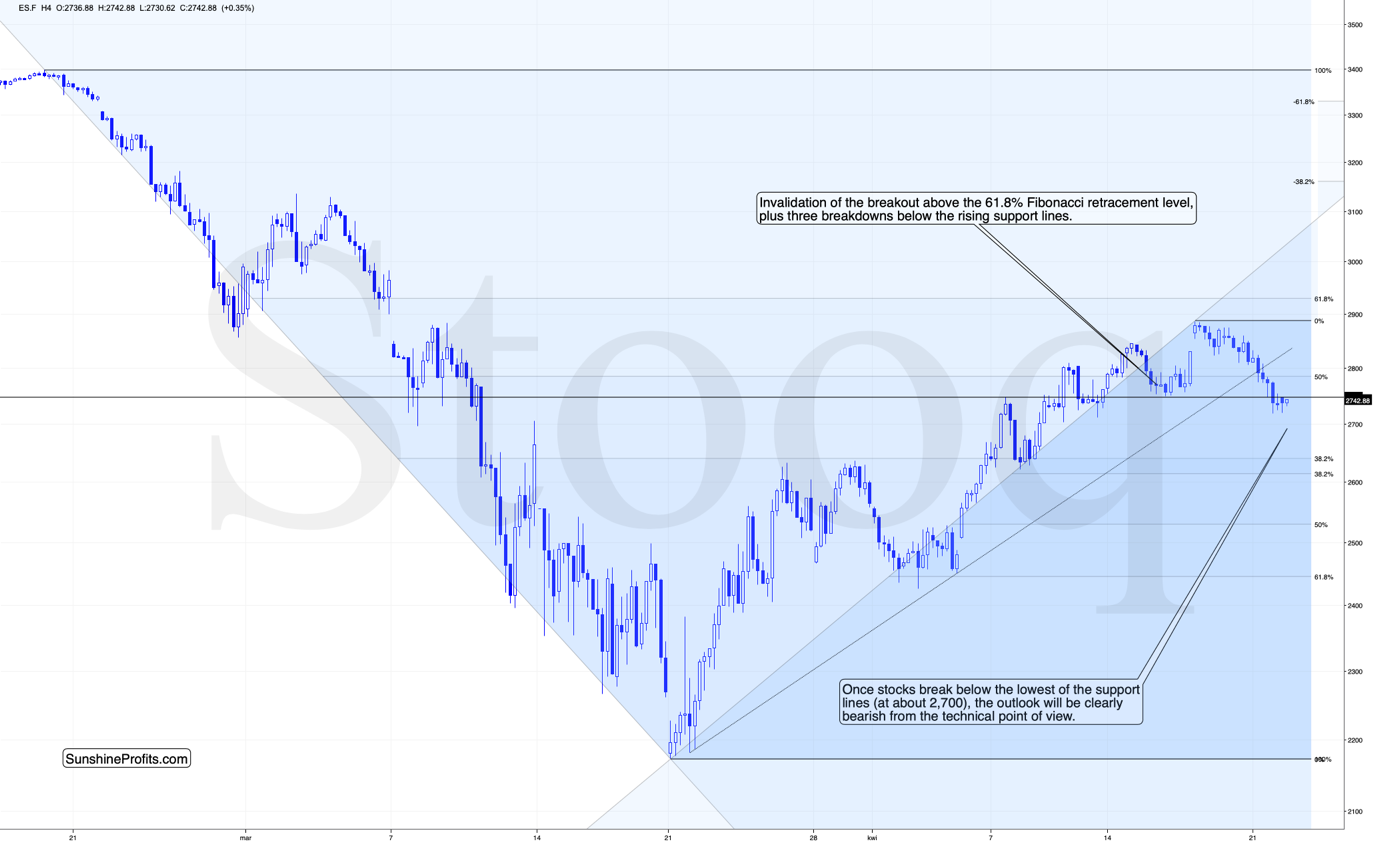
The breakdown below these lines is a major bearish sign and something that is likely to lead to further deterioration in the stock market. As the protests against the lockdown keep popping up, the odds for the end of the lockdown actually decreased, as people participating in the protests usually don't wear masks and don't adhere to the social distancing rules. The same with Florida beaches. And there are countries when things are even worse with regard to social distancing violations.
All this increases the news-based odds for a decline in the stock market and a rally in the USD Index. However, the above chart - and the breakdown - provide the technical evidence that the next decline is quite likely already underway.
The breakdown did lead to lower stock market values. Stocks have now paused at one of their previous lows, but it doesn't seem that this low would be able to hold the decline for much longer.
What is not clear at first sight, but is actually important, is that stocks are now moving back and forth below the April 7th high. Once the breakdown is verified, we should see a quick slide to the following low that coincides with the Fibonacci-based retracements - at about 2,630. The next stop would be the April lows that coincide with the 61.8% Fibonacci retracement at about 2,440.
If all or most of the major stock markets are about to fall, where will people turn to for safety? To the world's reserve currency: the US dollar. To gold as well, but not necessarily right away.
Why? Because it seems likely that gold is getting ready for a slide below $1,600.
Topping Gold
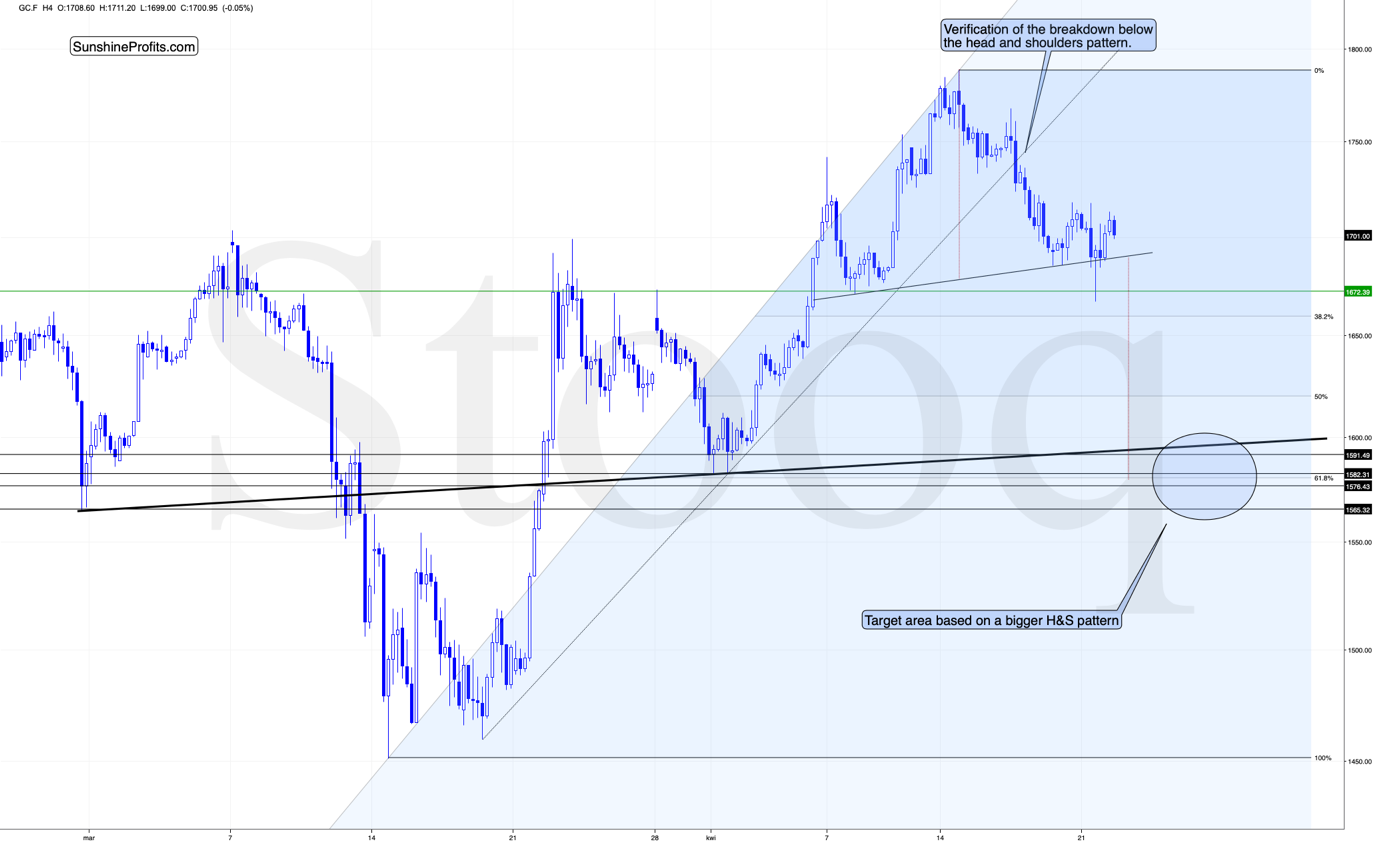
Gold recently invalidated the breakout above the $1,700 level and the breakout above the inverse head-and-shoulders formation in intraday terms. This is a major sell confirmation.
However, it seems to have also invalidated the bearish head and shoulders formation in intraday terms. But has it? It wasn't clear whether the right shoulder of the formation was already completed or if it was still being formed. Also, if we use the 4-hour closing prices instead of the intraday moves, then there was barely any breakdown below the neck level to speak of.
Anyway, as the USD Index is verifying the breakout above its own inverse head and shoulders pattern, the odds for a continuation in gold's head and shoulders pattern have greatly increased. While the formation is likely still underway, it's likely to be completed shortly - perhaps as early as today.
The target based on this formation is at about $1,580 - right in the middle of our interim target area. The other nearby support lines that create the area, are the 61.8% Fibonacci retracement based on the entire March - April rally, and the horizontal support lines based on the late-February and early-April lows (in terms of both intraday lows and the 4-hour closes).
There's one more thing that makes the completion of the H&S pattern in gold likely: silver.
Silver Breaks Below Its Head and Shoulders Pattern
The head and shoulders pattern in silver was already completed. The white metal declined profoundly yesterday, and this move was not invalidated in the following hours.
Silver corrected somewhat, and it was not only normal, but also in near-perfect tune with what it did in mid-March, right before sliding below $12. While silver might bottom (temporarily) higher this time, the sharp slide is a good indication that the big move lower in the precious metals market is already underway.
It's very important that we have all these signs from the USD Index, general stock market, and silver, because otherwise, one might incorrectly interpret the situation in mining stocks.
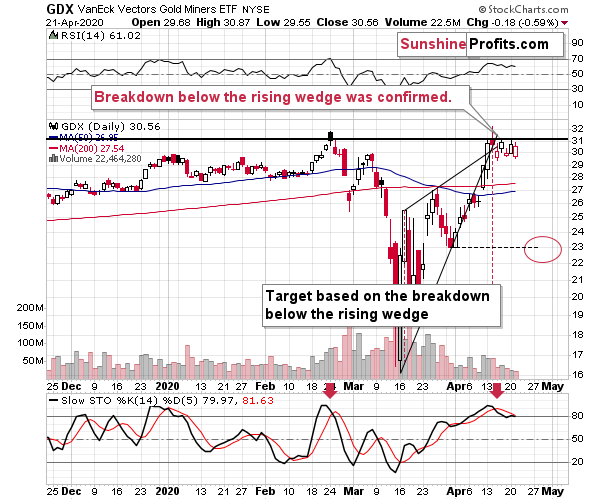
At first sight, it seems that miners are consolidating and that they might be actually getting ready to break to new 2020 highs.
Knowing the details that we outlined previously, tells you just how unlikely that is.
The GLD ETF was almost flat yesterday, so it shouldn't be that surprising that miners didn't do much. After all, our comments from yesterday's Alert, remain up-to-date:
So, why are the miners still relatively high, while gold moved visibly below their previous highs? There are three possible explanations, and it seems likely that they all play an important part:
- Gold futures rallied profoundly recently, but other proxies for gold, for instance the GLD ETF didn't move as high. And then, they didn't decline as significantly as gold futures did. Consequently, gold miners' reaction might not be so muted - instead, we might be comparing it to the most volatile proxy for gold investment.
- Gold miners are not only correlated with gold, but also with the general stock market. As the general stock market didn't decline significantly so far, neither did miners.
- It is quite often the case that the weakest part of a given market acts particularly strong at the end of the rally, as the investment public enters the market and buys everything that looks cheap, regardless of the reasons that made these assets so cheap in the first place. Miners were one of the worst performing parts of the general stock market - at least during the March decline. It could be the case that miners' strong performance in the recent days is simply a consequence of a topping stock market.
All in all, the situation for the mining stocks didn't improve, even though it might appear to be the case at the first sight.
Before summarizing, we would like to show you one additional chart featuring miners. We will compare the junior miners to what GLD ETF and SPY did. The latter are ETFs representing gold and the S&P 500.
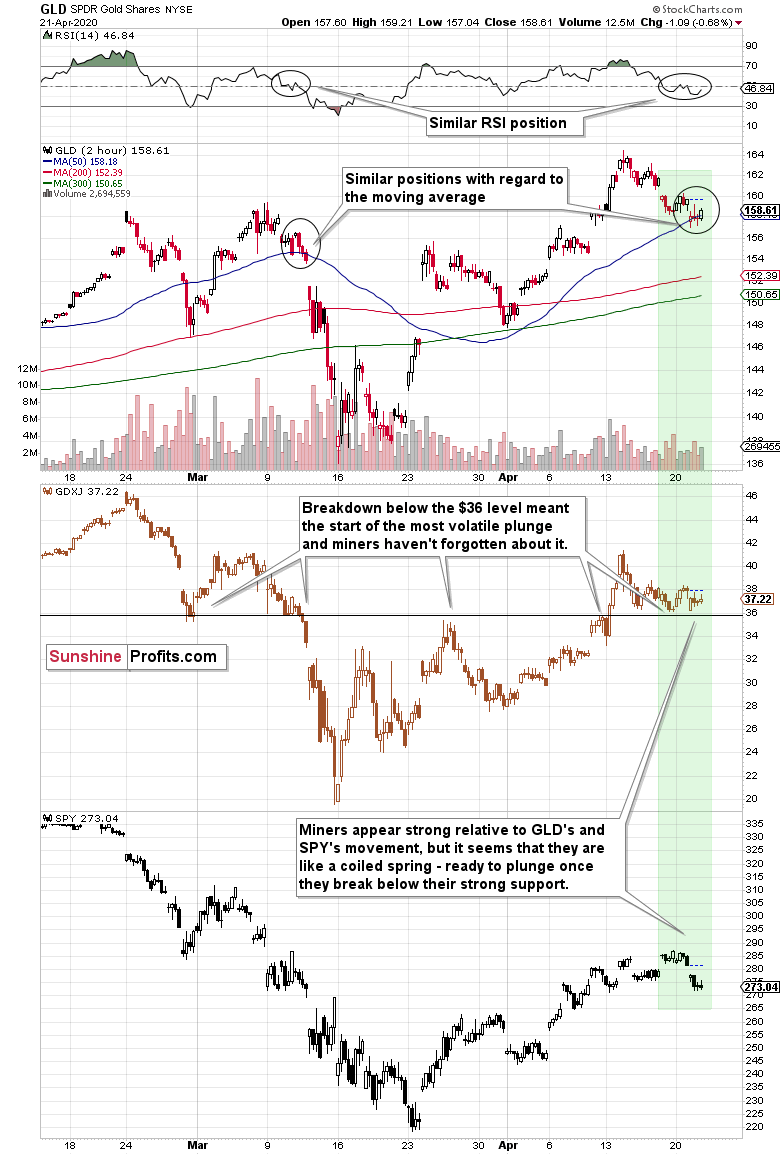
We zoomed in to the 2-hour chart to show you something specific that happened in the last few days and to provide the likely explanation for it.
Namely, the miners started to show odd strength relative to both: GLD and SPY, and we marked it with a green rectangle.
The relative strength started in the final part of the previous week, when the GDXJ approached the $36 level. Instead of falling further, just like GLD did - or at least like the SPY did on Tuesday - the GDXJ stayed above it.
The gold trading tip for today would be always question such situations before taking them at face value. Why would that be the case? What factor could have been strong enough to trigger such strength? Or maybe - in the absence of such a factor - was the mining stock sector really strong enough to withstand the powerful bearish forces in the form of declining GLD and SPY?
There is a good reason for the miners' "strength". It's the $36 price level itself. Or, more precisely, the strong support that it provides.
This is the price level from which junior miners rallied in early March.
This is the price level at which juniors reversed on an intraday basis on March 9th.
This is the price level that stopped the decline on March 10th.
And this is the price level that - once broken on March 11th - triggered waterfall selling that quickly took the GDXJ below $20.
This is also the levels that stopped the late-March rally, and the level that initially served as resistance on April 9th.
It also served as support after the initial - April 15th - decline.
Given that this price level worked as both: support and resistance so many times, is it really surprising that without a major breakdown back below the previous 2020 highs in the GLD ETF, this level is holding strong?
It's absolutely normal. Let's not overestimate this support's importance, though. This level doesn't invalidate the bearish gold price forecast, it only changes its shape a bit. Instead of declining just like GLD, the GDXJ is taking a breather above $36, but once GLD moves decisively lower, the GDXJ would be likely to break below this level, and slide profoundly - catching up with the pace of the slide.
Please note what happened on April 9th and April 13th. The miners first declined (about $2) based on the resistance, but once they finally broke above the $36 level, they soared until topping almost $6 higher. What's happening now? The GDXJ moved higher first (about $2) and as soon as it gets the bearish lead from gold, it's likely to catch up, by breaking below the $36 level, and sliding much further.
The very same chart features a specific self-similarity suggesting that the junior miners are likely to get this kind of bearish kick shortly. Not only is the current situation in the GDXJ itself very similar to what happened in mid-March, right before the slide, and right before the breakdown below $36 - it's also the case with the GLD ETF.
The GLD is moving back and forth around its blue moving average, while the RSI indicator (note: everything on the chart is based on the 2-hour candlesticks, not the daily candlesticks) is moving around the 50 level.
The similarity in each ETF on a stand-alone basis might just raise an eyebrow, but the fact that both similarities aligned at the same time - along with a breakdown in the general stock market and rallying USD Index - should make one's both eyes wide open.
The next big move for the precious metals market is likely to be down, and it's likely to be really significant.
Finally, before summarizing, we would like to reply to questions that we received recently.
From the Readers' Mailbag
Q: I have a fundamental question as it relates to Gold projections and models and charting. Could it be that because the entire US economy is shut down and the shutdown is for an extended period of time by the US government and that the entire Global economies are on shutdown for an extended period of time, That Gold models and charting assumptions as well as predictions maybe altered ? Could the gold cycles that you have plotted and used on your models be impacted and not reflect consistencies of past Gold cycle trend lines and timing periods? This question is not limited to your model alone but to everyone. Additionally computer trading and algorithms accelerating time lines and volatility in mix.
A: "There are some things in this world, captain, that will never change... Some things do change."
The above quote from The Matrix is a quite good summary of our reply. The key things don't change. Greed doesn't change, and most of all, fear doesn't change. The way people sense them doesn't really change. Of course, individuals may learn to better deal with them, but overall, they will remain present. And as long as they remain present, and the market forces are allowed to dictate the price movement, at least to a major extent (no market is fully free given that the interest rates are controlled, for example), the prices will move from extreme greed (tops) to extreme fear (bottoms) and vice versa.
These are the key assumptions behind the techniques that we use. And they won't change.
A given self-similar pattern might be broken or invalidated. But not the entire concept of self-similarity. The price patterns will continue to be similar to each other in one way or another, as people react to good or bad news relatively similarly. There are some exceptions, like what happened in crude oil due to specific situation in this particular market.
Shutdown is similar to a crisis, recession, or a depression, and all of them took place in the past. Their economic implications vary, but overall, they cause fear (and greed after prices get too low temporarily). They trigger people's decisions to buy or sell, and people react in similar ways to similar price moves in the recent past. We just saw the popular head and shoulders formation at work in gold and silver.
What changes temporarily, is the volatility. The trading techniques that were based on calm times only have to be adjusted or their application should be paused until the situation returns to how it was previously. This is the case with our Day Trading Signals, for example - they were exceptionally profitable during normal times, but we quickly discovered that their performance was not as good during the current state of the market. Consequently, we paused them in their current form, while at the same time fine-tuning our different day trading model that should work much better in this kind of environment (with actually an even better risk to reward ratio).
What we do in Gold & Silver Trading Alerts is based on both: periods of low volatility and periods of huge volatility, which is why we were able to correctly pinpoint the March slide and the mid-March bottom. At this time our analysis points to the decline's continuation.
Summary
Summing up, the outlook for the precious metals market remains bearish for the next few weeks. In fact, based on the way the USD Index moved last week, it seems that the top in the PMs and miners is already in and the final part of the decline has already started.
Gold showed exceptional weakness by invalidating the inverse head-and-shoulders pattern and closing the previous week below $1,700 despite almost no help from the USD Index, which is a screaming sell indication.
Even though mining stocks moved higher on Monday, their technical picture remains bearish. Silver's slide confirms that this is the real direction in which the market is moving.
If you've been staying on the sidelines, or have been waiting for a good moment to add to the short positions (or open them at all), in our opinion, this is a good moment to do so. The risk to reward ratio appears particularly favorable right now.
After the sell-off, we expect the precious metals to rally significantly. The decline might take as little as 1-3 weeks, so it's important to stay alert to any changes.
Most importantly - stay healthy and safe. We're making a lot of money on these price moves (and we'll likely make much more in the following weeks and months), but you have to be healthy to really enjoy the results.
By the way, we recently opened a possibility to extend one's subscription for a year with a 10% discount in the yearly subscription fee (the profits that you took have probably covered decades of subscription fees...). It also applies to our All-Inclusive Package (if you didn't know - we just made huge gains shorting crude oil and are also making money on both the decline and temporary rebound in stocks). The boring time in the PMs is over and the time to pay close attention to the market is here - it might be a good idea to secure more access while saving 10% at the same time.
Important: If your subscription got renewed recently, but you'd like to secure more access at a discount - please let us know, we'll make sure that the discount applies right away, while it's still active. Moreover, please note that you can secure more access than a year - if you secured a yearly access, and add more years to your subscription, each following year will be rewarded with an additional 10% discount (20% discount total). We would apply this discount manually - please contact us for details.
Secure more access at a discount.
As always, we'll keep you - our subscribers - informed.
To summarize:
Trading capital (supplementary part of the portfolio; our opinion): Full speculative short positions (250% of the full position) in mining stocks is justified from the risk to reward point of view with the following binding exit profit-take price levels:
Senior mining stocks (price levels for the GDX ETF): binding profit-take exit price: $10.32; stop-loss: none (the volatility is too big to justify a SL order in case of this particular trade); binding profit-take level for the DUST ETF: $9.27 (after the 1 for 25 reverse-split that's scheduled after the Apr 22 close: $231.75); stop-loss for the DUST ETF: none (the volatility is too big to justify a SL order in case of this particular trade)
Junior mining stocks (price levels for the GDXJ ETF): binding profit-take exit price: $9.57; stop-loss: none (the volatility is too big to justify a SL order in case of this particular trade); binding profit-take level for the JDST ETF: $11.37 (after the 1 for 25 reverse-split that's scheduled after the Apr 22 close: $284.25); stop-loss for the JDST ETF: none (the volatility is too big to justify a SL order in case of this particular trade)
For-your-information targets (our opinion; we continue to think that mining stocks are the preferred way of taking advantage of the upcoming price move, but if for whatever reason one wants / has to use silver or gold for this trade, we are providing the details anyway. In our view, silver has greater potential than gold does):
Silver futures downside profit-take exit price: $8.58
Gold futures downside profit-take exit price: $1,312 (the target for gold is least clear; it might drop to even $1,170 or so)
Long-term capital (core part of the portfolio; our opinion): No positions (in other words: cash)
Insurance capital (core part of the portfolio; our opinion): Full position
Whether you already subscribed or not, we encourage you to find out how to make the most of our alerts and read our replies to the most common alert-and-gold-trading-related-questions.
Please note that the in the trading section we describe the situation for the day that the alert is posted. In other words, it we are writing about a speculative position, it means that it is up-to-date on the day it was posted. We are also featuring the initial target prices, so that you can decide whether keeping a position on a given day is something that is in tune with your approach (some moves are too small for medium-term traders and some might appear too big for day-traders).
Plus, you might want to read why our stop-loss orders are usually relatively far from the current price.
Please note that a full position doesn't mean using all of the capital for a given trade. You will find details on our thoughts on gold portfolio structuring in the Key Insights section on our website.
As a reminder - "initial target price" means exactly that - an "initial" one, it's not a price level at which we suggest closing positions. If this becomes the case (like it did in the previous trade) we will refer to these levels as levels of exit orders (exactly as we've done previously). Stop-loss levels, however, are naturally not "initial", but something that, in our opinion, might be entered as an order.
Since it is impossible to synchronize target prices and stop-loss levels for all the ETFs and ETNs with the main markets that we provide these levels for (gold, silver and mining stocks - the GDX ETF), the stop-loss levels and target prices for other ETNs and ETF (among other: UGLD, DGLD, USLV, DSLV, NUGT, DUST, JNUG, JDST) are provided as supplementary, and not as "final". This means that if a stop-loss or a target level is reached for any of the "additional instruments" (DGLD for instance), but not for the "main instrument" (gold in this case), we will view positions in both gold and DGLD as still open and the stop-loss for DGLD would have to be moved lower. On the other hand, if gold moves to a stop-loss level but DGLD doesn't, then we will view both positions (in gold and DGLD) as closed. In other words, since it's not possible to be 100% certain that each related instrument moves to a given level when the underlying instrument does, we can't provide levels that would be binding. The levels that we do provide are our best estimate of the levels that will correspond to the levels in the underlying assets, but it will be the underlying assets that one will need to focus on regarding the signs pointing to closing a given position or keeping it open. We might adjust the levels in the "additional instruments" without adjusting the levels in the "main instruments", which will simply mean that we have improved our estimation of these levels, not that we changed our outlook on the markets. We are already working on a tool that would update these levels on a daily basis for the most popular ETFs, ETNs and individual mining stocks.
Our preferred ways to invest in and to trade gold along with the reasoning can be found in the how to buy gold section. Additionally, our preferred ETFs and ETNs can be found in our Gold & Silver ETF Ranking.
As a reminder, Gold & Silver Trading Alerts are posted before or on each trading day (we usually post them before the opening bell, but we don't promise doing that each day). If there's anything urgent, we will send you an additional small alert before posting the main one.
Thank you.
Sincerely,
Przemyslaw Radomski, CFA
Editor-in-chief, Gold & Silver Fund Manager

