

Briefly: In our opinion, full (150% of the regular full position) speculative short positions in gold, silver and mining stocks are justified from the risk/reward perspective at the moment of publishing this alert. We are moving the profit-take levels in silver and mining stocks lower.
In yesterday’s second brief alert we wrote that we may need to adjust the profit-take levels for our short positions. If the current decline is ending, as miners close to their target might suggest, then the target for gold should be moved higher. However, if the decline is just starting as gold’s breakdown seems to be indicating, then the profit-take levels for silver and mining stocks should be adjusted downward. Which scenario seems more likely?
The latter because of two major reasons. The first reason is gold’s breakdown which was preceded by a lengthy pause, which makes it more likely that the following move is going to be significant. The second reason is the situation in the USD Index and – in particular – the way in which the precious metals market has been reacting to it.
Let’s start with the latter issue (chart courtesy of http://stockcharts.com).
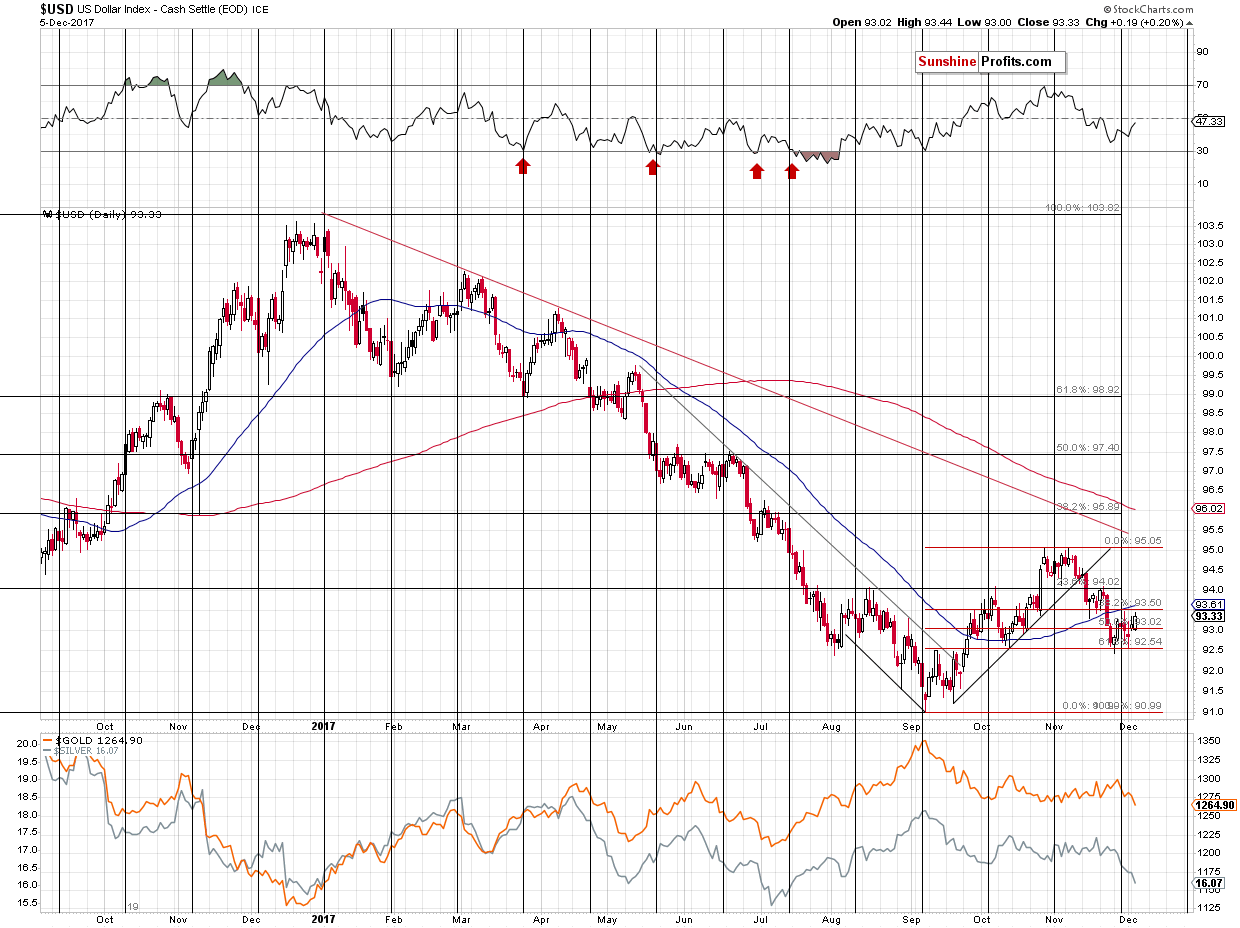
The USD Index has barely rallied recently and yet gold, silver and mining stocks are all down visibly. Based on the recent turning point, analogies in interest rate hike series and the overall bullish outlook in the medium term, it seems that the USD Index is in the very early stage of a huge upswing.
The first pause could be seen at the 38.2% Fibonacci retracement level (approximately at 96) or the November high of about 95, which is going to coincide with the declining red resistance line in a few days. Either way, the USD Index is likely to rally visibly before the next pause becomes likely.
If the precious metals and mining stocks hadn’t really reacted to the USD’s upswings, then it would not be a big deal. However, exactly the opposite has been the case. In the recent weeks, the precious metals sector responded to the USD’s rallies, even if they were small, while mostly ignoring the USD’s declines. In such an environment, a bigger rally in the USD is likely to translate into an even bigger decline in the precious metals market. Consequently, it doesn’t seem that the decline in the latter is close to being over.
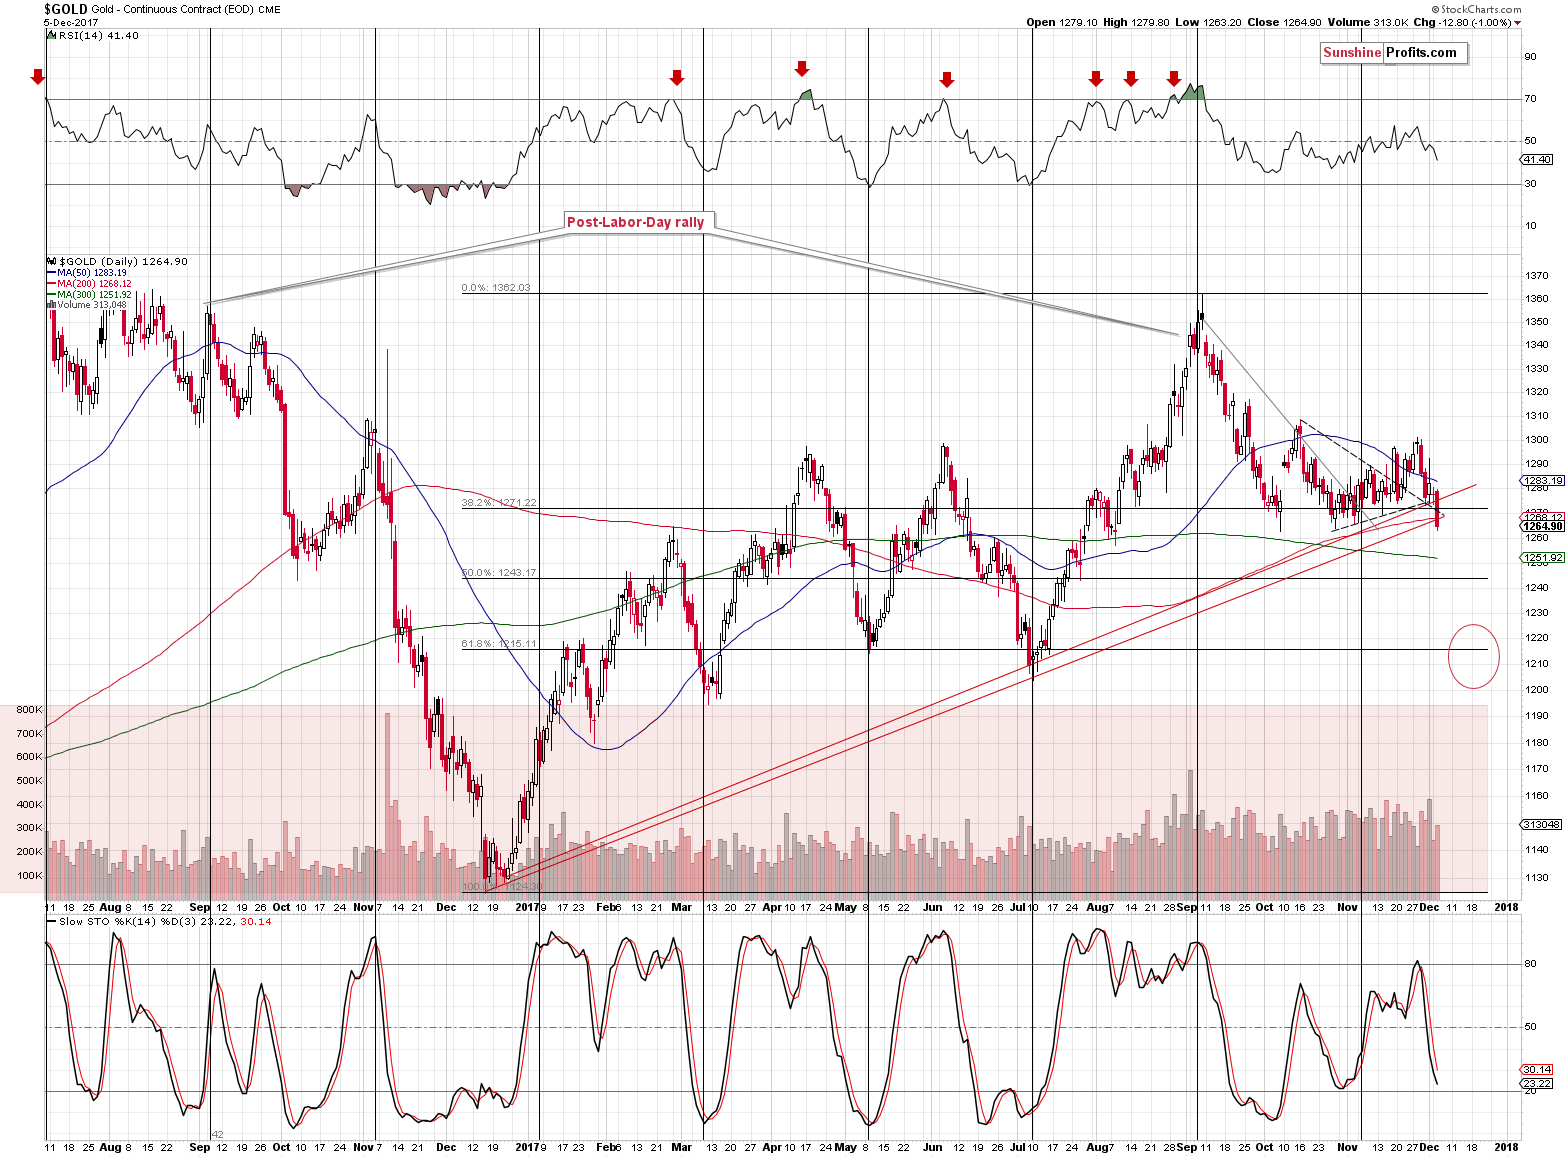
Gold closed yesterday’s session below both rising support lines, but the most important thing is that it closed it below the line based on the daily closing prices (it’s currently at about $1,275) and that the move below it was rather significant.
The breakdown is not yet confirmed, but it appears that it will be confirmed shortly, especially if the USD continues to move higher. The next support is just above $1,200, so that’s where gold is most likely headed. As discussed earlier today, the bigger the consolidation, the bigger the move is likely to follow and in this case, it means that gold should move visibly lower, not just several dollars lower. Again, it doesn’t seem that the decline is close to being over – at least not in terms of price.
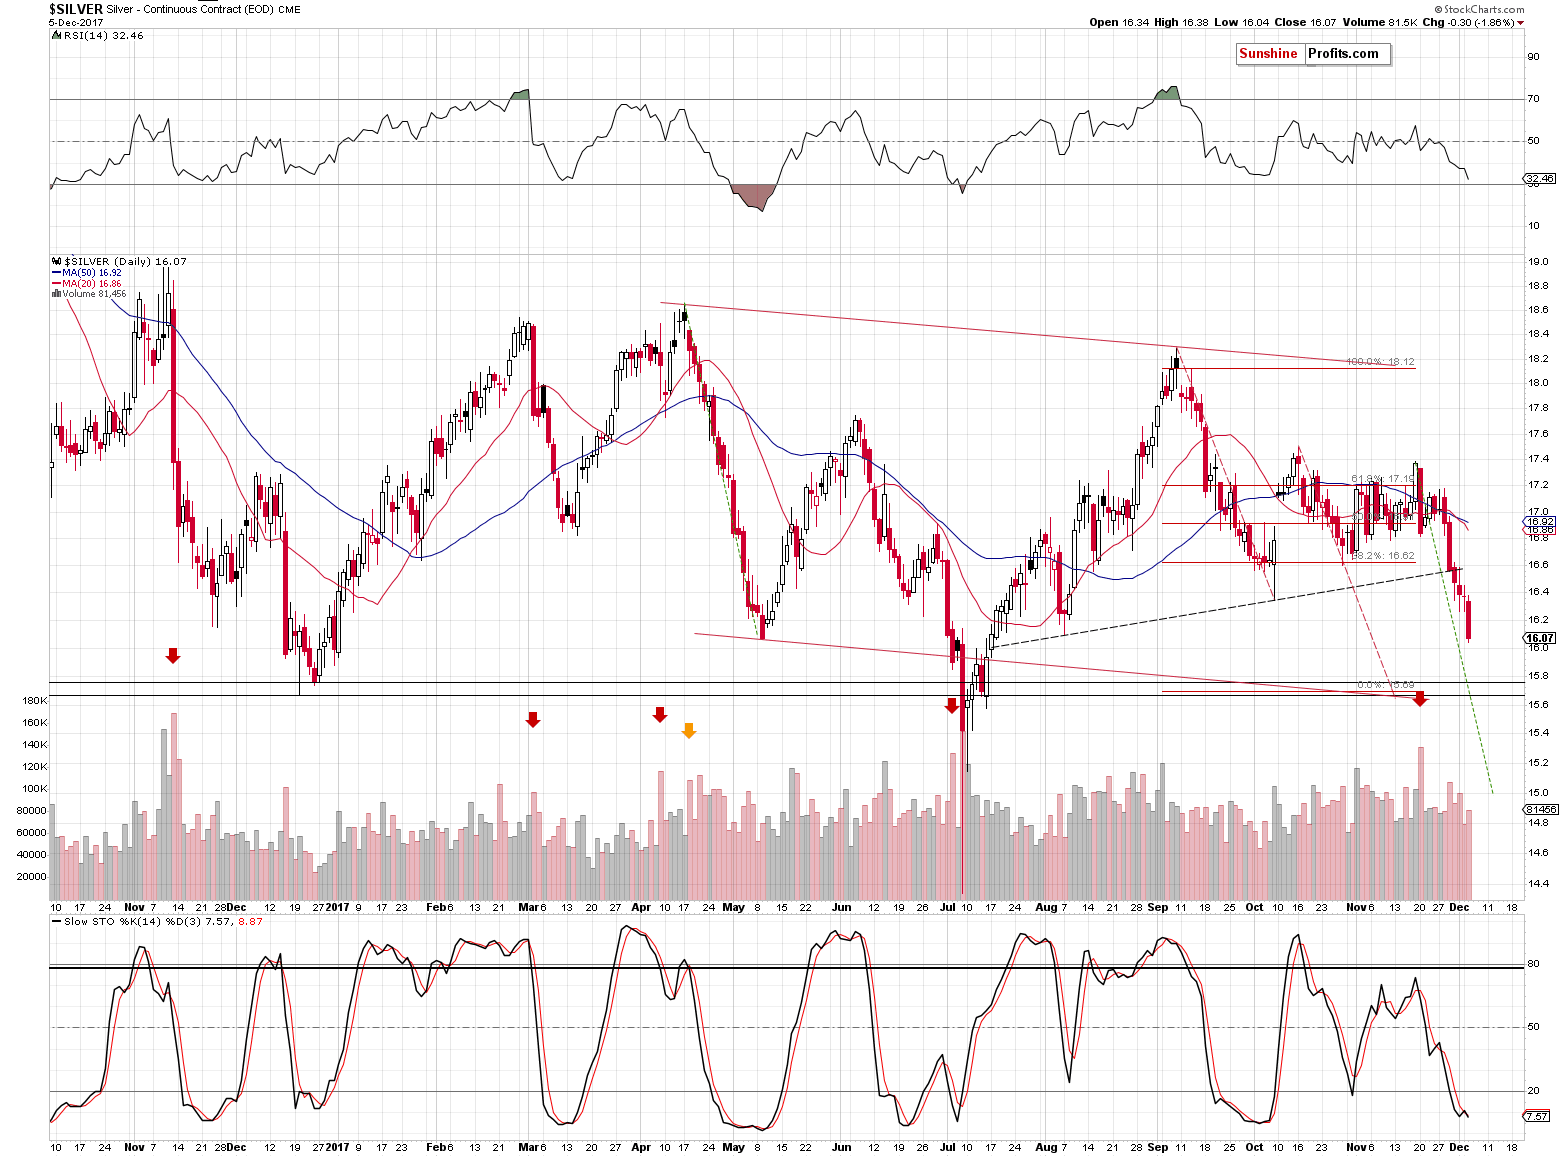
The silver price is already at about $16 and the price target between $15.60 and $15.80 is now very close. However, if gold is going to slide to $1,210 or so, then silver’s bottom between $15.60 and $15.80 would imply a lot of strength in the latter. The problem is that there is no reason to assume such strength in the white metal as it’s been declining more than gold in the past several days. Naturally, this tendency could reverse, but so far we see no signs thereof.
So, if silver is going to move below $15.60 to be in greater tune with gold, then what price level could stop it?
It seems best to use comparative analysis and there are two ways in which we can approach it. One is to assume that the gold to silver ratio will not change and that the decline will be directly proportional. With gold at $1,268 and the target at $1,210, this means a decline of about 4.6%. An analogous decline in silver would imply a move to $15.37. This seems to be too high, because after all silver has been underperforming the yellow metal.
The second way to approach the situation is to check for the size of the most recent move and see how much thereof will need to be repeated for the target to be reached. This approach is more dynamic as it takes into account the most recent trends in both markets. We’ll use the “recent high – yesterday’s close” comparison. Gold moved from $1,301.30 to $1,264.90 – it declined by $36.4. In order to bottom at $1,210, it needs to decline by an additional $54.90. This means that it would need to decline by about 150% of what it has already declined.
Silver already declined from $17.18 to $16.07, which is a $1.11 move. 150% of $1.11 is $1.665. Deducting the above from yesterday’s close provides us with a target of approximately $14.40, which is almost exactly at July’s crazy overnight bottom. This level may seem ridiculous, but well, that’s exactly what may be in the cards.
How to translate it into profit-take levels? It seems that it will be better to be more extreme than conservative because we are mainly basing the entire targets on gold and the USD (and the miners’ relative strength, but the latter is definitely not present at this time) and if the above markets point to a temporary reversal, we will close the silver position anyway. Consequently, even if the short position is not closed automatically as the profit-take level is too low, we will still most likely close it at a favorable level thanks to the gold and USD analysis. If, however, we have the exit level too high, we will be thrown out of the market and we might miss a large part of the move and there will be little that we could do about it afterwards.
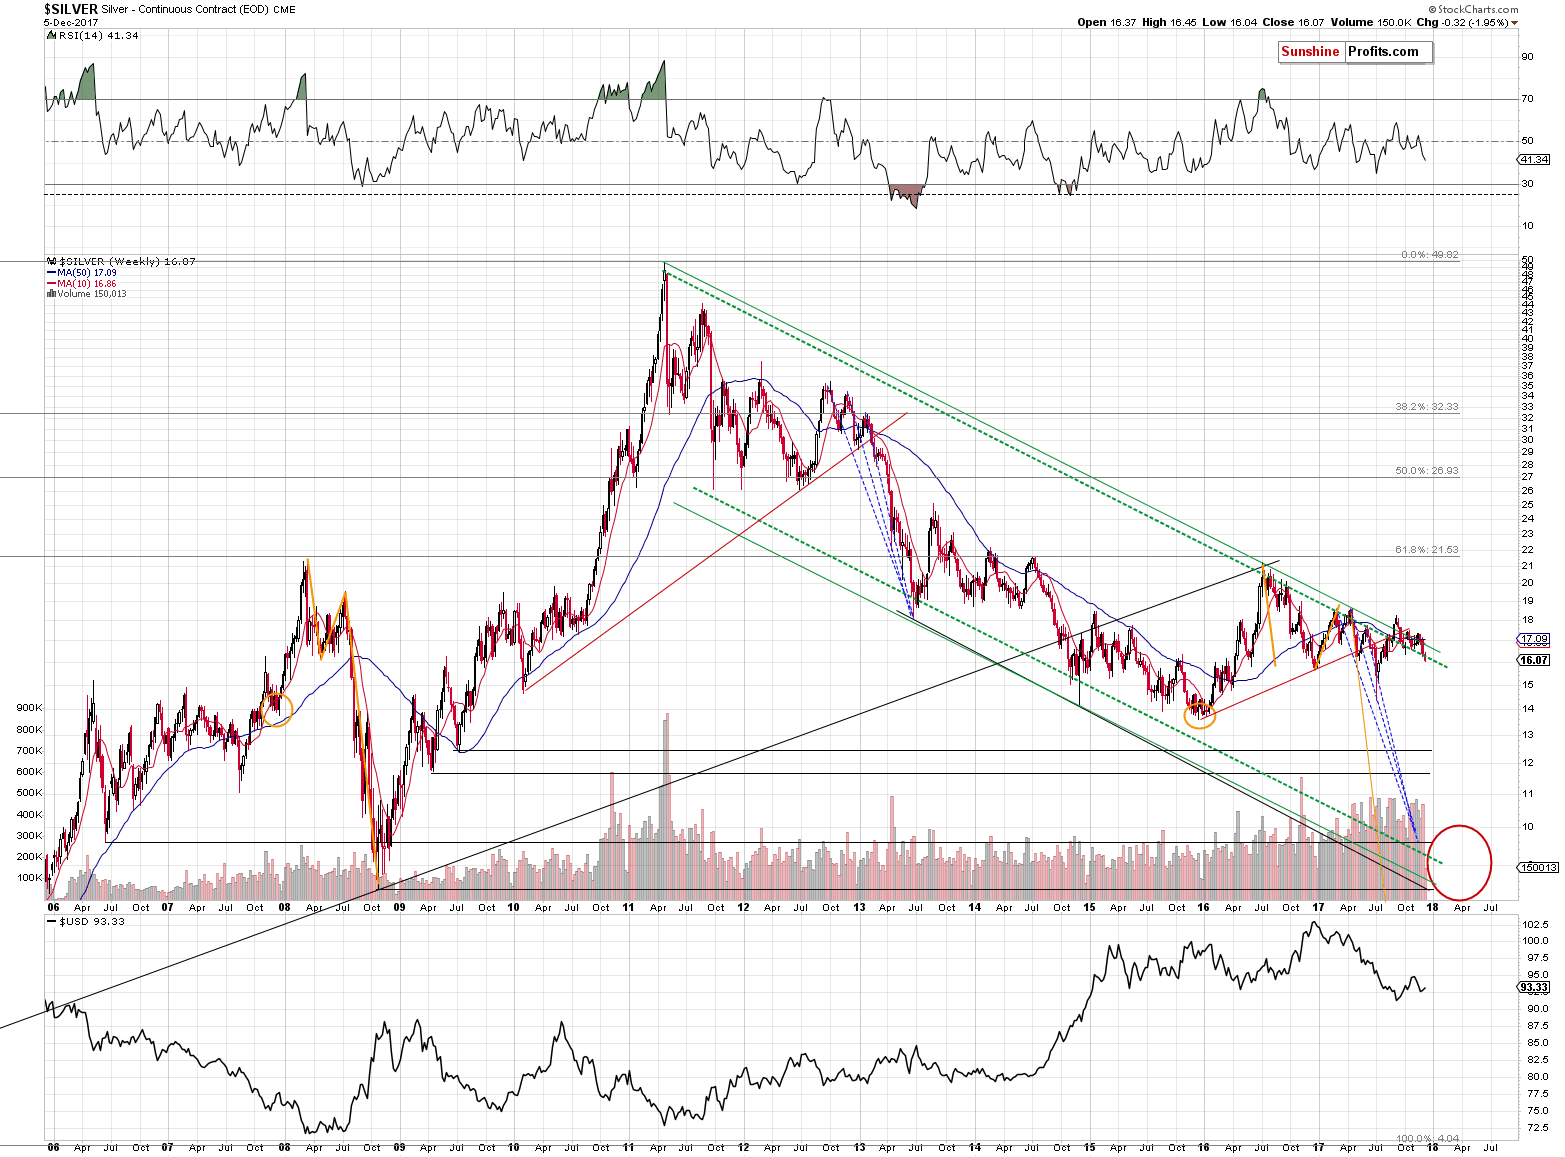
Moreover, please note that if silver is to temporarily slide all the way down to $10 or below it (yes, it seems to be a likely scenario even though it may appear ridiculous), then a move to $14.40 or so initially seems to be a quite realistic way to start such move.
Yes, we know. It sounds crazy, but remember that this is silver, known precisely for its “crazy” and volatile price swings.
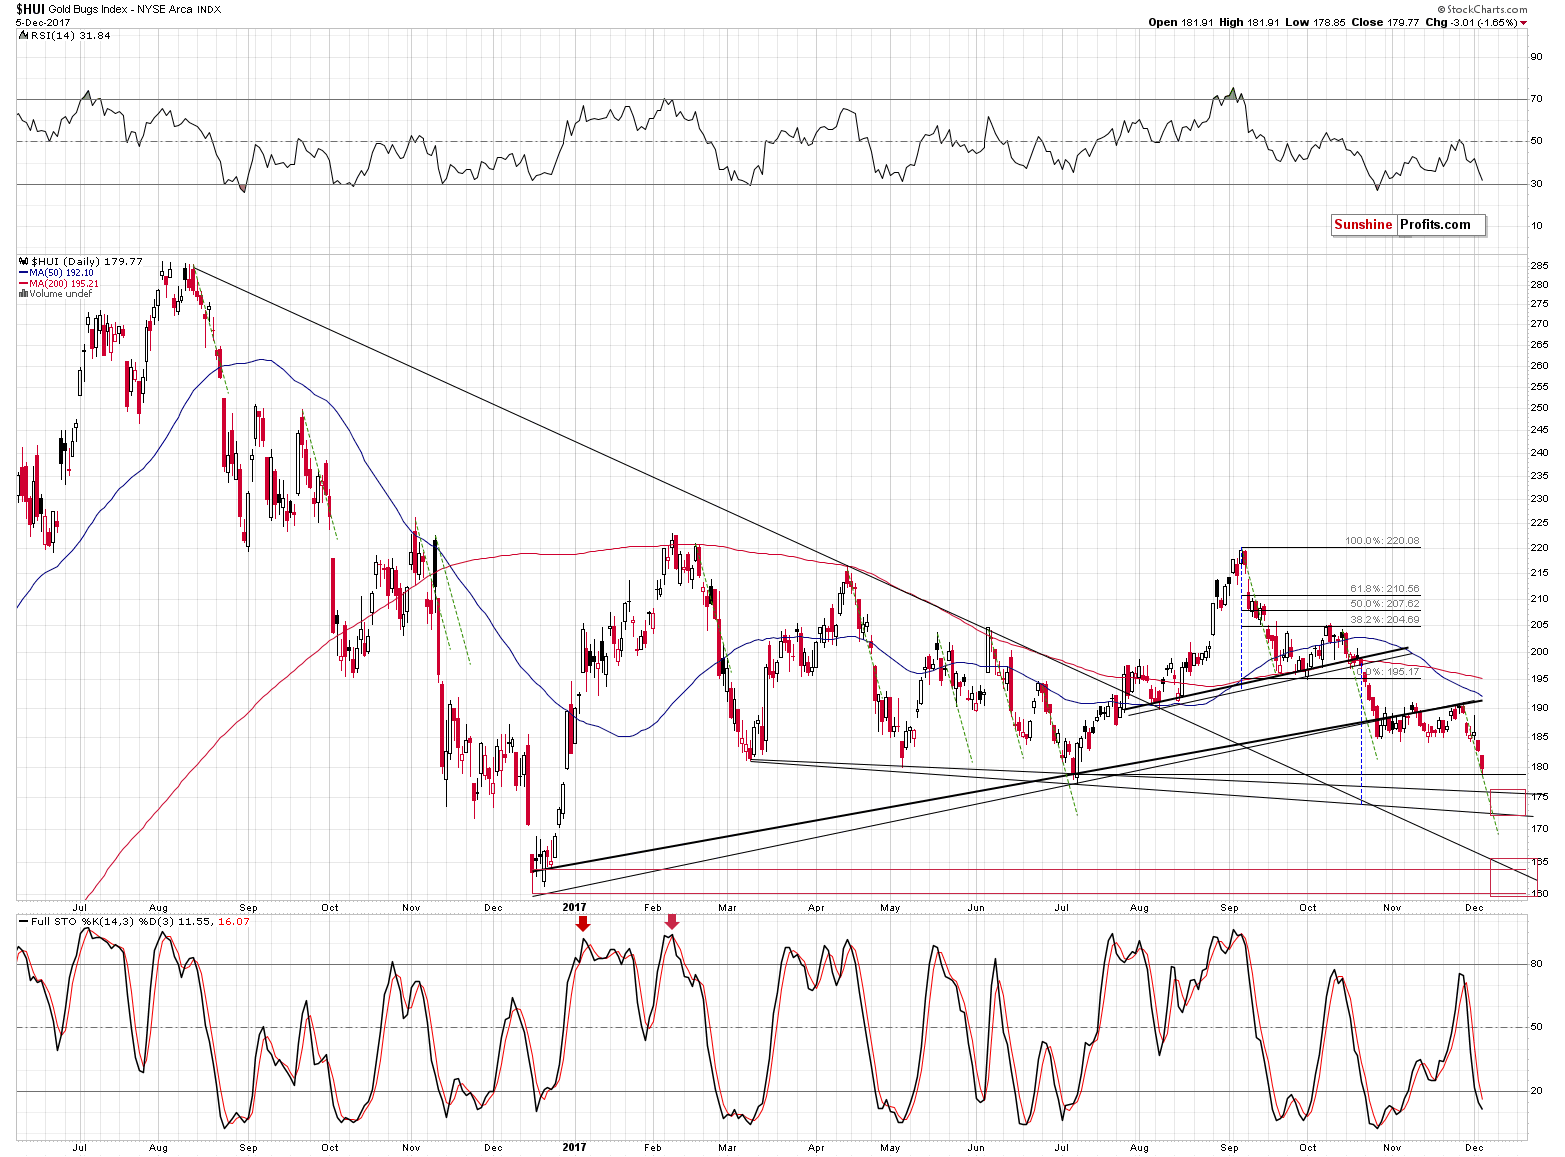
If we apply the same kind of analysis to gold stocks, we end up with about 172 as the target for the HUI Index, if we use the static approach, and about 163 if we use the dynamic approach.
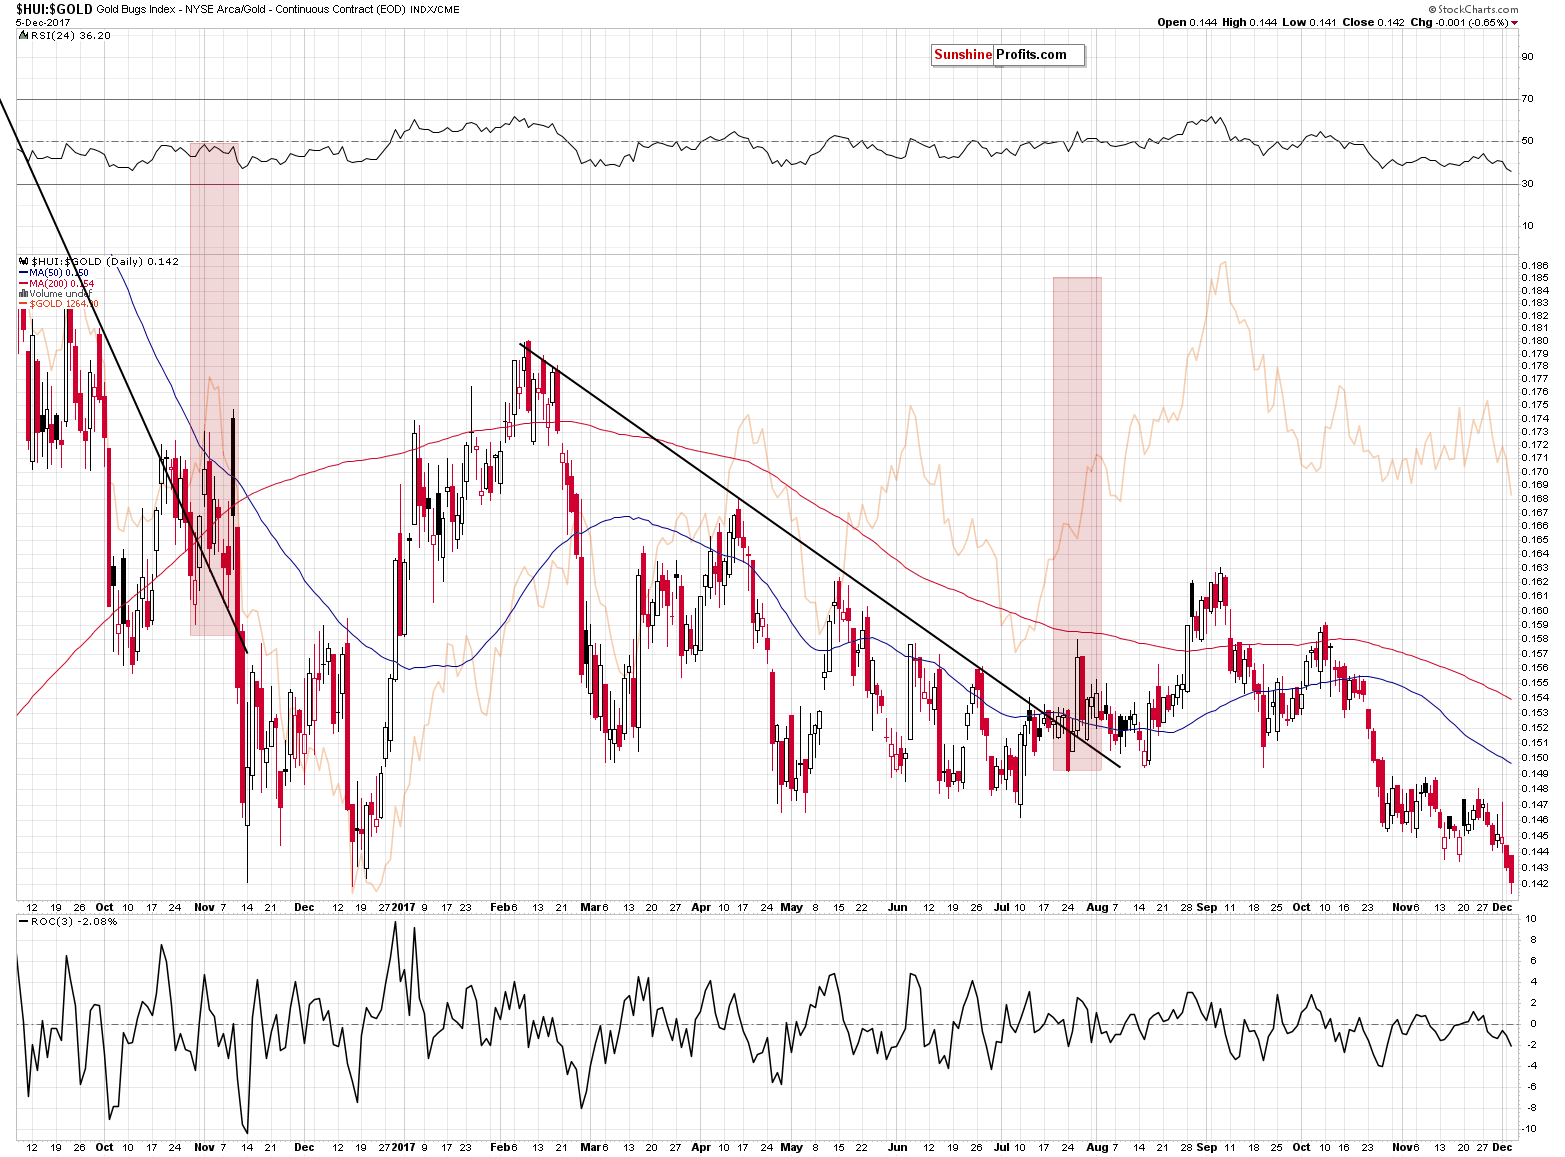
Since the HUI to gold ratio just broke below its 2016 low and it remains in a visible downtrend, it seems that the dynamic approach is more appropriate.
Interestingly, the price target for the HUI Index also corresponds to an important previous bottom (the 2016 bottom), which makes it more reliable.
Just like in the case of silver, it seems that moving the profit-take level closer to the lower target is a better idea than to have it too high – the reasoning is identical.
Now, as far as the time aspect is concerned, we might see a temporary turnaround next week as that’s when we have the interest rate decision. It’s almost certain that the rates will be increased, but the investors might remember that such action was followed by a rally in the precious metals sector in the past, and thus act in the same way this year. Still, this time, the rally is likely to be nothing more than a correction within a bigger downswing.
Summing up, it seems that the decline in the precious metals market is not very close to being over. We might see a visible corrective upswing next week, but this correction could start at much lower levels based on the breakdown in gold and the way PMs react to the changes in the USD Index. For now, the outlook remains bearish.
Consequently, we are moving the target prices for silver and mining stocks lower, but at the same time please note that if gold or the USD move to their respective targets, we will most likely take profits in silver and mining stocks as well.
As always, we will keep you – our subscribers – informed.
To summarize:
Trading capital (supplementary part of the portfolio; our opinion): Short positions (150% of the full position) in gold, silver and mining stocks are justified from the risk/reward perspective with the following stop-loss orders and exit price levels / profit-take orders:
- Gold: exit price: $1,218; stop-loss: $1,366; exit price for the DGLD ETN: $51.98; stop-loss for the DGLD ETN $38.74
- Silver: exit price: $14.63; stop-loss: $19.22; exit price for the DSLV ETN: $33.88; stop-loss for the DSLV ETN $17.93
- Mining stocks (price levels for the GDX ETF): exit price: $19.22; stop-loss: $26.34; exit price for the DUST ETF: $39.88; stop-loss for the DUST ETF $21.37
In case one wants to bet on junior mining stocks' prices (we do not suggest doing so – we think senior mining stocks are more predictable in the case of short-term trades – if one wants to do it anyway, we provide the details), here are the stop-loss details and exit prices:
- GDXJ ETF: exit price: $27.82; stop-loss: $45.31
- JDST ETF: exit price: $94.88 stop-loss: $43.12
Long-term capital (core part of the portfolio; our opinion): No positions (in other words: cash)
Insurance capital (core part of the portfolio; our opinion): Full position
Important Details for New Subscribers
Whether you already subscribed or not, we encourage you to find out how to make the most of our alerts and read our replies to the most common alert-and-gold-trading-related-questions.
Please note that the in the trading section we describe the situation for the day that the alert is posted. In other words, it we are writing about a speculative position, it means that it is up-to-date on the day it was posted. We are also featuring the initial target prices, so that you can decide whether keeping a position on a given day is something that is in tune with your approach (some moves are too small for medium-term traders and some might appear too big for day-traders).
Plus, you might want to read why our stop-loss orders are usually relatively far from the current price.
Please note that a full position doesn’t mean using all of the capital for a given trade. You will find details on our thoughts on gold portfolio structuring in the Key Insights section on our website.
As a reminder – “initial target price” means exactly that – an “initial” one, it’s not a price level at which we suggest closing positions. If this becomes the case (like it did in the previous trade) we will refer to these levels as levels of exit orders (exactly as we’ve done previously). Stop-loss levels, however, are naturally not “initial”, but something that, in our opinion, might be entered as an order.
Since it is impossible to synchronize target prices and stop-loss levels for all the ETFs and ETNs with the main markets that we provide these levels for (gold, silver and mining stocks – the GDX ETF), the stop-loss levels and target prices for other ETNs and ETF (among other: UGLD, DGLD, USLV, DSLV, NUGT, DUST, JNUG, JDST) are provided as supplementary, and not as “final”. This means that if a stop-loss or a target level is reached for any of the “additional instruments” (DGLD for instance), but not for the “main instrument” (gold in this case), we will view positions in both gold and DGLD as still open and the stop-loss for DGLD would have to be moved lower. On the other hand, if gold moves to a stop-loss level but DGLD doesn’t, then we will view both positions (in gold and DGLD) as closed. In other words, since it’s not possible to be 100% certain that each related instrument moves to a given level when the underlying instrument does, we can’t provide levels that would be binding. The levels that we do provide are our best estimate of the levels that will correspond to the levels in the underlying assets, but it will be the underlying assets that one will need to focus on regarding the signs pointing to closing a given position or keeping it open. We might adjust the levels in the “additional instruments” without adjusting the levels in the “main instruments”, which will simply mean that we have improved our estimation of these levels, not that we changed our outlook on the markets. We are already working on a tool that would update these levels on a daily basis for the most popular ETFs, ETNs and individual mining stocks.
Our preferred ways to invest in and to trade gold along with the reasoning can be found in the how to buy gold section. Additionally, our preferred ETFs and ETNs can be found in our Gold & Silver ETF Ranking.
As a reminder, Gold & Silver Trading Alerts are posted before or on each trading day (we usually post them before the opening bell, but we don't promise doing that each day). If there's anything urgent, we will send you an additional small alert before posting the main one.
=====
Latest Free Trading Alerts:
On Monday, the Richmond Fed named Thomas Barkin to be its next president. What does it mean for the gold market?
Risk Appetites, Barkin, and Gold
=====
Hand-picked precious-metals-related links:
PRECIOUS-Gold recovers from 2-month low as dollar weakens
India's November gold imports nearly halve on higher prices: GFMS
Indonesia to grab Rio Tinto stake in Grasberg mine
=====
In other news:
Tech tremors spread to financials to spoil global rally
Bitcoin Soars Past $12,000 as Futures Move Closer to Reality
=====
Thank you.
Sincerely,
Przemyslaw Radomski, CFA
Founder, Editor-in-chief, Gold & Silver Fund Manager
Gold & Silver Trading Alerts
Forex Trading Alerts
Oil Investment Updates
Oil Trading Alerts

