

Briefly: in our opinion, full (300% of the regular position size) speculative short positions in junior mining stocks are justified from the risk/reward point of view at the moment of publishing this Alert.
You already read about the situation in junior mining stocks yesterday, and you are aware of how complicated the situation is at the moment due to the specific link with cryptocurrencies. In today’s analysis, I’ll cover other parts of the current puzzle: gold, the USD Index, and the stock market. In particular, the situation appears very interesting in the latter, so I’ll start with it.
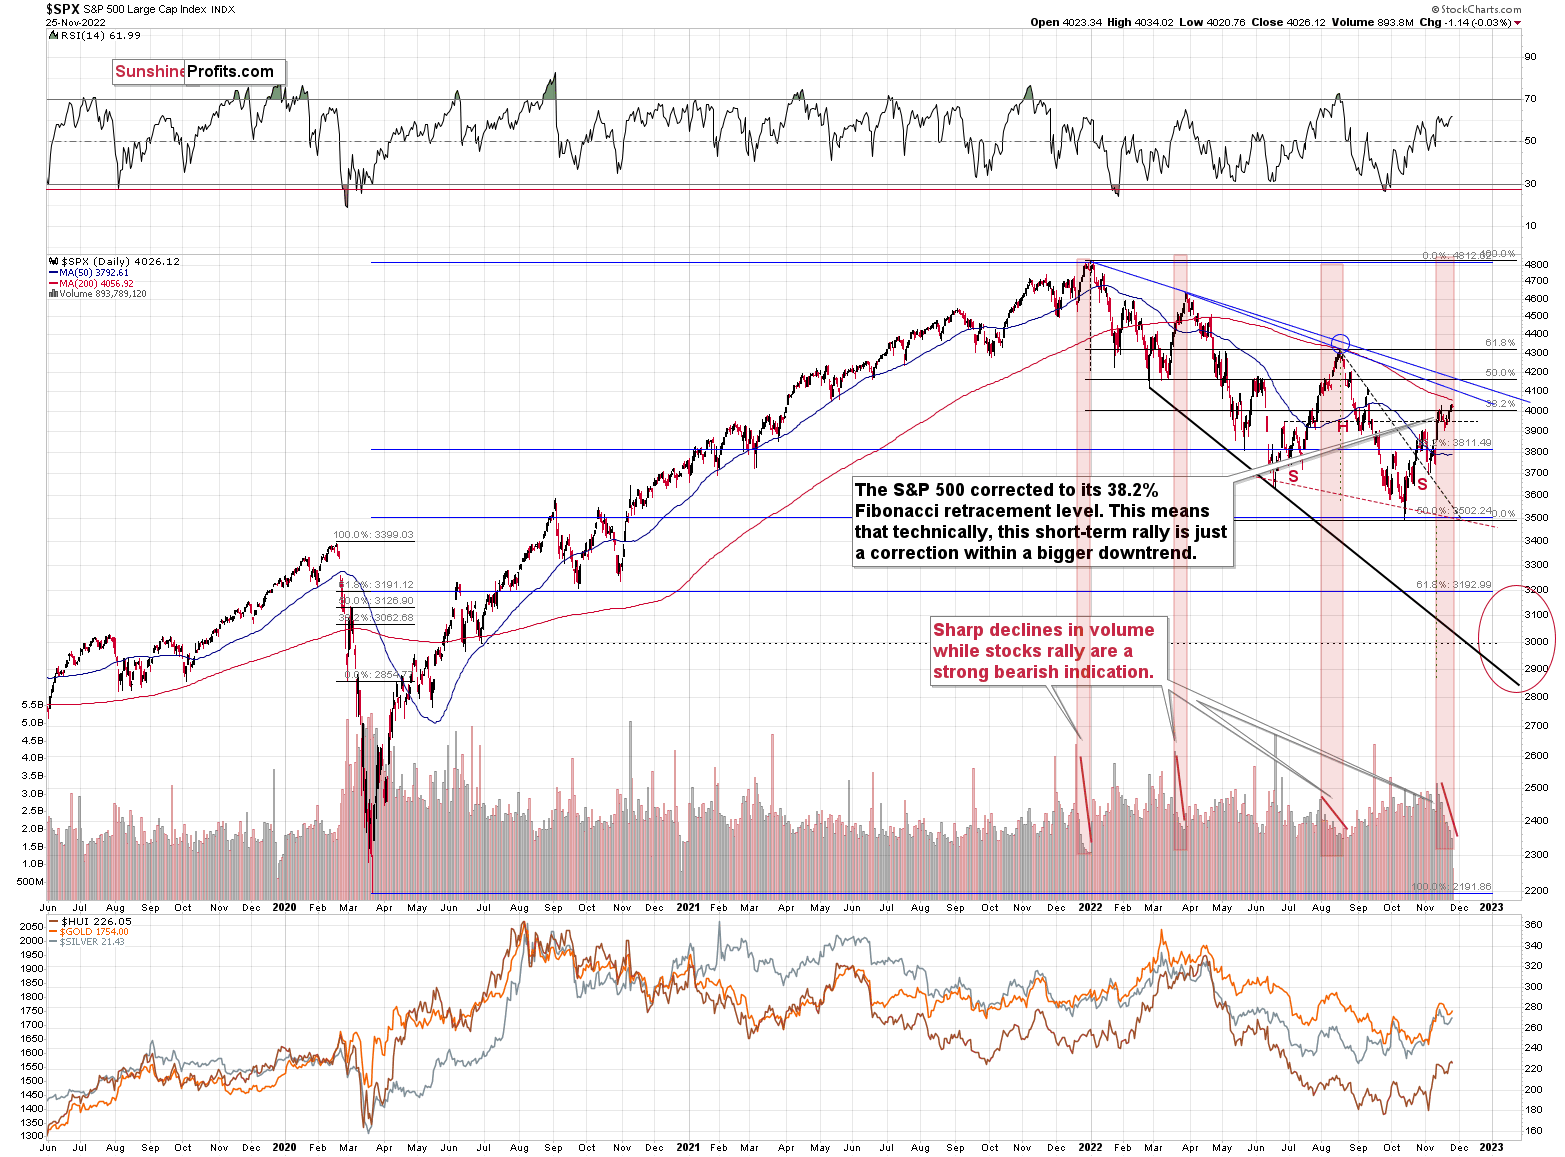
We just saw a small attempt to break above the 38.2% Fibonacci retracement, and I doubt that this breakout will be confirmed. The “why” behind it is currently the most interesting analogy that we see on this market.
Please take a look at the areas marked with red rectangles. In all those cases, the S&P 500 index rallied on big volume at first, and then the volume declined over the course of a few weeks. And as that happened, the price approached its top.
All three previous important tops that we saw this year were accompanied by this indication.
We also see it right now.
Even more interestingly, the volume levels that have just been seen are similar to the ones that accompanied previous tops.
Consequently, it seems that the end of the rally is near. This is likely to have very bearish implications for junior mining stocks.
Let’s check what’s up with gold.
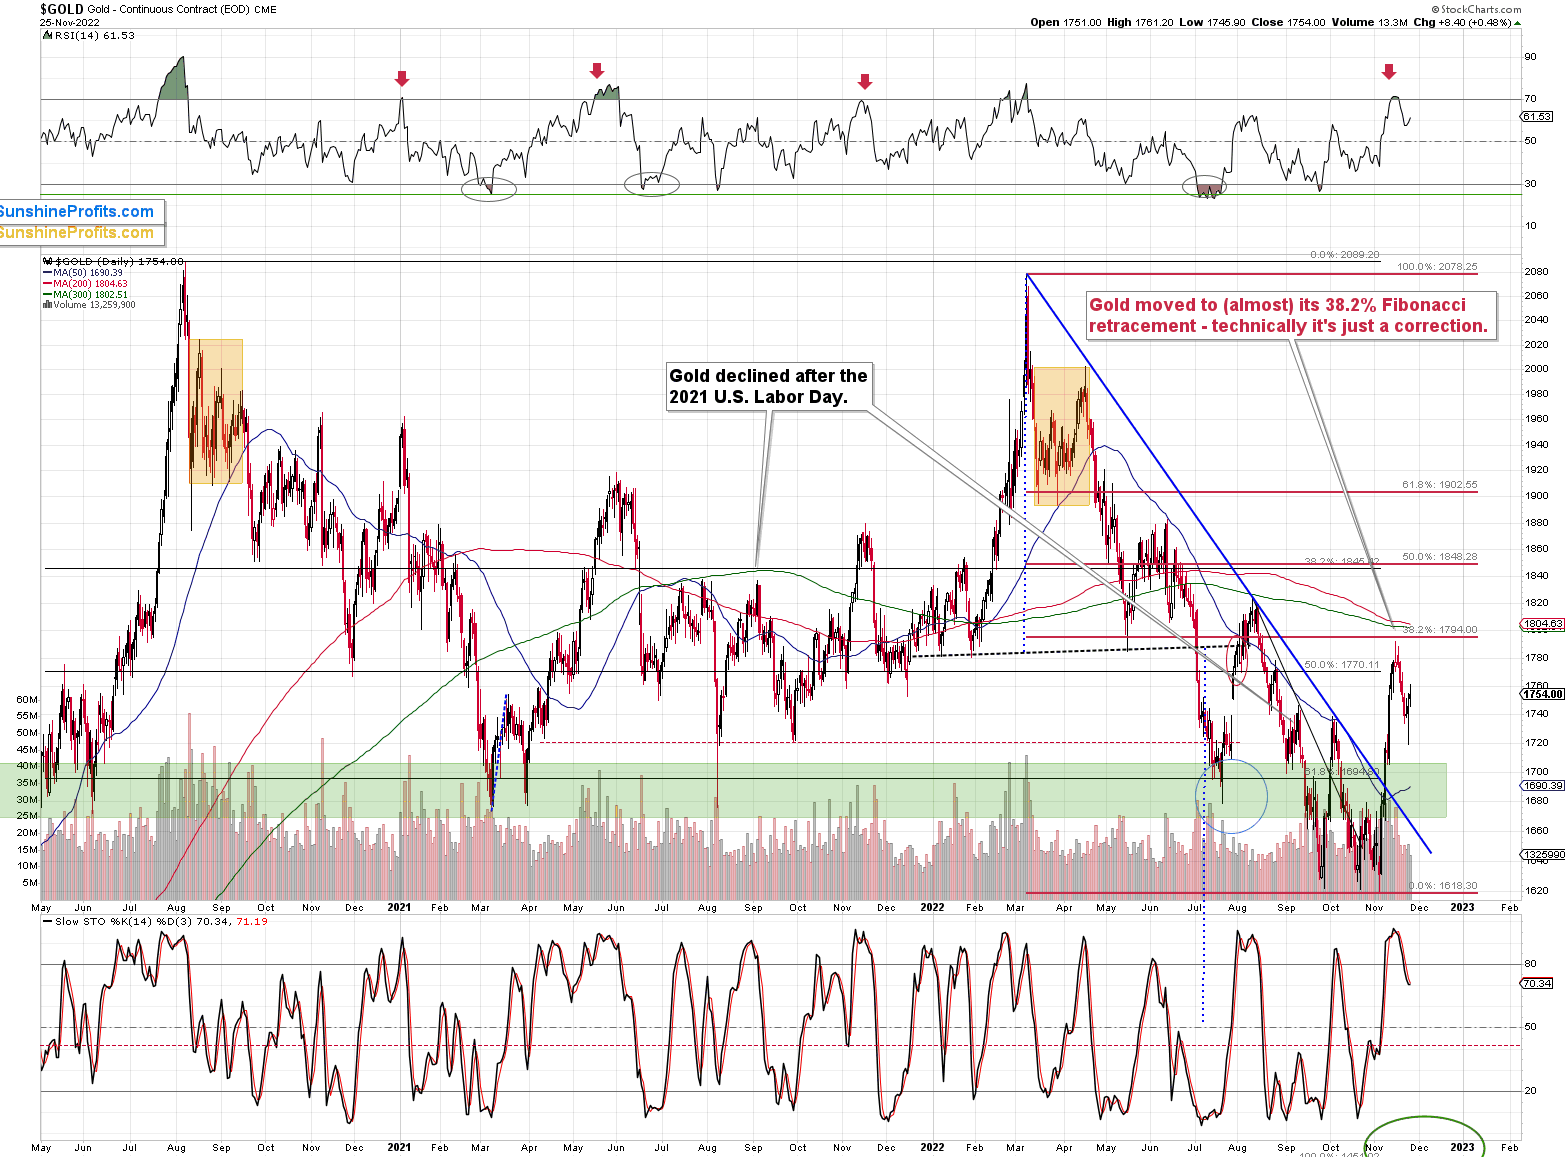
The yellow metal corrected 38.2% of its previous medium-term decline, and it declined once again. The moves that are smaller than 38.2% of the preceding move are generally viewed as “weak corrections,” indicating a market where the previous trend is very strong.
What’s next?
As the correction appears to be over, the medium-term downtrend is now likely to resume. The RSI indicator clearly supports this outcome, as it just moved back below 70. When we previously saw similar signals, gold price usually plunged.
There’s one more thing that makes me predict that the gold price top is already in.
It’s gold’s link with the USD Index.
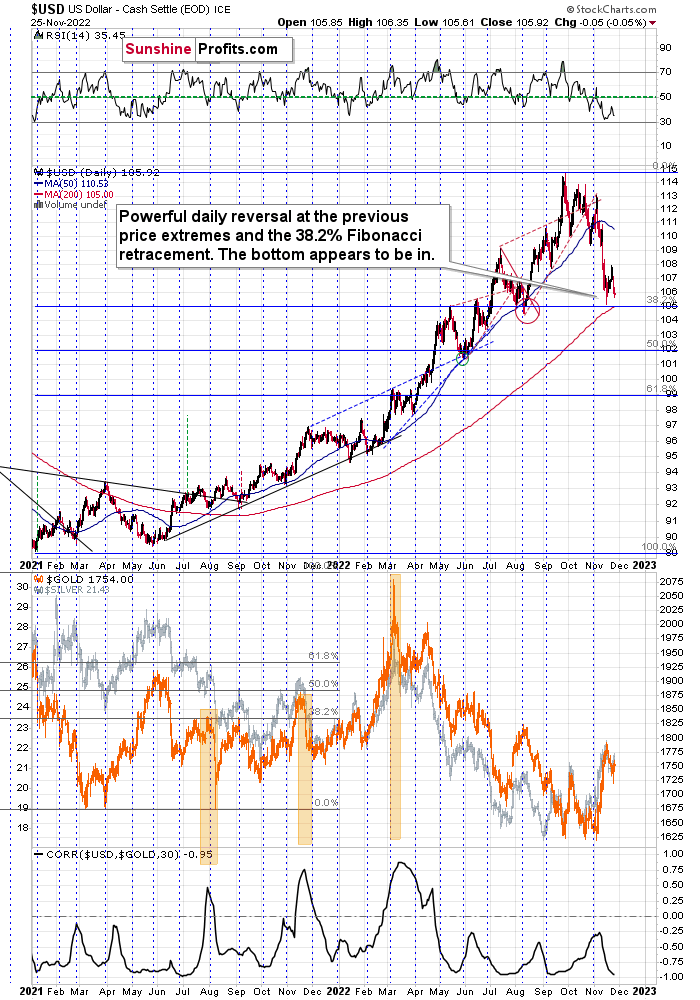
As you can see above, the USD Index just moved very close to its recent bottom. However, at the same time, gold and silver prices didn’t move back to their previous highs.
This kind of weak reaction to a factor that “should” move the market, indicates that the market really wants to move in the opposite direction.
In the current case, this indicates that gold wants to move lower.
Combining the above with the extremely negative correlation between gold and the USD Index (currently the 30-trading-day linear correlation coefficient is at -0.95, while -1 is the most negative that it could go), this indicates that when the USD Index rallies, gold would be likely to truly plunge – magnifying the U.S. dollar’s moves, but in the opposite direction.
All in all, the technical outlook for the precious metals sector appears to be very bearish for the coming weeks.
Having said that, let’s take a look at the markets from a more fundamental point of view.
While the gold price has been whipsawed in 2022 by investors’ manic mood swings, the latest bout of optimism pushed the yellow metal above its October highs. However, with the FOMC releasing the minutes from its Nov. 1-2 monetary policy meeting on Nov. 23, the results were highly bearish for gold, silver and mining stocks.
On the one hand, the report stated:
“A number of participants observed that, as monetary policy approached a stance that was sufficiently restrictive to achieve the Committee's goals, it would become appropriate to slow the pace of increase in the target range for the federal funds rate. In addition, a substantial majority of participants judged that a slowing in the pace of increase would likely soon be appropriate.”
On the other hand, while the crowd is so desperate for a dovish pivot that a “slowing in the pace” of rate hikes is the new rate cut, the reality is that the peak U.S. federal funds rates (FFR) should be “somewhat higher than they had previously expected.”
Please see below:
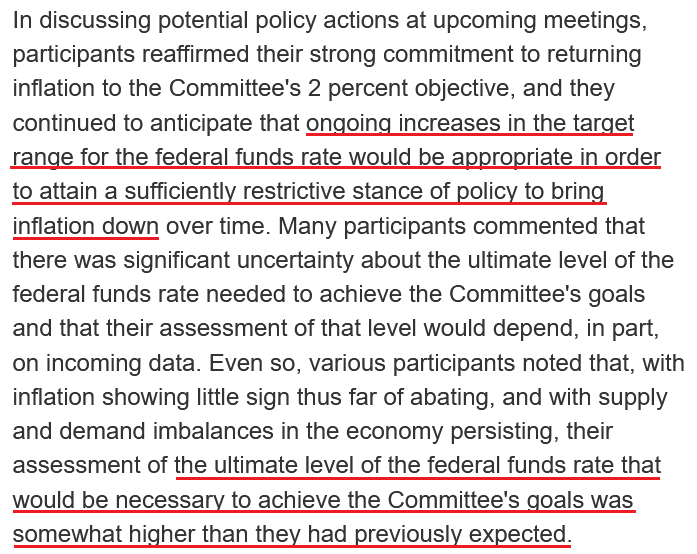 Source: U.S. Fed
So, while I warned throughout 2021 and 2022 that unanchored inflation would prove highly problematic, the consensus still underestimates the challenge of reducing the metric to 2%. As a result, the recent rally across risk assets has been driven by hope, and disappointment should reign when reality returns.
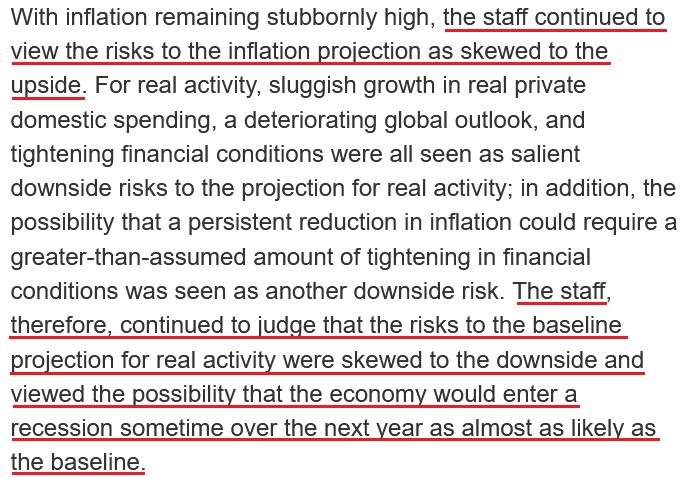
To that point, while I’ve noted that every inflation fight since 1954 has ended with a recession, Fed officials made it their near “baseline” view that the U.S. economy “would enter a recession sometime over the next year.”
Please see below:
 Source: U.S. Fed
As such, while bullish seasonality has Wall Street in the Christmas spirit, a higher peak FFR and a likely recession are profoundly bearish. Furthermore, while the crowd will note (and I agree) that growth, employment and consumer spending have remained resilient, they don’t realize that a sharp decline in all three is required to curb inflation.
In a nutshell: the longer consumer spending fuels GDP and wage growth, the higher the peak FFR when it’s all said and done. Remember, the Fed needs higher unemployment, weaker growth and lower consumer spending to reduce inflation, and we’re nowhere near that.
For example, the Atlanta Fed’s fourth-quarter real GDP growth estimate is bullish for the FFR. The report stated on Nov. 23:
“The GDPNow model estimate for real GDP growth (seasonally adjusted annual rate) in the fourth quarter of 2022 is 4.3 percent on November 23, up from 4.2 percent on November 17. After recent releases from the U.S. Census Bureau and the National Association of Realtors, the nowcast of fourth-quarter real gross private domestic investment growth increased from 0.4 percent to 1.0 percent.”
Please see below:
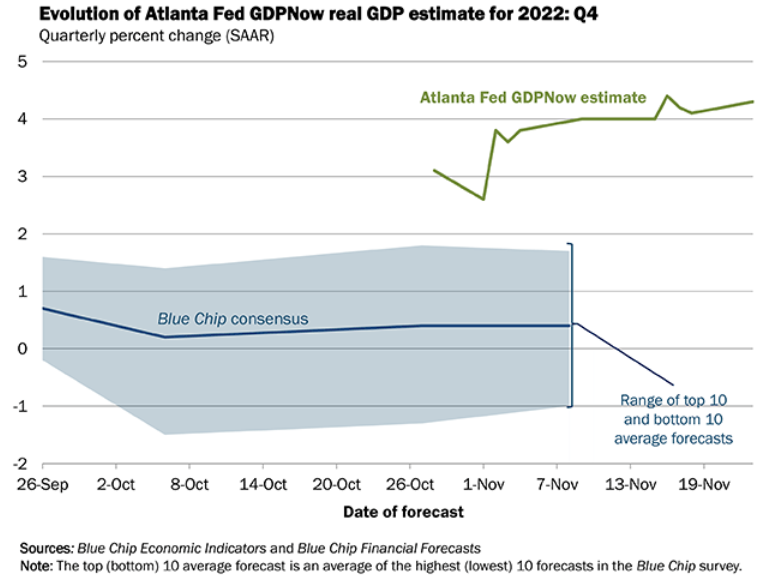
To explain, the green line above tracks the Atlanta Fed’s Q4 real GDP growth estimate, while the blue line above tracks the Blue Chip consensus estimate (investment banks). If you analyze the right side of the chart, you can see that the green line is far from levels that support a dovish 180.
Therefore, the price action materially contrasts the fundamental realities that should confront risk assets in the months ahead. With inflation still highly problematic and Fed officials continuing to increase their peak FFR projection, our previously out-of-consensus 2023 estimate of 4.5% to 5.5% will likely prove too low. Thus, don’t be surprised if inflation proves more troublesome than investors expect.
Is the Silver Price Approaching a Bearish Arc?
Teaser:
With liquidity-fueled assets underperforming the S&P 500, will the silver price be the next shoe to drop?
Article:
As the S&P 500 continues to seek higher ground, bullish seasonality has the crowd misreading the Fed’s intentions and the overall fundamental backdrop. Furthermore, with the price action beneath the surface also highly bearish, it’s an ominous sign when high-beta assets become laggards.
Please see below:
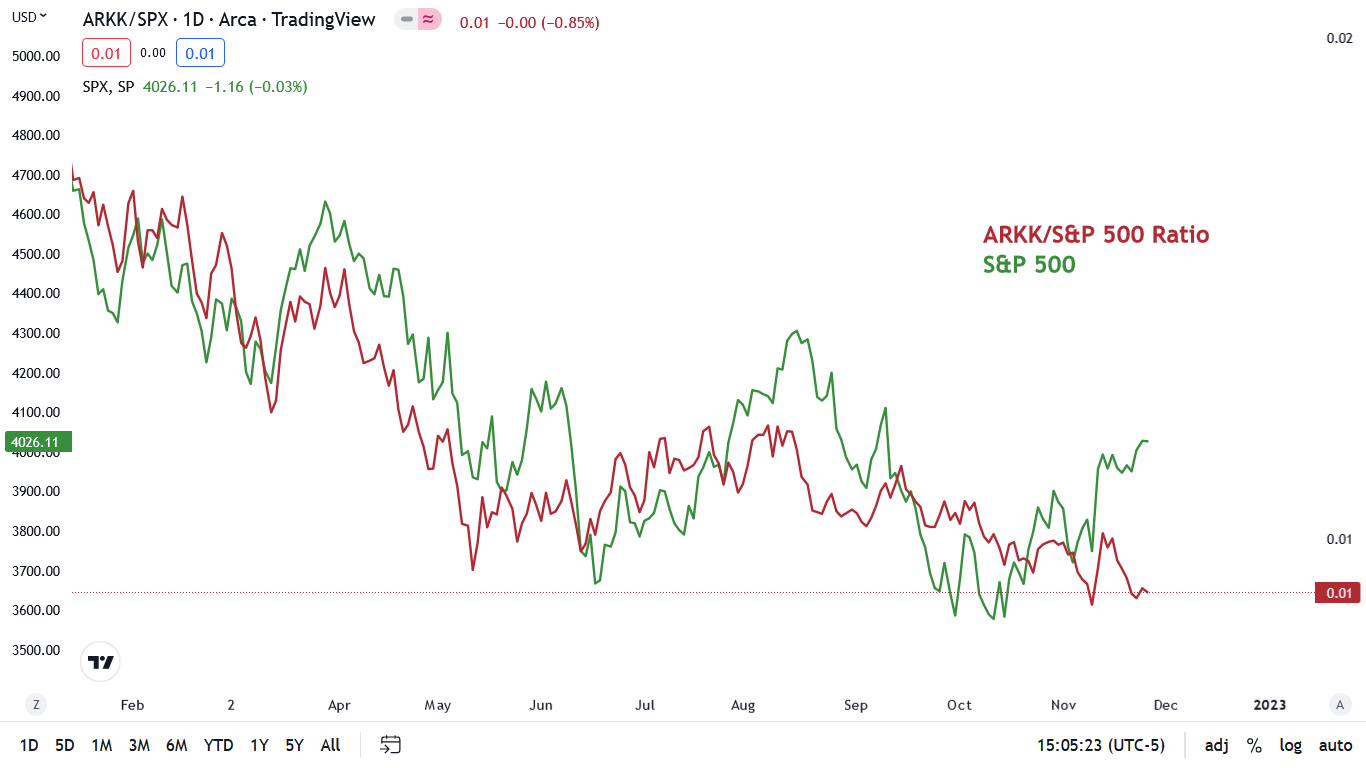
To explain, the green line above tracks the S&P 500, while the red line above tracks the ARK Innovation ETF (ARKK)/S&P 500 ratio. If you analyze the relationship, you can see that when the S&P 500 rises and falls, the red line often follows suit, which means the ARKK ETF often outperforms and underperforms the S&P 500 when the index rallies and declines.
In a nutshell: the ARKK ETF is a high-beta asset that’s more volatile than the S&P 500, and its movement is similar to how the silver price often rises and falls by more than the gold price during periods of optimism and pessimism.
However, if you turn to the right side of the chart, you can see that the S&P 500’s recent rally has culminated with the ARKK ETF materially underperforming (red line declining). As a result, it’s bearish when despite the narrative of an imminent Fed pivot, the behavior of liquidity-fueled stocks signals the exact opposite.
To that point, with the silver price often moving in close contact with the ARKK ETF since the Russia-Ukraine rally ended, new lows for the latter could have drastic implications for the former.
Please see below:
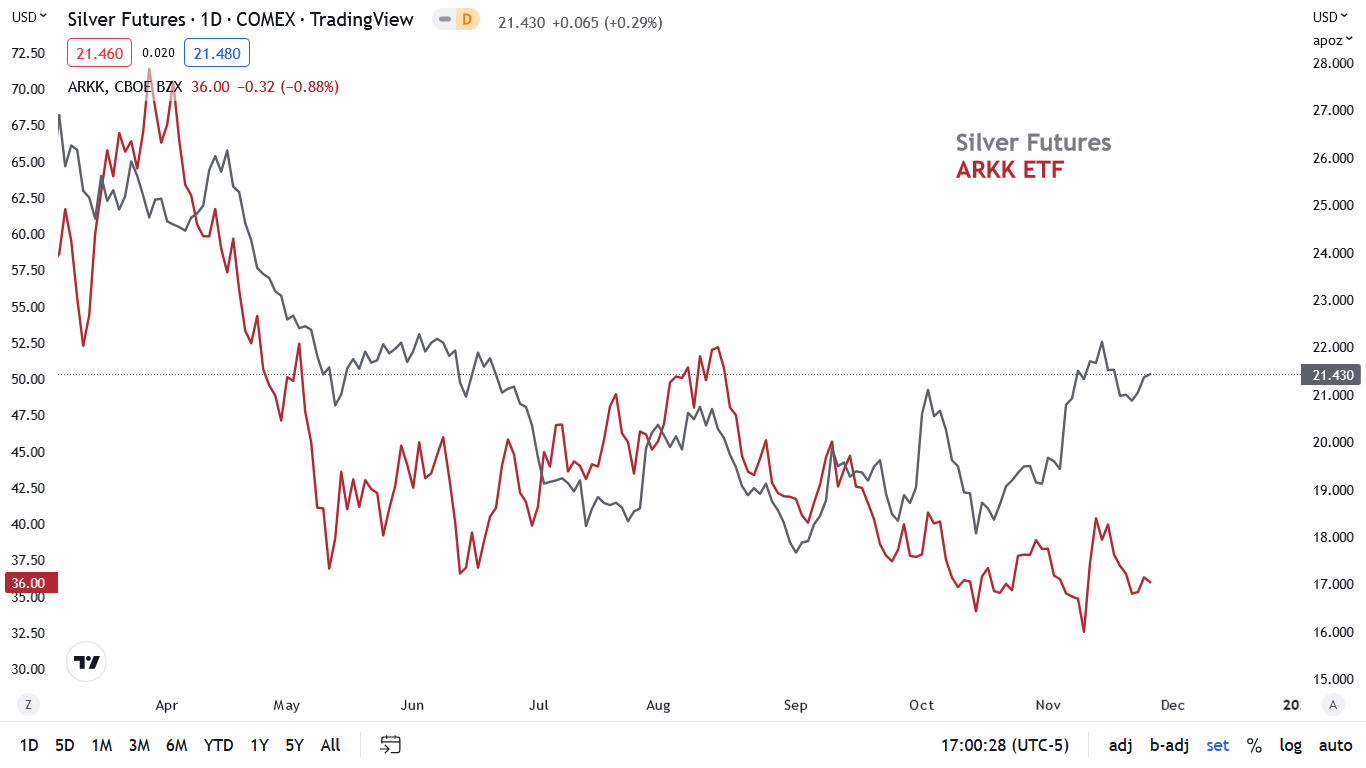
To explain, the red line above tracks the ARKK ETF, while the gray line above tracks the silver futures price. If you analyze the relationship, you can see that when liquidity-fueled stocks suffer, silver often exhibits similar weakness.
But, the large gap on the right side of the chart is reminiscent of silver’s outperformance in May and June. Yet, it wasn’t long before the silver price declined dramatically and the two lines reconnected once again.
So, while the white metal has showcased strength recently, the optimism is unlikely to continue if the ARKK ETF can’t catch a material bid. Moreover, with the Fed on a hawkish warpath to curb inflation, the S&P 500 and the ARKK ETF are overvalued relative to the fundamental backdrop that should confront stocks in the months ahead. As such, the silver price should also suffer when reality returns.
Wrong for Too Long
While I noted above that the Atlanta Fed’s Q4 real GDP growth estimate remains resilient, it’s only one-third of the fundamental equation that supports a higher FFR, real yields and USD Index. However, with consumer spending and employment also highly elevated, the lack of demand destruction should haunt the pivot bulls over the medium term.
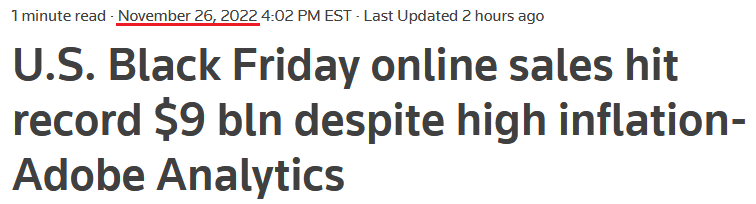
For example, I noted previously that U.S. retail sales materially outperformed expectations in October; and with online Black Friday sales hitting a record $9.12 billion according to Adobe Analytics, the strength came on the back of a record $5.29 billion in consumer spending on Thanksgiving Day.
Consequently, while I warned for many months that demand was much stronger than the consensus realized, Americans’ ability and willingness to spend should make the Fed’s inflation fight one of attrition.
Please see below:
 Source: Reuters
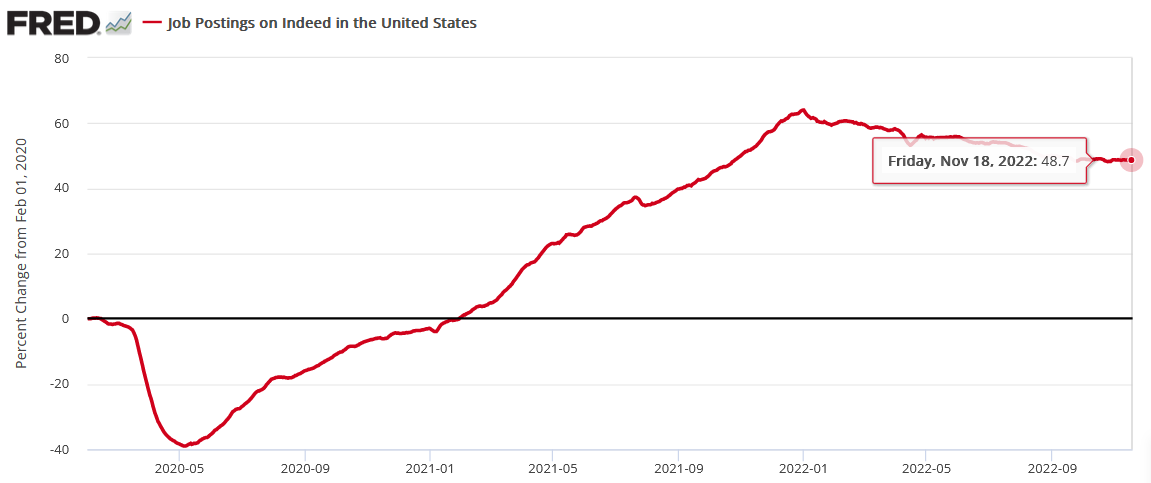
As for employment, Indeed updated its job postings data on Nov. 22; and with U.S. employment opportunities still 48.7% above their pre-pandemic baseline (for the week ending Nov. 18), little has been done to cool the U.S. labor market. As a result, until the red line declines substantially, wage and output inflation should remain elevated.
Please see below:
Likewise, S&P Global released its U.S. Composite PMI on Nov. 23. The headline index declined from 48.2 in October to 46.3 in November, and the deceleration was “the sharpest since August and among the quickest since 2009.”
However, the report added:
“In line with subdued demand, firms increased their workforce numbers only marginally in November. Hiring reportedly continued as firms tried to fill open vacancies for skilled workers, but the non-replacement of leavers (in an effort to cut costs) weighed on employment growth.”
So, please note that a marginal increase in employment is bullish for the FFR. Remember, the Fed needs the U.S. labor market to slow materially to reduce record wage inflation; and if U.S. firms are still increasing their headcount, the supply/demand imbalance has not been rectified, so a much higher FFR is required to normalize labor demand.
Also, while the consensus believes that a Fed pivot is forthcoming in 2023, the reality is that a recessionary plunge in growth, employment and consumer spending is required to make that hope a reality.
However, with Americans flush with cash and labor demand pushing up wages, the more the Fed slow rolls the FFR, the longer demand (and inflation) will persist. Consequently, the crowd doesn't realize that there is no easy way out of this conundrum, and I've warned repeatedly that despite investors' yearning for an unrealistic outcome, the Fed has two choices:
- Continue to raise the FFR, curb inflation and cause a recession.
- Pause rate hikes to stimulate growth and wait for inflation to cause an even worse recession.
Thus, while the Fed may aim for the perfect outcome, once inflation becomes unanchored, it’s nearly impossible to normalize the metric without causing a recession; and if they preach patience, inflation festers and eventually creates a worse recession. Therefore, while investors believe the Fed can achieve something that no committee has since 1954, history suggests otherwise.
S&P 500 Narratives
While the crowd makes it seem like a 50 or 25 basis point rate hike is the new dovish pivot, the reality is that higher interest rates are profoundly bearish for risk assets. For example, when risk-free assets offer higher yields, they reduce the incentive to purchase securities that could experience capital losses. Then, money flows from stocks, bonds (some), commodities, etc., to cash, as risk assets re-price to reflect a higher interest rate environment.
So, while prophecies of a new bull market may percolate as investors attempt to orchestrate a Santa Clause rally, no bear market since 1973 has ended without the Fed cutting interest rates.
Please see below:
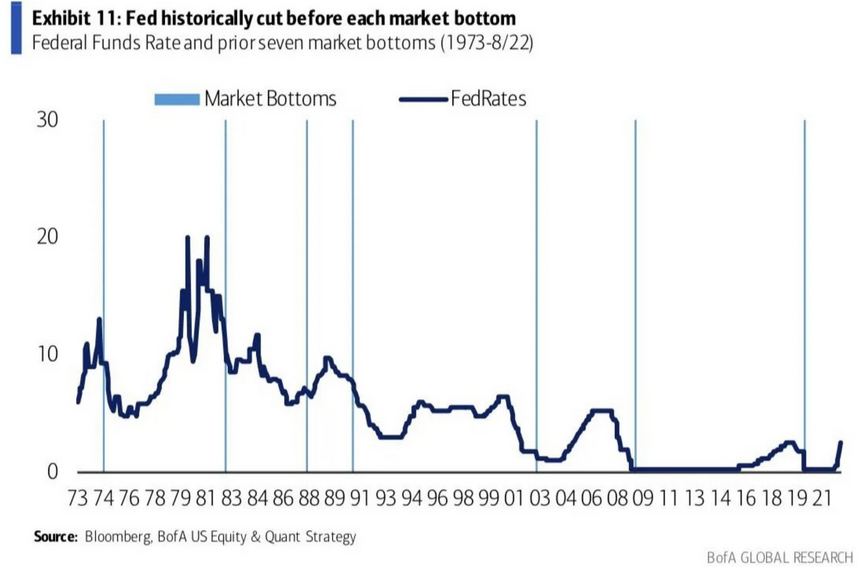
To explain, the dark blue line above tracks the FFR, while the vertical light blue lines represent stock market bottoms. If you analyze the intersections, you can see that rate cuts occur before the market bottoms. Now, I’ve noted previously that the first rate cut often doesn’t mark the final bottom, but it means the trough is likely to arrive sooner rather than later.
Yet, the Fed is nowhere near cutting interest rates. Remember, officials are talking about reducing the pace from 75 to 50 to 25 basis points (which has always been expected), and that’s still profoundly hawkish. Likewise, with growth, employment and consumer spending still uplifted, the idea of rate cuts is ridiculous. As a result, history shows that the S&P 500 is likely far from a medium-term bottom.
As further evidence, I’ve repeated that every inflation fight since 1954 has ended with a recession; and since no bear market since 1929 has ended before a recession began, a confluence of historical data materially contrasts the bullish narrative.
Please see below:
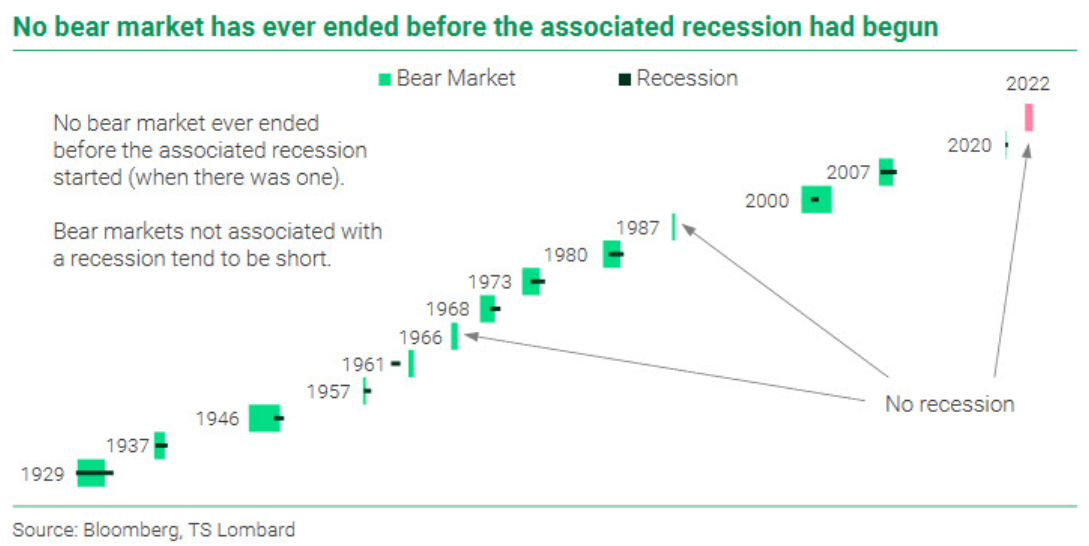
To explain, the light green blocks above represent bear markets and the horizontal dark green lines represent recessions. The data shows that bear markets suffer more downside when recessions hit, while the gray arrows show that bear markets without recessions are often short-lived.
Furthermore, since a recession hasn’t occurred in 2022, the bulls can point to 1966 and 1987 as similar analogies. However, with significant economic weakness poised to materialize as the Fed battles inflation, even the FOMC thinks a 2023 recession is highly likely. As such, this bear market should have plenty of room to run, and the GDXJ ETF often suffers mightily when the S&P 500 declines.
The Bottom Line
With the FOMC minutes providing another reality check, the dovish pivot is dead, and officials consider a recession their near base case. Moreover, when we connect the dots between inflation, recessions and the performance of the S&P 500 during these fundamental backdrops, the medium-term outlook is profoundly bearish.
Therefore, while gold, silver and mining stocks have benefited from the recent sentiment shift, the fundamentals have not changed: the Fed needs tighter financial conditions to curb inflation, which is bullish for the FFR, real yields and the USD Index; and with liquidity-fueled assets like the ARKK ETF struggling to find buyers, it’s relatively poor performance is likely a warning sign of what lies ahead.
In conclusion, the PMs were mixed on Nov. 25, as mining stocks ended the day in the red; and while the USD Index and U.S. Treasury nominal and real yields continue to consolidate, the pauses are normal occurrences within uptrends and should culminate with higher highs over the medium term. As a result, the PMs should head in the opposite
Overview of the Upcoming Part of the Decline
- It seems to me that the corrective upswing is over (or about to be over) and that the next big move lower is already underway (or that it’s about to start).
- If we see a situation where miners slide in a meaningful and volatile way while silver doesn’t (it just declines moderately), I plan to – once again – switch from short positions in miners to short positions in silver. At this time, it’s too early to say at what price levels this could take place and if we get this kind of opportunity at all – perhaps with gold prices close to $1,500 - $1,550.
- I plan to switch from the short positions in junior mining stocks or silver (whichever I’ll have at that moment) to long positions in junior mining stocks when gold / mining stocks move to their 2020 lows (approximately). While I’m probably not going to write about it at this stage yet, this is when some investors might consider getting back in with their long-term investing capital (or perhaps 1/3 or 1/2 thereof).
- I plan to return to short positions in junior mining stocks after a rebound – and the rebound could take gold from about $1,450 to about $1,550, and it could take the GDXJ from about $20 to about $24. In other words, I’m currently planning to go long when GDXJ is close to $20 (which might take place when gold is close to $1,450), and I’m planning to exit this long position and re-enter the short position once we see a corrective rally to $24 in the GDXJ (which might take place when gold is close to $1,550).
- I plan to exit all remaining short positions once gold shows substantial strength relative to the USD Index while the latter is still rallying. This may be the case with gold prices close to $1,400 and GDXJ close to $15 . This moment (when gold performs very strongly against the rallying USD and miners are strong relative to gold after its substantial decline) is likely to be the best entry point for long-term investments, in my view. This can also happen with gold close to $1,400, but at the moment it’s too early to say with certainty.
- The above is based on the information available today, and it might change in the following days/weeks.
You will find my general overview of the outlook for gold on the chart below:

Please note that the above timing details are relatively broad and “for general overview only” – so that you know more or less what I think and how volatile I think the moves are likely to be – on an approximate basis. These time targets are not binding nor clear enough for me to think that they should be used for purchasing options, warrants, or similar instruments.
Summary
Summing up, last week’s shooting star reversal candlestick in gold already resulted in lower gold prices, and as Bitcoin forms its short-term bottom, the big decline in the precious metals sector (especially in junior mining stocks) is likely to resume.
I would like to take this opportunity to congratulate you on your patience with this trade (and I’m grateful for your understanding that not every corrective upswing can be “caught” in trading terms). Many investors and traders panic and get out of the market exactly at the wrong time, but your patience and self-discipline mean that you’re poised to make the most of what the market brings us this and next year.
Moving back to the market, it appears to be yet another time when the markets are incorrectly expecting the Fed to make a dovish U-turn, and based on this, the part of the 2008 decline where we saw the biggest corrective upswing materialized.
In my opinion, the current trading position is going to become profitable in the following weeks, and quite possibly in the following days. And while I can’t promise any kind of performance, I fully expect it to become very profitable before it’s over and to prolong our 2022 winning streak.
After the final sell-off (that takes gold to about $1,350-$1,500), I expect the precious metals to rally significantly. The final part of the decline might take as little as 1-5 weeks, so it's important to stay alert to any changes.
To summarize:
Trading capital (supplementary part of the portfolio; our opinion): Full speculative short positions (300% of the full position) in junior mining stocks are justified from the risk to reward point of view with the following binding exit profit-take price levels:
Mining stocks (price levels for the GDXJ ETF): binding profit-take exit price: $20.32; stop-loss: none (the volatility is too big to justify a stop-loss order in case of this particular trade)
Alternatively, if one seeks leverage, we’re providing the binding profit-take levels for the JDST (2x leveraged). The binding profit-take level for the JDST: $27.87; stop-loss for the JDST: none (the volatility is too big to justify a SL order in case of this particular trade).
For-your-information targets (our opinion; we continue to think that mining stocks are the preferred way of taking advantage of the upcoming price move, but if for whatever reason one wants / has to use silver or gold for this trade, we are providing the details anyway.):
Silver futures downside profit-take exit price: $12.32
SLV profit-take exit price: $11.32
ZSL profit-take exit price: $74.87
Gold futures downside profit-take exit price: $1,504
HGD.TO – alternative (Canadian) 2x inverse leveraged gold stocks ETF – the upside profit-take exit price: $18.47
HZD.TO – alternative (Canadian) 2x inverse leveraged silver ETF – the upside profit-take exit price: $46.87
Long-term capital (core part of the portfolio; our opinion): No positions (in other words: cash)
Insurance capital (core part of the portfolio; our opinion): Full position
Whether you’ve already subscribed or not, we encourage you to find out how to make the most of our alerts and read our replies to the most common alert-and-gold-trading-related-questions.
Please note that we describe the situation for the day that the alert is posted in the trading section. In other words, if we are writing about a speculative position, it means that it is up-to-date on the day it was posted. We are also featuring the initial target prices to decide whether keeping a position on a given day is in tune with your approach (some moves are too small for medium-term traders, and some might appear too big for day-traders).
Additionally, you might want to read why our stop-loss orders are usually relatively far from the current price.
Please note that a full position doesn't mean using all of the capital for a given trade. You will find details on our thoughts on gold portfolio structuring in the Key Insights section on our website.
As a reminder - "initial target price" means exactly that - an "initial" one. It's not a price level at which we suggest closing positions. If this becomes the case (as it did in the previous trade), we will refer to these levels as levels of exit orders (exactly as we've done previously). Stop-loss levels, however, are naturally not "initial", but something that, in our opinion, might be entered as an order.
Since it is impossible to synchronize target prices and stop-loss levels for all the ETFs and ETNs with the main markets that we provide these levels for (gold, silver and mining stocks - the GDX ETF), the stop-loss levels and target prices for other ETNs and ETF (among other: UGL, GLL, AGQ, ZSL, NUGT, DUST, JNUG, JDST) are provided as supplementary, and not as "final". This means that if a stop-loss or a target level is reached for any of the "additional instruments" (GLL for instance), but not for the "main instrument" (gold in this case), we will view positions in both gold and GLL as still open and the stop-loss for GLL would have to be moved lower. On the other hand, if gold moves to a stop-loss level but GLL doesn't, then we will view both positions (in gold and GLL) as closed. In other words, since it's not possible to be 100% certain that each related instrument moves to a given level when the underlying instrument does, we can't provide levels that would be binding. The levels that we do provide are our best estimate of the levels that will correspond to the levels in the underlying assets, but it will be the underlying assets that one will need to focus on regarding the signs pointing to closing a given position or keeping it open. We might adjust the levels in the "additional instruments" without adjusting the levels in the "main instruments", which will simply mean that we have improved our estimation of these levels, not that we changed our outlook on the markets. We are already working on a tool that would update these levels daily for the most popular ETFs, ETNs and individual mining stocks.
Our preferred ways to invest in and to trade gold along with the reasoning can be found in the how to buy gold section. Furthermore, our preferred ETFs and ETNs can be found in our Gold & Silver ETF Ranking.
As a reminder, Gold & Silver Trading Alerts are posted before or on each trading day (we usually post them before the opening bell, but we don't promise doing that each day). If there's anything urgent, we will send you an additional small alert before posting the main one.
Thank you.
Przemyslaw K. Radomski, CFA
Founder, Editor-in-chief

