

Briefly: in our opinion, full (200% of the regular size of the position) speculative short positions in gold, silver and mining stocks are justified from the risk/reward perspective at the moment of publishing this alert.
The major events and price moves are usually preceded by many signs that point to them. Yet, almost everyone sees these signs only after the event or price move has taken place. Looking at specific historical events would have made one predict the world wars (yet practically nobody did); and looking at specific price/volume developments would make one predict the critical price moves before they unfold (yet practically nobody does it). What if we told you that there are signals for gold that are so extremely visible that it almost hurts that people are not seeing them? What if you could take advantage of the if-I-only-knew signals before the key move happens? What if we further added that we were describing these signals in today’s Alert? It’s all true.
Before moving to the above, however, let’s quickly discuss the issue you might be wondering about with regard to yesterday’s price moves. The USD Index moved higher yesterday, and it should have caused gold, silver and mining stocks to decline. But it didn’t. The rally that we saw was particularly visible in the case of silver, but all parts of the PM market ended the session higher, thus confirming silver’s move. Did yesterday’s relative strength invalidate the previous bearish case?
Not at all. That was just a single-day event that took place after a sizable move lower and a pause after such days is nothing extraordinary. Besides, as we explained yesterday, looking at the USD Index along without taking individual exchange rates into account might be misleading. Yesterday’s developments put an exclamation mark after the above, so we’ll start today’s analysis with the USD Index and the Japanese yen (charts courtesy of http://stockcharts.com).
USD’s Pause and Yen’s Critical Breakdown
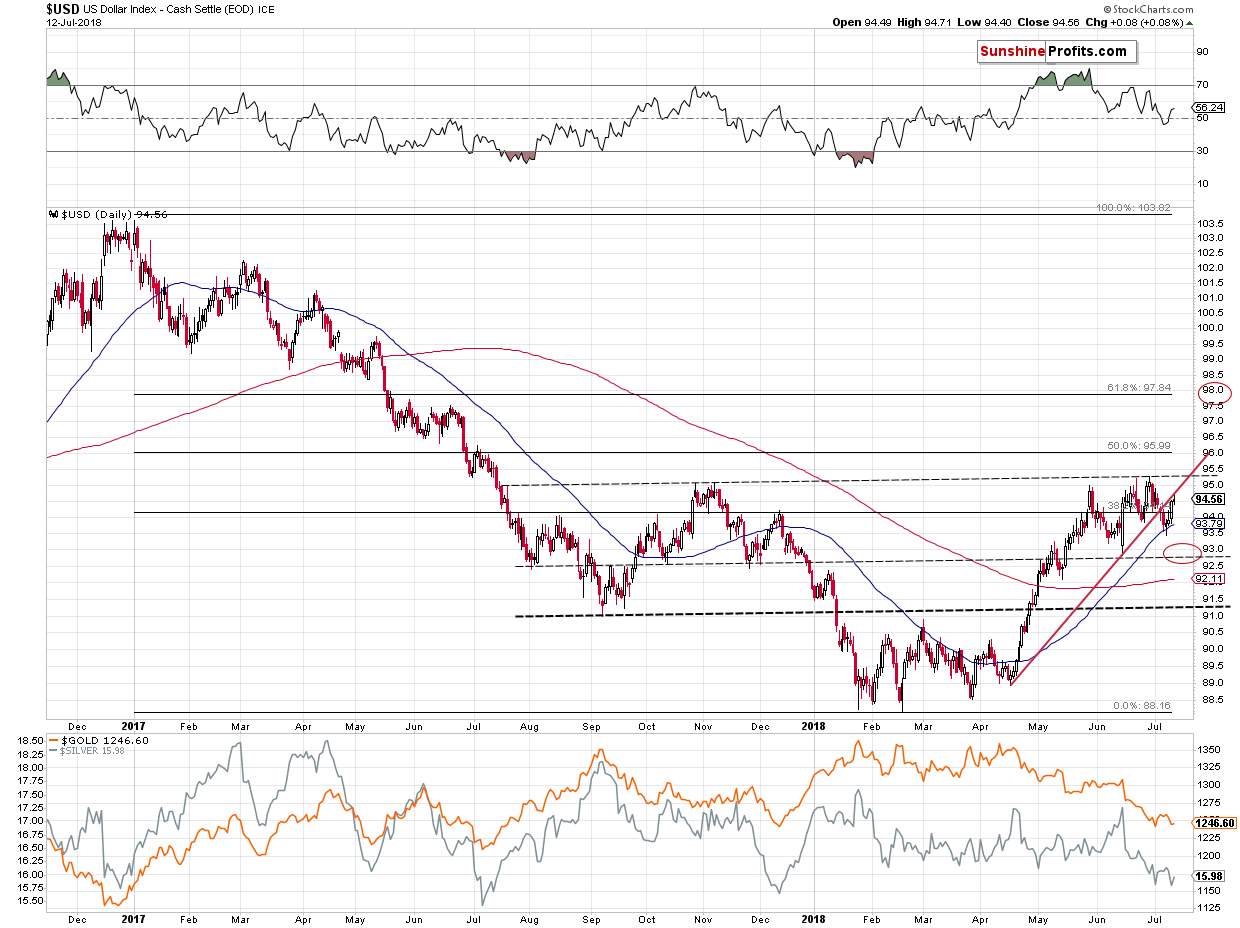
The USD Index moved higher rather insignificantly. USDX didn’t manage to move back above the rising red support/resistance line. Consequently, our yesterday’s comments remain up-to-date:
The USD Index has recently moved below the rising red support line and this was the factor that was supposed to take it much lower and trigger a sizable rally in gold. At first sight, nothing really changed in the case of the USDX – it’s still below the rising red support line, possibly verifying it as resistance.
But, in this case it seems like the devil is in the details. The key 2 components of the USD Index are the euro and the yen. The euro moved very close to its resistance and it seems to be in the decline mode. The situation in the Japanese yen is also very specific.
In the past few Alerts we discussed yen’s short- and medium-term breakdowns and we wrote that they – along with yesterday’s pre-market decline – were a very good reason for a long-term breakdown.
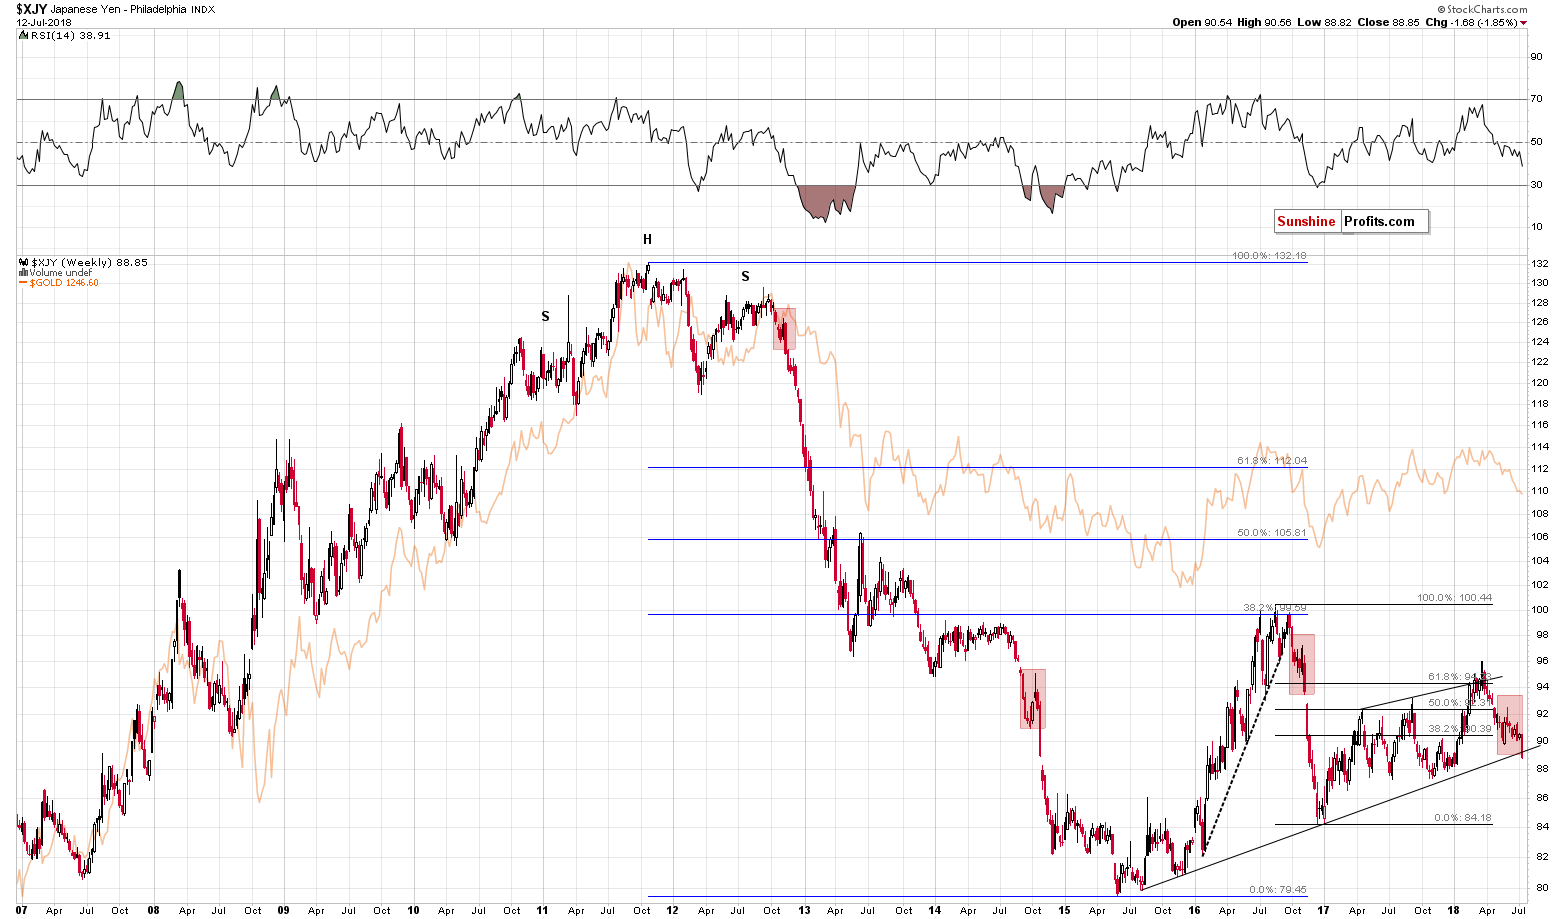
And we saw it. The Japanese yen just broke below the key long-term support line. Also, when viewing the currency while using the linear scale instead of a logarithmic one, this breakdown took place even sooner.
This is the most profound development on the long-term yen chart since the late-2016 breakdown. The results are clearly visible – a huge decline in the currency. And in gold.
There are multiple factors pointing to lower gold prices right now and this breakdown is one of the most important ones. Naturally, the breakdowns need to be confirmed, before their implications are completely bearish. But, let’s keep in mind that the yen is already after short- and medium-term breakdowns.
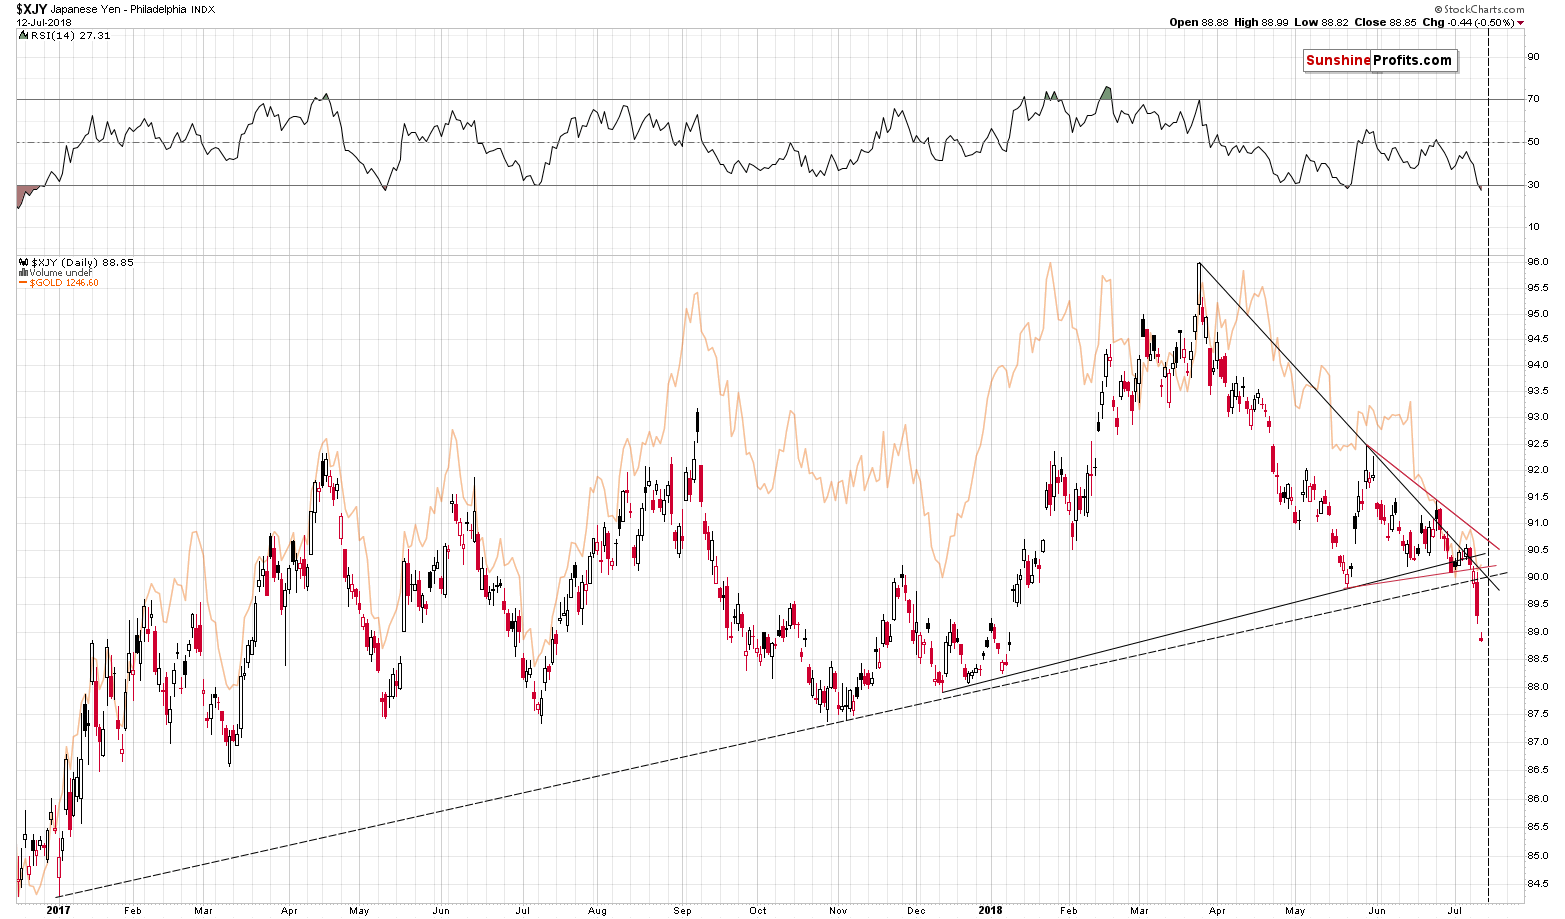
The breakdown below the red triangle is definitely confirmed and the move below the rising dashed line is almost fully confirmed. Almost, because ideally we would want to see three consecutive trading closes below a certain price level to say that the breakdown is verified, but at the same time there has been no rally so far today, so it seems that we’ll have the third day today. Plus, the breakdowns can be verified if the move below a given support level is really significant – and this also seems to be the case right now.
So, based on the short- and medium-term breakdowns, we are likely to see a confirmation of the long-term breakdown. This makes the outlook already very bearish.
Let’s keep in mind that there’s a triangle-apex-based reversal today (vertical dashed line), which may mean that we’ll see a decline today and a corrective upswing on Monday (more probable) or that a reversal will take place today. This may happen and if it does, there’s no need to be stressed about it – it would be a normal course of action.
Action that we think is best to be left ignored – i.e. we don’t think that adjusting the positions is a good idea. Why? Because of what happened after similar situations in the past. Please take one more look at the long-term Japanese yen chart. There were three similar cases to the very recent one and we marked them with red rectangles. All corrective upswings after these similar patterns were so tiny that they are practically invisible on the above chart. In all these cases it was much better to just hold on to a position than to try to time every correction. That’s what we plan to do in the near term with regard to our positions in the metals – unless something major happens we’ll likely stick to the short positions.
All in all, the implications for the precious metals market were bearish and are now very bearish.
Speaking of precious metals, let’s briefly discuss what happened in the sector yesterday.
Just a Pause
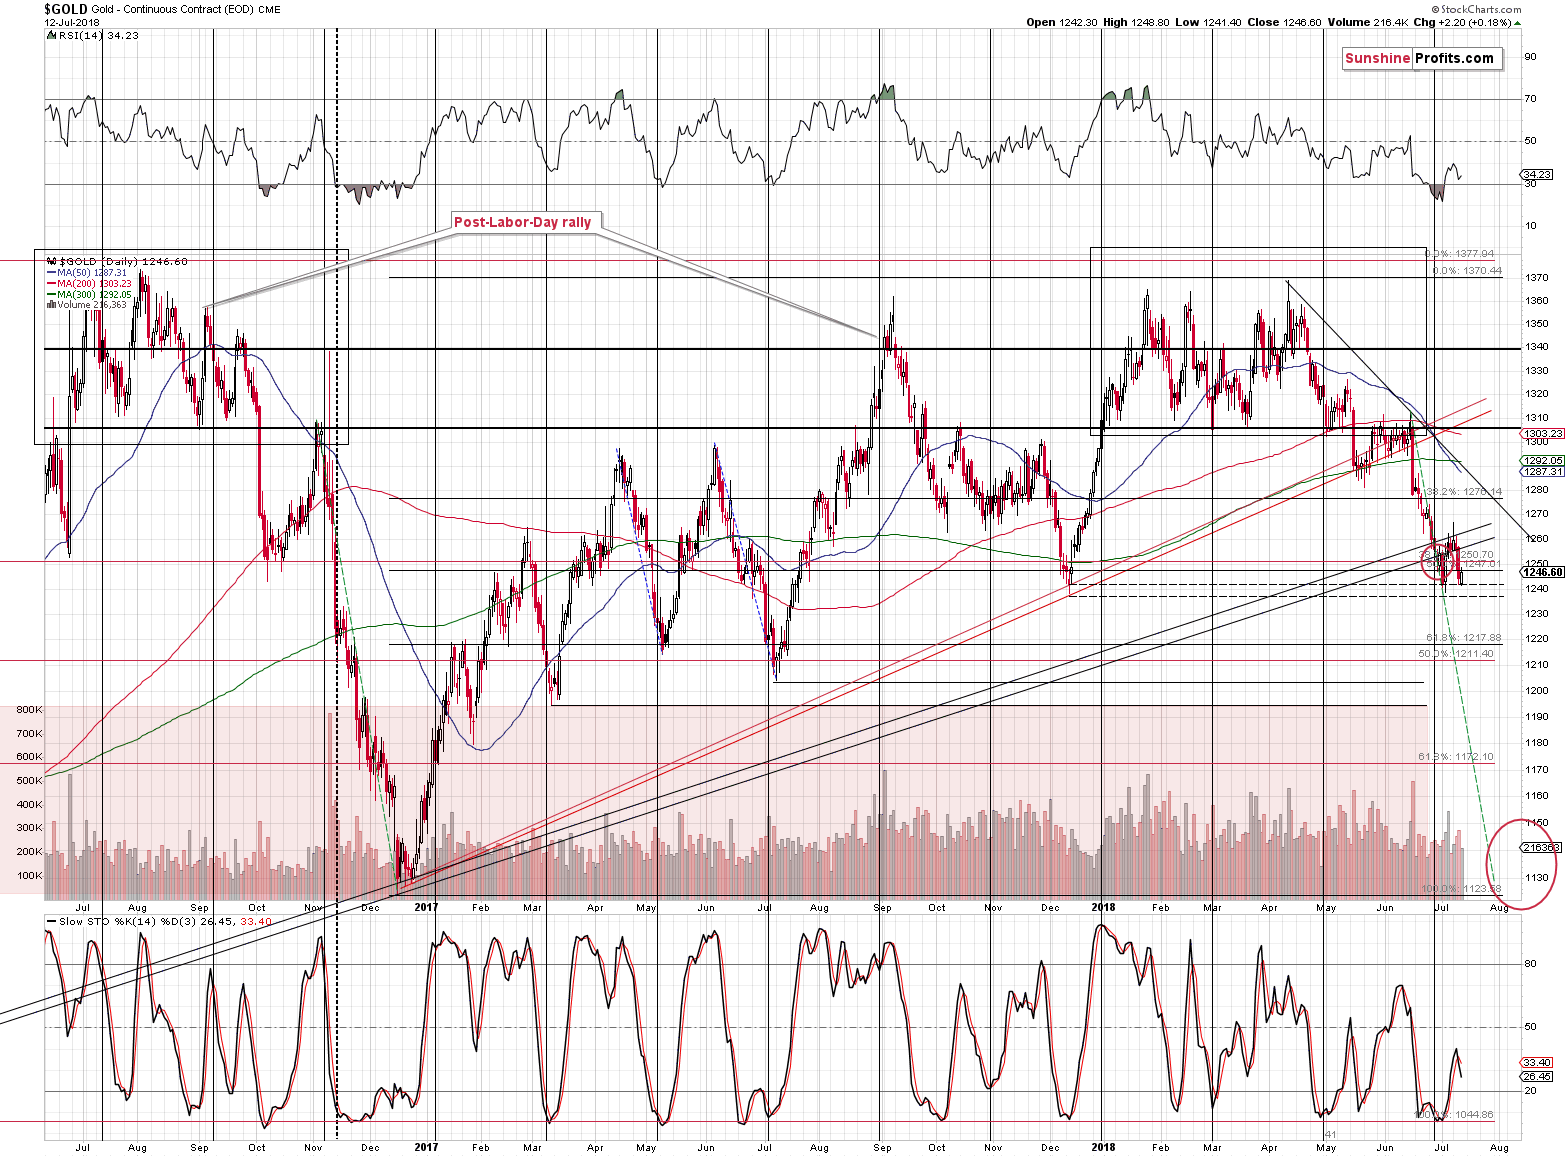
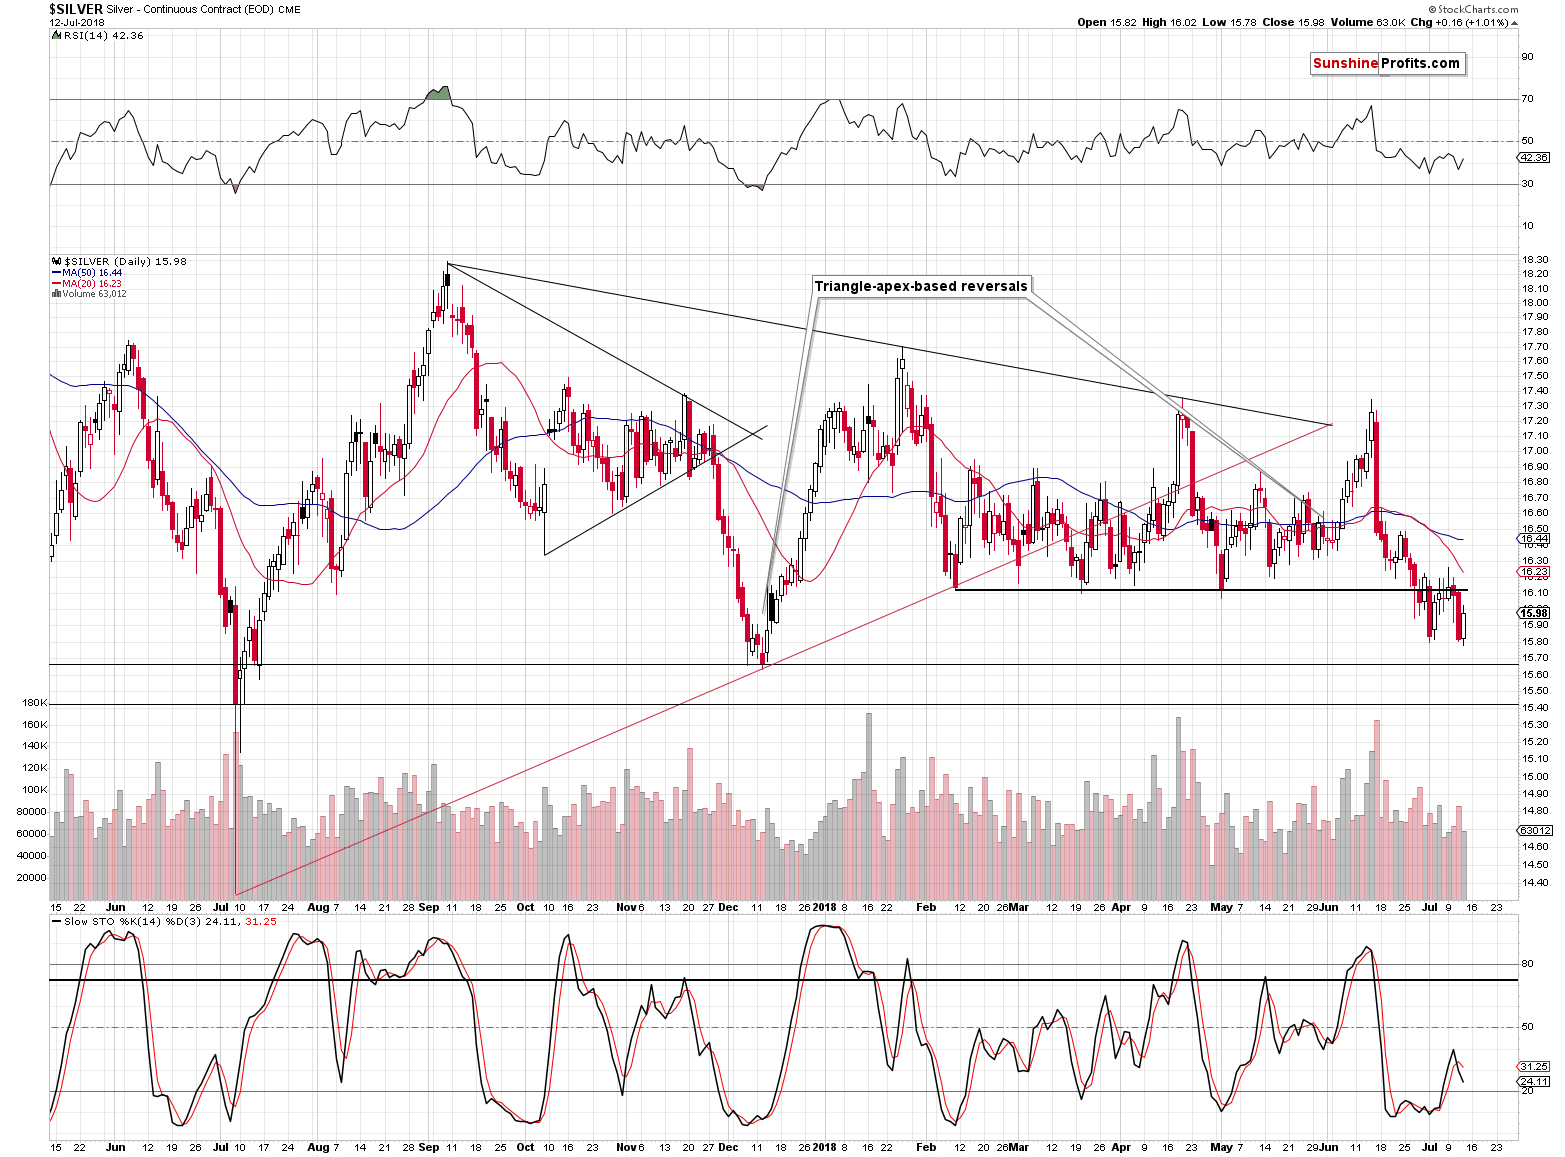
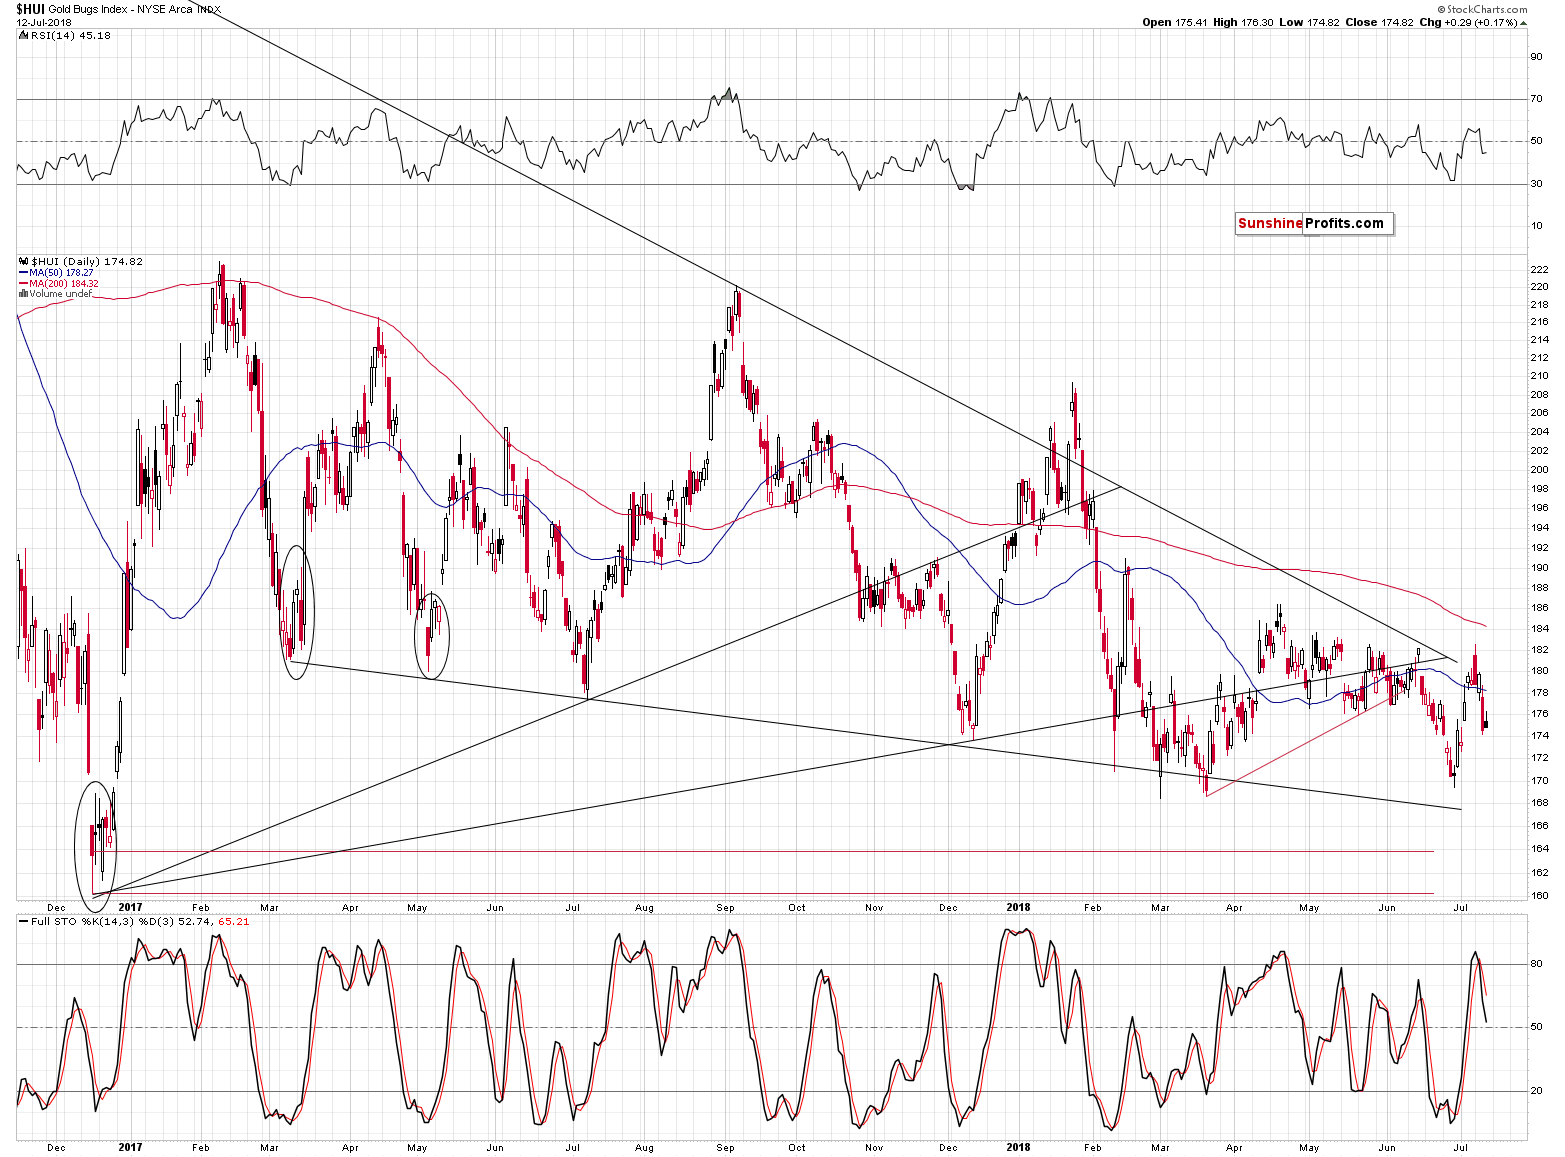
Briefly, because all we saw yesterday was a pause and there’s not much that can be said about it. The volume was relatively low during the upswing, which is exactly what we should see during a daily pause within a decline. Moreover, silver outperformed, while gold stocks underperformed, which is the perfect bearish confirmation. Plus, sell signals from the Stochastic indicators remain in place.
All in all, even though the precious metals sector moved a bit higher yesterday, it was a perfectly bearish session.
Before summarizing, we have one more chart for you today, which shows how serious the situation is.
Gold vs. Stocks
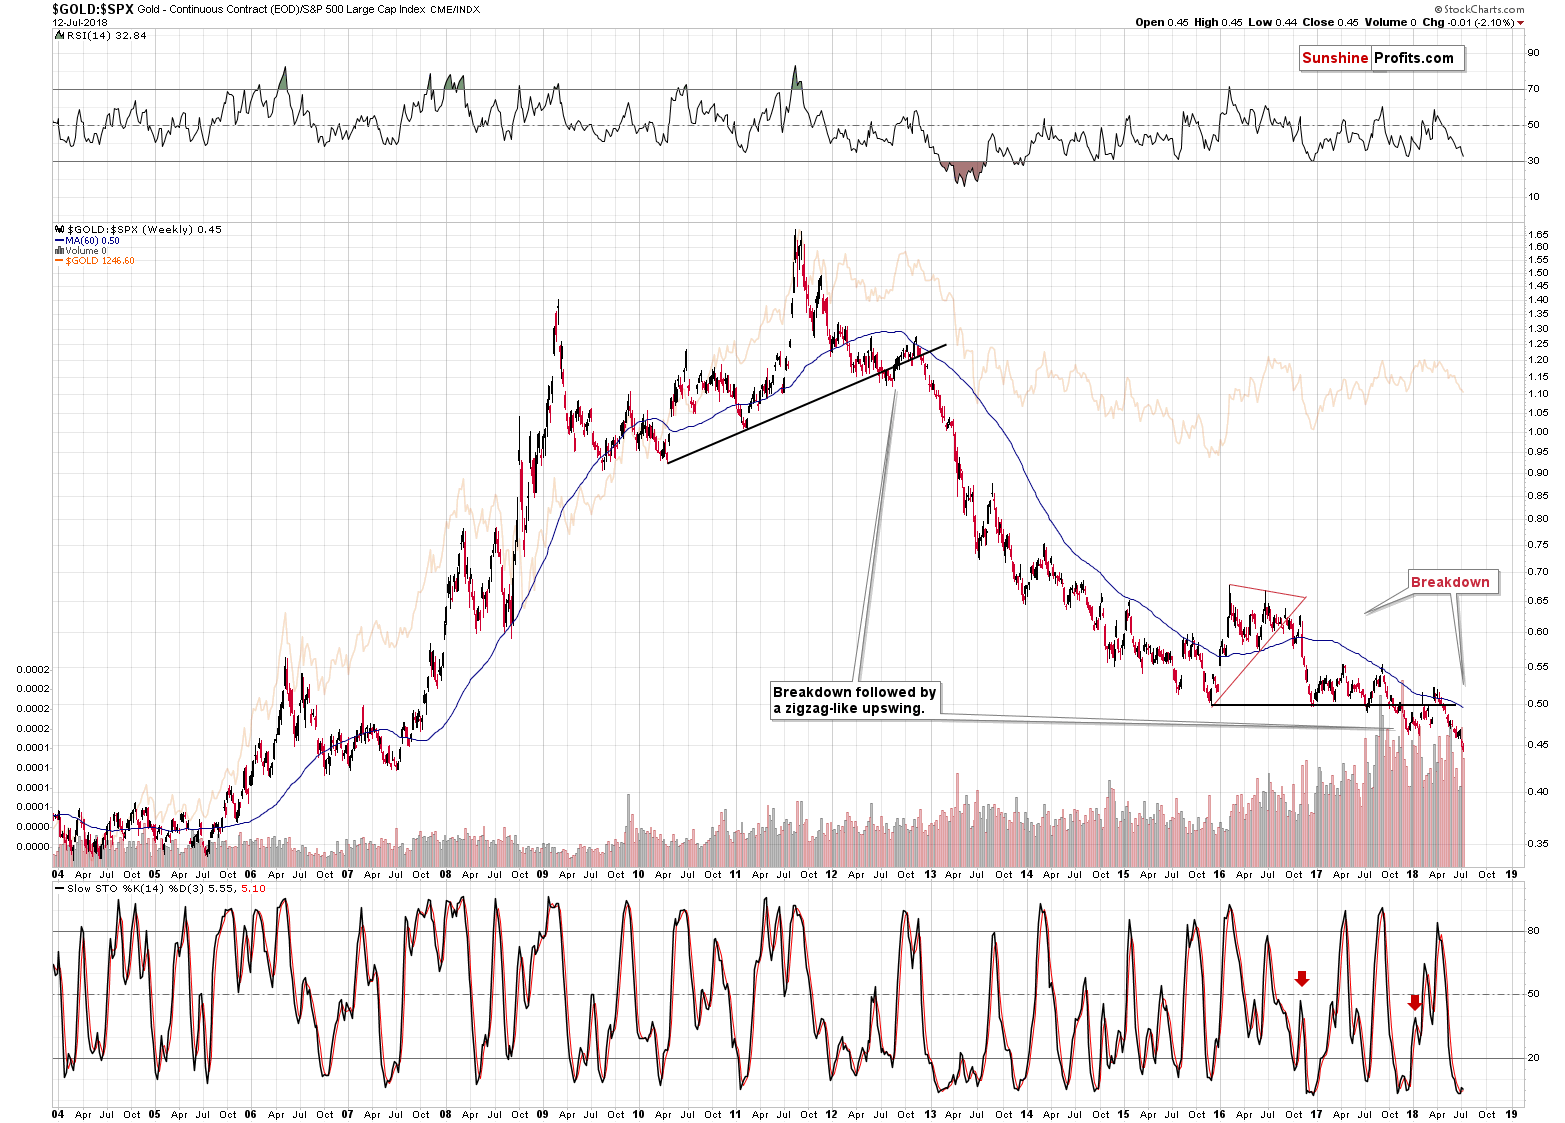
The ratio between gold and S&P 500 is moving to new lows after breaking below a major support level. Not only did we see a breakdown – the breakdown was actually very similar to the late-2012 breakdown.
Both breakdowns were followed by an initial invalidation, then a small move back below it, then a move back above the line and the previous high and then we saw the final breakdown. Also, in both cases, there was a tiny pause after the gold to S&P ratio moved below its previous low.
What happened next? THE decline. In both the ratio and in gold. You know very well how much gold declined, so we won’t focus on that. Instead, we want to emphasize the fact that the breakdown and subsequent decline were much clearer and visible earlier in the case of the ratio than in the case of gold. That’s exactly what we see right now. The breakdown in the ratio is as clear as possible.
This is one of the things that will be obvious in hindsight for everyone (the same goes for the breakdown in the Japanese yen), but only very few will know about the importance of these developments while they are unfolding. And even fewer investors will take advantage of them.
Summary
Summing up, the outlook for the precious metals sector was already extremely bearish yesterday and based on the yen’s long-term breakdown and on the short-term confirmations, it became even more bearish. It’s so bearish that it’s becoming problematic to write about it – there are not many words that can be used to further increase the intensity beyond the word “extreme”. The extra-large short positions in gold, silver, and mining stocks are definitely justified from the risk to reward point of view. The profits on the short position that we opened just a few days ago are increasing further today and it’s likely that they will increase much more before this trade is over.
As always, we’ll keep you – our subscribers – informed.
To summarize:
Trading capital (supplementary part of the portfolio; our opinion): Full short positions (200% of the full position) in gold, silver and mining stocks are justified from the risk/reward perspective with the following stop-loss orders and initial target price levels:
- Gold: initial target price: $1,142; stop-loss: $1,272; initial target price for the DGLD ETN: $63.96; stop-loss for the DGLD ETN $46.38
- Silver: initial target price: $14.42; stop-loss: $16.46; initial target price for the DSLV ETN: $32.97; stop-loss for the DSLV ETN $24.07
- Mining stocks (price levels for the GDX ETF): initial target price: $19.12; stop-loss: $23.64; initial target price for the DUST ETF: $37.97; stop-loss for the DUST ETF $20.87
In case one wants to bet on junior mining stocks' prices (we do not suggest doing so – we think senior mining stocks are more predictable in the case of short-term trades – but if one wants to do it anyway, we provide the details), here are the stop-loss details and initial target prices:
- GDXJ ETF: initial target price: $28.10; stop-loss: $34.82
- JDST ETF: initial target price: $74.83 stop-loss: $42.78
Long-term capital (core part of the portfolio; our opinion): No positions (in other words: cash)
Insurance capital (core part of the portfolio; our opinion): Full position
Important Details for New Subscribers
Whether you already subscribed or not, we encourage you to find out how to make the most of our alerts and read our replies to the most common alert-and-gold-trading-related-questions.
Please note that the in the trading section we describe the situation for the day that the alert is posted. In other words, it we are writing about a speculative position, it means that it is up-to-date on the day it was posted. We are also featuring the initial target prices, so that you can decide whether keeping a position on a given day is something that is in tune with your approach (some moves are too small for medium-term traders and some might appear too big for day-traders).
Plus, you might want to read why our stop-loss orders are usually relatively far from the current price.
Please note that a full position doesn’t mean using all of the capital for a given trade. You will find details on our thoughts on gold portfolio structuring in the Key Insights section on our website.
As a reminder – “initial target price” means exactly that – an “initial” one, it’s not a price level at which we suggest closing positions. If this becomes the case (like it did in the previous trade) we will refer to these levels as levels of exit orders (exactly as we’ve done previously). Stop-loss levels, however, are naturally not “initial”, but something that, in our opinion, might be entered as an order.
Since it is impossible to synchronize target prices and stop-loss levels for all the ETFs and ETNs with the main markets that we provide these levels for (gold, silver and mining stocks – the GDX ETF), the stop-loss levels and target prices for other ETNs and ETF (among other: UGLD, DGLD, USLV, DSLV, NUGT, DUST, JNUG, JDST) are provided as supplementary, and not as “final”. This means that if a stop-loss or a target level is reached for any of the “additional instruments” (DGLD for instance), but not for the “main instrument” (gold in this case), we will view positions in both gold and DGLD as still open and the stop-loss for DGLD would have to be moved lower. On the other hand, if gold moves to a stop-loss level but DGLD doesn’t, then we will view both positions (in gold and DGLD) as closed. In other words, since it’s not possible to be 100% certain that each related instrument moves to a given level when the underlying instrument does, we can’t provide levels that would be binding. The levels that we do provide are our best estimate of the levels that will correspond to the levels in the underlying assets, but it will be the underlying assets that one will need to focus on regarding the signs pointing to closing a given position or keeping it open. We might adjust the levels in the “additional instruments” without adjusting the levels in the “main instruments”, which will simply mean that we have improved our estimation of these levels, not that we changed our outlook on the markets. We are already working on a tool that would update these levels on a daily basis for the most popular ETFs, ETNs and individual mining stocks.
Our preferred ways to invest in and to trade gold along with the reasoning can be found in the how to buy gold section. Additionally, our preferred ETFs and ETNs can be found in our Gold & Silver ETF Ranking.
As a reminder, Gold & Silver Trading Alerts are posted before or on each trading day (we usually post them before the opening bell, but we don't promise doing that each day). If there's anything urgent, we will send you an additional small alert before posting the main one.
=====
Latest Free Trading Alerts:
Although last week’s decline took the USD Index under the late June’s lows, currency bulls didn’t break down with this deterioration and responded to their rivals fairly in previous days. Thanks to their determination, the greenback has wiped out most of the recent decline, which in combination with several other positive factors about which we wrote in today's Forex Trading Alert suggests that ...
Greece? Forget it – Italy is the real sick man of Europe! We invite you to read our today’s article about the Italian crisis and its likely effects on the gold market. Is the recent turmoil on the Apennine Peninsula a one-off event? Will the euro survive? Let’s read our article and find out!
The move up seemed to be continuing and the first impression was that we were seeing a first period of appreciation in some time. But the operative word here is “seemed.” If we take a closer look at what the current environment really is, the picture is far less pretty.
=====
Hand-picked precious-metals-related links:
PRECIOUS-Gold prices subdued as dollar extends gains
Perth Mint Bullion Demand Down in First Half of 2018; Silver Sales Plunge
Gold Prices To End The Year Below $1,200 As Fed Takes Priority — Westpac
Gold has not entered a new bear market
Freeport Unveils Indonesia Price But Plenty Left to Resolve
=====
In other news:
Global stocks rally before earnings, trade war jolt boosts dollar
Euro, yuan dive as U.S.-China trade concern boosts dollar
U.S. accuses North Korea of U.N. sanctions breach, demands end to fuel sales
Trade War Sparks Mounting Concerns of Growth Risks: Economy Week
Oil Set for Biggest Weekly Slump in 5 Months on Trade War Fears
=====
Thank you.
Sincerely,
Przemyslaw Radomski, CFA
Founder, Editor-in-chief, Gold & Silver Fund Manager
Gold & Silver Trading Alerts
Forex Trading Alerts
Oil Investment Updates
Oil Trading Alerts

