

Although last week’s decline took the USD Index under the late June’s lows, currency bulls didn’t break down with this deterioration and responded to their rivals fairly in previous days. Thanks to their determination, the greenback has wiped out most of the recent decline, which in combination with several other positive factors about which we wrote in today's Forex Trading Alert suggests that ...
Before, we analyze the current situation in our currency pairs, let’s examine the short-term picture of the USD Index.
Focus on the Greenback
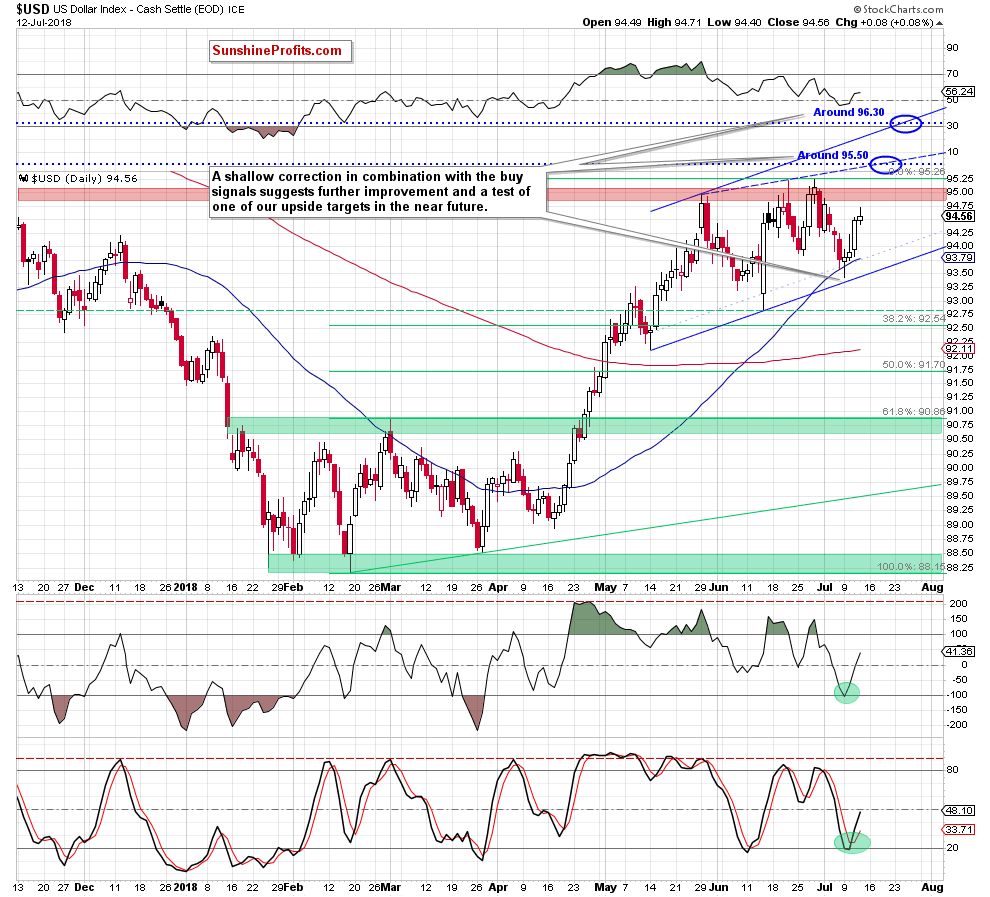
Looking at the daily chart, we see that although the USD Index moved lower last week, the size of that correction was quite small compared to the upward move that we could observe in the previous months.
As you see, the greenback didn’t even reach the blue support line based on the previous lows, not to mention a decrease to June’s low or the 38.2% Fibonacci retracement based on the entire February-June increases.
Such price action shows that currency bulls are stronger than it seemed at the beginning of the week. Therefore, we think that further improvement in the coming days is very likely – especially when we factor in the buy signals generated by the CCI and the Stochastic Oscillator.
So, how high could the index go in the coming week?
In our opinion, if the greenback extends gains from current levels, the initial upside target will be around 95.30, where the June peak is. Nevertheless, taking into account the above-mentioned show of the bulls’ strength, it seems that the index will test the blue doted resistance line based on the previous highs (around 95.50) or even the upper border of a potential blue rising trend channel (around 96.30) in the following days.
How such price action could affect our opened positions? Let’s examine the current situation in the Forex market.
Will EUR/USD Drop Below 1.6000?
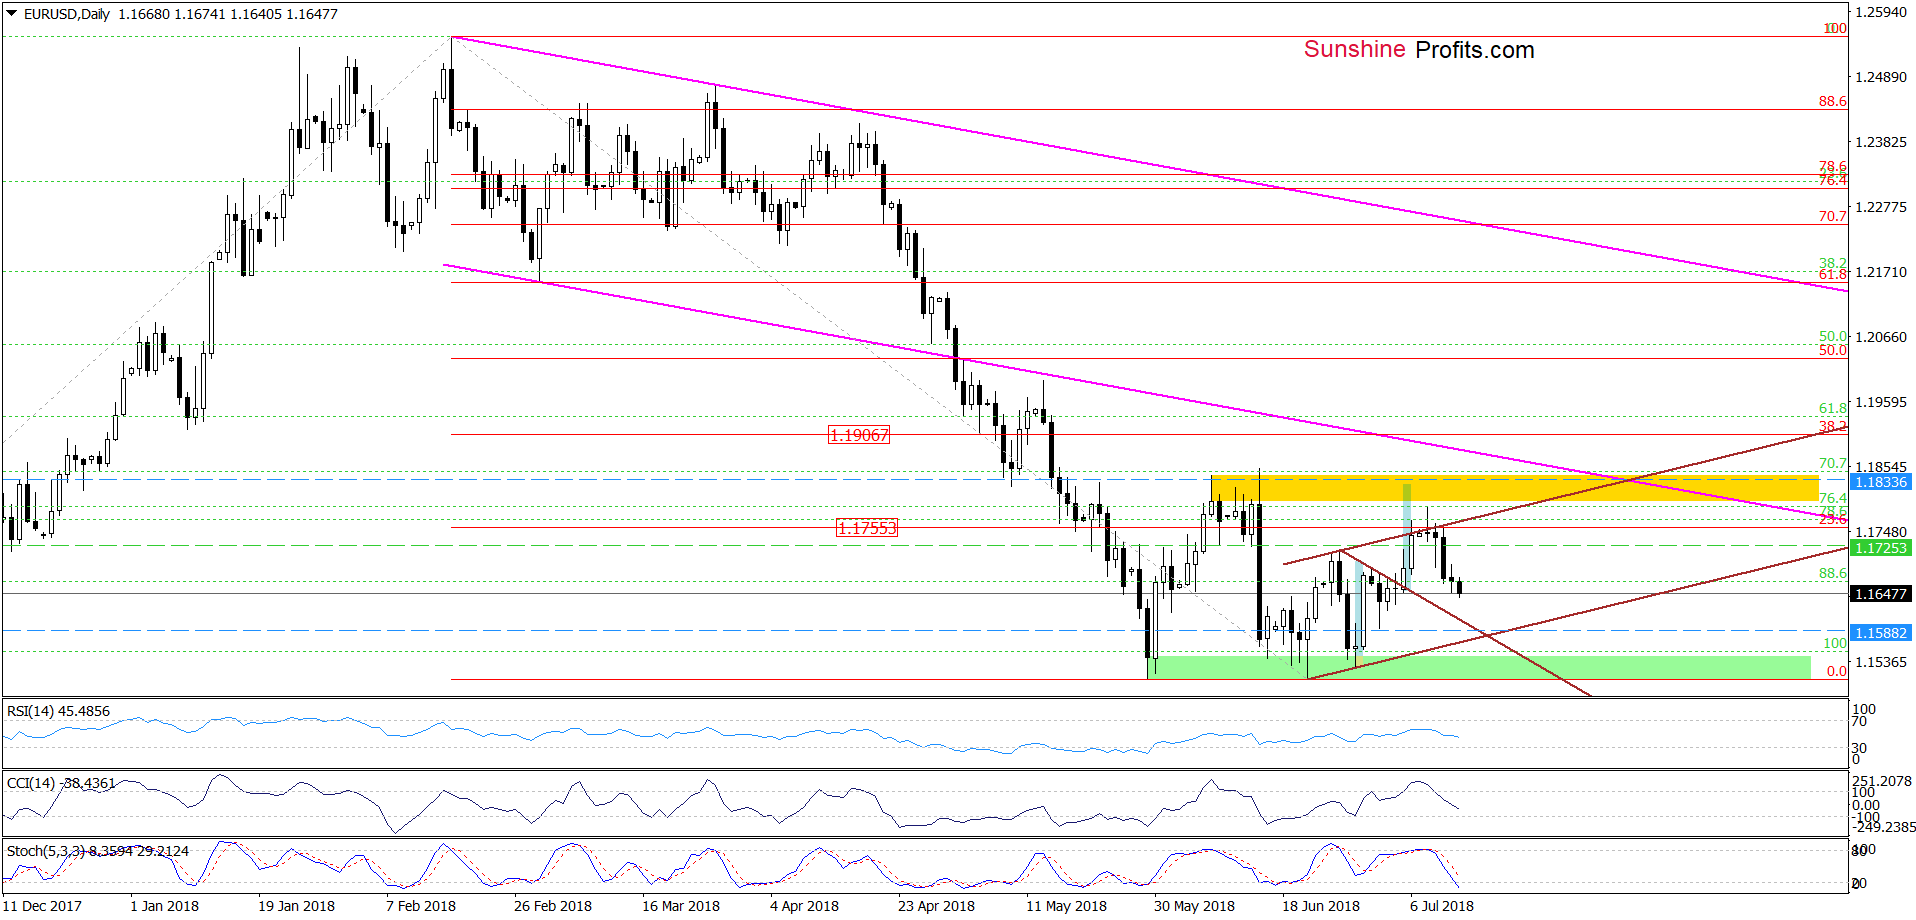
Looking at the daily chart, we see that several unsuccessful attempts to go above the upper border of the brown rising trend channel encouraged currency bears to act, triggering a move to the downside in the previous days.
Earlier today, EUR/USD moved lower once again (making our short positions even more profitable), which in combination with the sell signals generated by the indicators at the beginning of the week suggests further deterioration and a drop to (at least) the previously-broken upper line of the brown triangle.
If this support is broken, currency bears will likely test the lower border of the brown rising trend channel(currently around 1.1570) in the following day(s).
USD/JPY – Breakout and Its Consequences
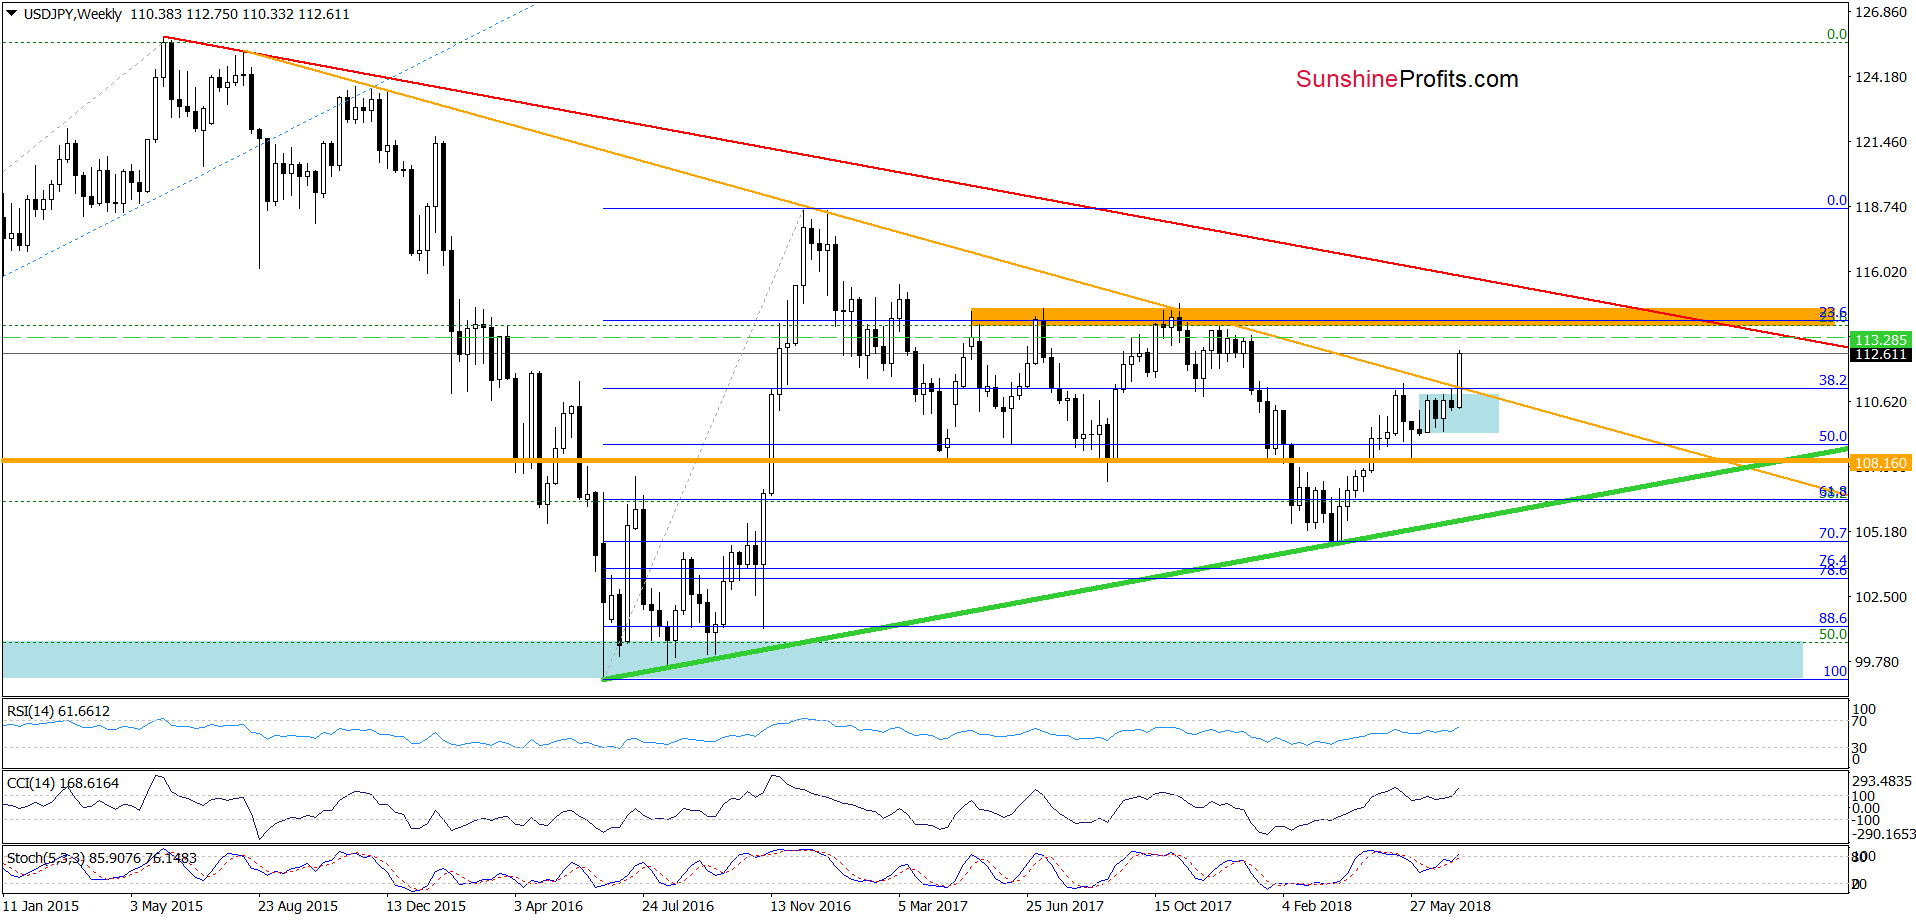
Looking at the weekly chart, we see that this week’s breakout above the major resistance (the orange declining line based on the August 2015, December 2015 and January 2017 peaks) and its positive impact on the price are still in effect, supporting the buyers and higher values of USD/JPY.
How high could the exchange rate climb?
In our opinion, we could see even a test of the orange resistance zone seen on the above chart in the following week(s). At this point it is also worth noting that the pro-growth scenario is reinforced not only by the current situation in the USD Index, but also by the short-term picture of the exchange rate. What do we mean by that?
Let’s take a closer look at the daily chart below.
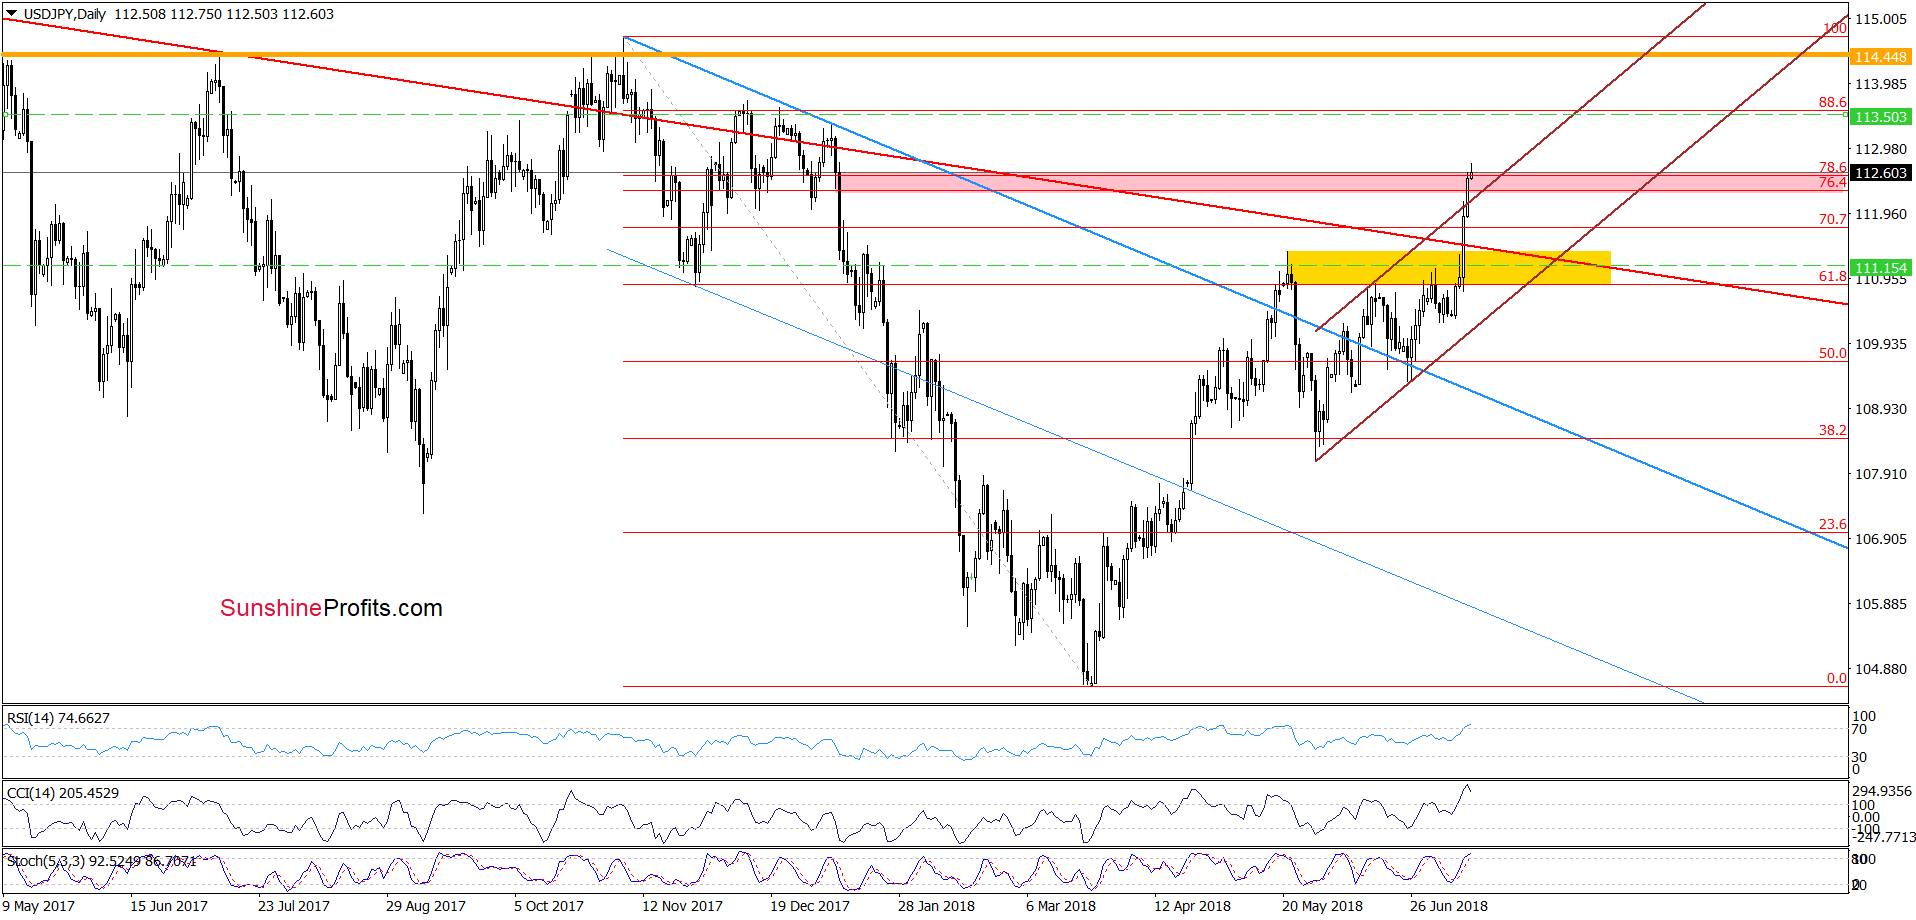
From this perspective, we see that USD/JPY broke above the upper border of the brown rising trend channel and the pink resistance zone (created by the 76.4% and the 78.6% Fibonacci retracements), opening the way to higher levels.
Finishing today’s commentary on this currency pair it also worth noting that although daily indicators climbed to their overbought areas, we think that as long as there are no sell signals another attempt to move higher is likely.
Nevertheless, if we see any reliable sign of currency bulls’ weakness, we’ll consider taking existing profits off the table. Meanwhile, let’s support the bulls with all our strength.
AUD/USD – Which Way Next?
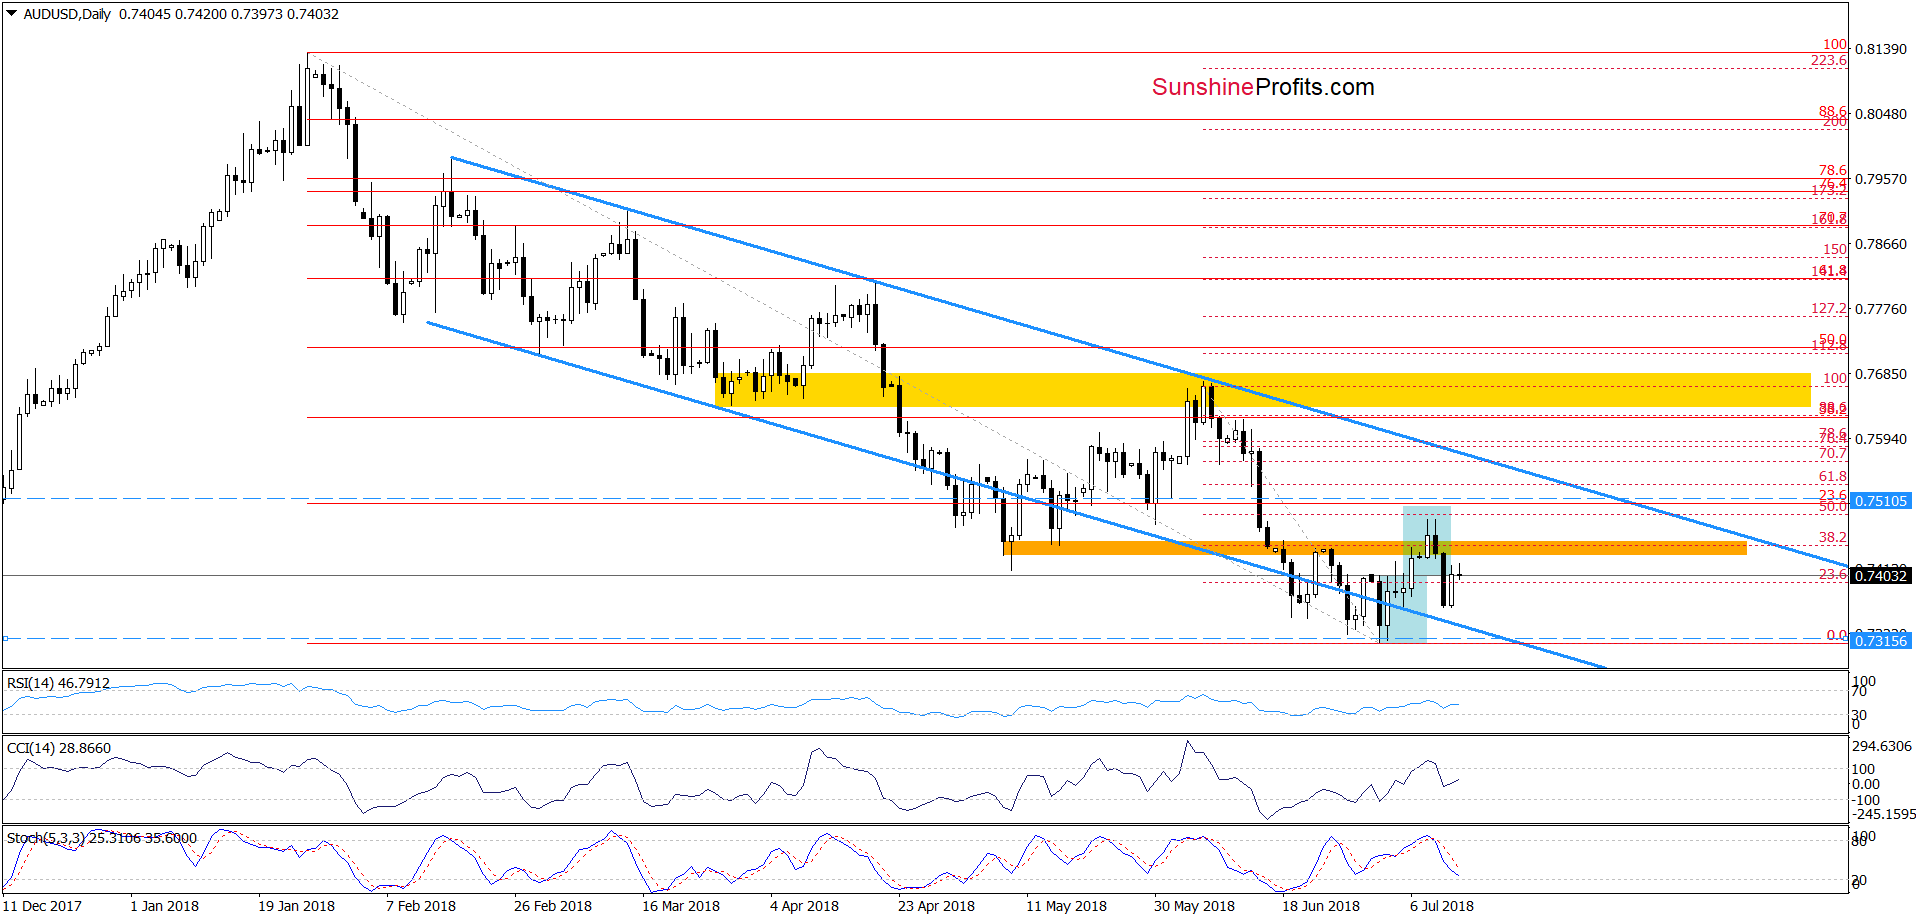
Yesterday, AUD/USD rebounded, erasing some of the earlier losses. Nevertheless, earlier today, currency bears came back to the market, triggering a move to the south and making our short positions more profitable.
Taking this fact into account and the sell signals generated by the CCI and the Stochastic Oscillator (which continue to support the sellers), we think that lower values of the exchange rate are just around the corner.
If this is the case and the pair extends losses from here, we’ll likely see not only a test of the lower border of the blue declining trend channel, but also a decrease to last month’s lows in the following days. We will keep our readers informed should anything change, or should we see a confirmation/invalidation of the above.
If you enjoyed the above analysis and would like to receive daily follow-ups as soon as we create them, please subscribe to our Forex Trading Alerts.
Thank you.
Nadia Simmons
Forex & Oil Trading Strategist
Przemyslaw Radomski, CFA
Founder, Editor-in-chief, Gold & Silver Fund Manager
Gold & Silver Trading Alerts
Forex Trading Alerts
Oil Investment Updates
Oil Trading Alerts
